|
|
 |
|
Calanoida ( Order ) |
|
|
|
Diaptomoidea ( Superfamily ) |
|
|
|
Acartiidae ( Family ) |
|
|
|
Paralabidocera ( Genus ) |
|
|
| |
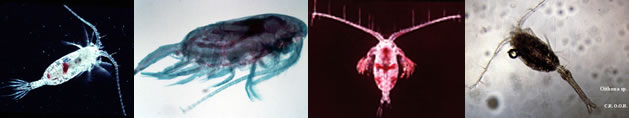
Paralabidocera antarctica (I.C. Thompson, 1898) (F,M) | |
| | | | | | | Syn.: | Paracartia antarctica I.C. Thompson, 1898 a (p.295, figs.F,M);
Paralabidocera hodgsoni Wolfenden, 1908 (p.26, figs.F,M); Cépède, 1914 a (p.152) | | | | Ref.: | | | Farran, 1929 (p.210, 280); Vervoort, 1951 (p.148, Rem.); 1957 (p.145, Rem.); Senö & al., 1963 (p.9, figs.F,M); Tanaka, 1964 (p.10, figs.F,M); Bradford, 1971 b (p.27, figs.F,M, Rem.); Brodsky & Zvereva, 1976 a (p.237, figs.F,M, Rem.); Tanimura, 1992 (p.109, figs. Nauplius, juv., F,M,); Menshenina & Melnikov, 1995 (p.128); Barthélémy, 1999 (p.859, 867, figs.F); 1999 a (p.9, Fig.29, A-F); Costanzo & al., 2002 (p.855, figs. Nauplius); Park & Ferrari, 2009 (p.143, Table 1, Appendix 1, biogeography from Southern Ocean) | 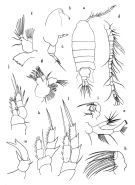 issued from : Tanaka O. in Scient. Rep. Jap. Antarct. Res. Exped., 1964, (E) 22. [Pl. III]. Female: a, habitus (dorsal); b, forehead (right lateral side); c, last thoracic segment and urosome (right lateral side); d, A1; e, A2; f, Md; g, Mx1; h, Mx2; i, Mxp; j, P1; k, P2; l, P4; m, P5.
|
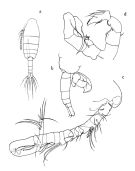 issued from : Tanaka O. in Scient. Rep. Jap. Antarct. Res. Exped., 1964, (E) 22. [Pl. IV]. Male: a, habitus (dorsal); b, last thoracic segment and urosome (right lateral side); c, right A1; d, P5
|
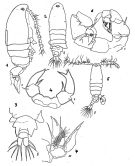 issued from : J.A. Zvereva Issled. Fauny Moreï, 1972, 12 (20). [p.223, Fig.5].
Female: 1, habitus (right lateral side); 2, idem (dorsal); 3, last thoracic segment and urosome; 4, P5.
Male: 5, habitus (dorsal); ; 6, P5; 7, terminal part of left P5.
|
issued from : J.A. Zvereva in Issled. Fauny Moreï, 1972, 12 (20). [p.223, Fig.5]. Female: 1, habitus (right lateral side); 2, idem (dorsal); 3, last thoracic segment and urosome; 4, P5. Male: 5, habitus (dorsal); ; 6, P5; 7, terminal part of left P5.
|
 issued from : E.I. Waghorn in N. Z. J. Mar. Freshw. Res., 1979, 13 (3). [p.468, Fig.8, d]. Male (from 73°32'S, 171°22'E): P5. Scale bars 0.1 mm.
|
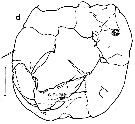
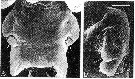 issued from : R.-M. Bathélémy in J. Mar. Biol. Ass. U.K., 1999, 79. [p.866, Fig.10, A-B]. Scanning electon miccrograph. Female: A, genital double-somite (ventral) showing lateral position of genital slits (arrows); B, detail of the left lateral view; Note position of the genital slit (arrow) under a bilobed expansion (arrowhead). Scale bars: 0.020 mm (A, B).
|
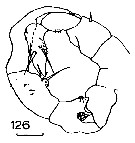 Issued from : J.M. Bradford in N.Z. Oceanogr. Inst., 1971, 206, Part 8, No 59. [p.27, Fig.126]. Male (from western Ross Sea): 126, P5. Scale bar: 100 µm.
|
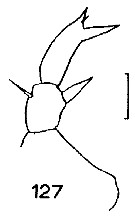 Issued from : J.M. Bradford in N.Z. Oceanogr. Inst., 1971, 206, Part 8, No 59. [p.27, Fig.127]. Female (from western Ross Sea): 127, P5. Scale bar: 100 µm.
|
 Issued from : C. Razouls in Ann. Inst. océanogr., Paris, 1994, 70 (1). [p.180]. Caractéristiques morphologiques de Paralabidocera antarctica femelle et mâle adultes. Terminologie et abbréviations: voir à Calanus propinquus.
| | | | | Compl. Ref.: | | | Sewell, 1948 (p.575); Fukuchi & Tanimura, 1981 (p.37); Ikeda & Hing Fay, 1981 (1982) (p.921, Table 3, respiration); Tanimura & al., 1984 (p.12); Fukuchi & al., 1985 (p.52); Kawaguchi & al., 1986 (tab.2); Zmijewska, 1987 (tab.2a); Tucker & Burton, 1990 (p.591, tab.1, Rem.: seasonal, spatial variations); Eslake & al., 1991 (p.93, Table 1, 2, temporal changes); Tanimura & al., 1996 (p.257, seasonal & vertical distribution, life history); Swadling & al., 1997 (p.39, Table 1, figs. 6, 7, 8, grazing); Atkinson, 1998 (p.289, Table 1, biological data); Mauchline, 1998 (tab.58); Razouls & al., 2000 (p.343, tab. 2, 5, Appendix); Swadling & Gibson, 2000 (p.23, grazing, body weight); Swadling & al., 2000 (p.171, Table 1, 2, figs. 2, 3, lipids vs.stages, life cycles); Swadling, 2001 (p.597, abundance, distribution, life history vs. ice-associated); Beaumont & al., 2001 (p.55); 2002 (p.133, tab.1); Swadling & al., 2004 (p.644, Table 1, 2, , abundance, life cycle , growth); Guglielmo & al., 2007 (p.747, Table 4, 5); Kiko & al., 2008 (p.1000, Table 3); Loots & al., 2009 (p.599, figs.4, 5, 6); Kramer & al., 2011 (p.1062, Table 2, occurrence vs meiofauna); Michels & al., 2012 (p.369, Table 1, occurrence frequency); Lee D.B. & al., 2013 (p.1215, Table 1, abundance, composition) | | | | NZ: | 2 | | |
|
Distribution map of Paralabidocera antarctica by geographical zones
|
| | | | | | 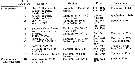 issued from : E.I. Waghorn in N. Z. J. Mar. Freshw. Res., 1979, 13 (3). [p.469, Table 2]. issued from : E.I. Waghorn in N. Z. J. Mar. Freshw. Res., 1979, 13 (3). [p.469, Table 2].
Records of the Antarctic Paralabidocera antarctica.
* A few specimens were taken north of the Antarctic Circle (1 juvenil at 42°06'S). |
 Issued from : A. Tanimura, T. Hoshiai & M. Fukuchi in Antactic Science, 1996, 8 (3). [p.262, Fig.7, b]. Issued from : A. Tanimura, T. Hoshiai & M. Fukuchi in Antactic Science, 1996, 8 (3). [p.262, Fig.7, b].
Seasonal change in percentage composition of developmental stages of Paralabidocera antarctica in sea water in 1982-1983 near Syowa Station (69°00'S, 39°35'E).
n = numbers of individuals examined.
The results indicate that the species has a one-year cycle and inhabits the ice-seawater interface throughout its life span. |
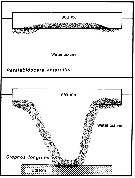 Issued from : A. Tanimura, T. Hoshiai & M. Fukuchi in Antactic Science, 1996, 8 (3). [p.264, Fig.10]. Issued from : A. Tanimura, T. Hoshiai & M. Fukuchi in Antactic Science, 1996, 8 (3). [p.264, Fig.10].
Schematic comparison of the relations with sea ice among Paralabidocera antarctica and Stephos longipes (Kurbjeweit & al., 1993).
Stippled area indicates the main habitat throughout the life cycle in each copepod.
Nota: The two species depend entirely on the ice algae rather phytoplakton in the water as food (Dahms & al., 1990; Kurbjeweit & al., 1993). However, there are differences in their relationship with sea ice through their life cycles. The relationship with sea ice is much weaker for Stephos longipes than for Paralabidocera antarctica. |
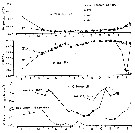 Issued from : A. Tanimura, T. Hoshiai & M. Fukuchi in Antactic Science, 1996, 8 (3). [p.259, Fig.3]. Issued from : A. Tanimura, T. Hoshiai & M. Fukuchi in Antactic Science, 1996, 8 (3). [p.259, Fig.3].
Seasonal change in a: water temperature, b: salinity, and c: chlorophyll a concentration at Siwowa Station.
Data on water temperature and salinity were obtained from the depth of just beneath sea ice (0 m), 2, 4 and 6m at station 1 in 1982-1983. Chlorophyll a concentration is expressed as an average value within bottom 10 cm of ice for sea ice (Stn 1: 1970; Stn A: 1982) and water column (0-8 m) for the sea water (Stn1: 1982-1983). Data from Hoshai, 1981 and Fukuchi & al., 1985. |
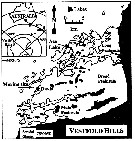 Issued from : K.M. Swadling, A.D. McKinnon, G. De'ath & J.A.E. Gibson in Limnol. Oceanogr., 2004, 49 (3). [p.645, Fig.1] Issued from : K.M. Swadling, A.D. McKinnon, G. De'ath & J.A.E. Gibson in Limnol. Oceanogr., 2004, 49 (3). [p.645, Fig.1]
Sampling locations at the marine site and Ace Lake, Vestfold Hills.
The inset shows position of the Vestfold Hills in Antarctica.
P. antarctica were collected from the water column by four independent tows of an umbrella net (100 µm mesh aperture. At the marine site, the net was towed vertically from 20 m depth (volume filtered, 1.6 m3) and at Ace Lake from 10 m depth (volume filtered 0.8 m3). |
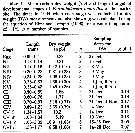 Issued from : K.M. Swadling, A.D. McKinnon, G. De'ath & J.A.E. Gibson in Limnol. Oceanogr., 2004, 49 (3). [p.646, Table 1]. Issued from : K.M. Swadling, A.D. McKinnon, G. De'ath & J.A.E. Gibson in Limnol. Oceanogr., 2004, 49 (3). [p.646, Table 1].
Mean carbon dry weight (SD), length (range) of developmental stages at the marine site in 1994.
The models for calculating weight-specific growth to both the marine and lacustrine populations are developed by Hirst & Lampitt (21998):
Log g = -0.6516 - 0.5244 (log BW) (1)
Log g = 0.0111 (T) - 0.2917 (log BW) - 0.6447 (2)
Where g is the weight-specific growth (d-1), T: water temperature (°C), BW : the body weight (µg individual -1)
Adults (Eq 1) and juveniles (Eq 2) separately. For the juveniles, growth for copepodids CI-CV only, because the nauplii of both populations have long periods of no growth. GFor the marine population, it is assumed an environmetal temperature of - 1°C. However, for the lake population, it was possible that the copepods were experiencing a range of water temperatures of - 0.5 - 10°C as they developed (see Bayly & Burton, 1987; see Fig.2). Because it is not known the primary locations of each stage in the water column while they developed, the calculation of the growth rates at both temperature extremes, which would represent the upper and lower limits of their range. |
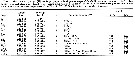 Issued from : K.M. Swadling, A.D. McKinnon, G. De'ath & J.A.E. Gibson in Limnol. Oceanogr., 2004, 49 (3). [p.646, Table 2]. Issued from : K.M. Swadling, A.D. McKinnon, G. De'ath & J.A.E. Gibson in Limnol. Oceanogr., 2004, 49 (3). [p.646, Table 2].
Mean carbon dry weight (SD), length (range) of developmental stages at Ace Lake in 1994. |
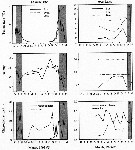 Issued from : K.M. Swadling, A.D. McKinnon, G. De'ath & J.A.E. Gibson in Limnol. Oceanogr., 2004, 49 (3). [p.648, Fig. 2]. Issued from : K.M. Swadling, A.D. McKinnon, G. De'ath & J.A.E. Gibson in Limnol. Oceanogr., 2004, 49 (3). [p.648, Fig. 2].
Water temperature (A, B), water salinity (C, D) and water and ice Chl a concentrations at the marine site and at Ace Lake during 1993-1995.
Shaded areas represent periods of no sea ice cover. |
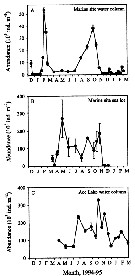 Issued from : K.M. Swadling, A.D. McKinnon, G. De'ath & J.A.E. Gibson in Limnol. Oceanogr., 2004, 49 (3). [p.649, Fig. 3]. Issued from : K.M. Swadling, A.D. McKinnon, G. De'ath & J.A.E. Gibson in Limnol. Oceanogr., 2004, 49 (3). [p.649, Fig. 3].
Abundance (mean ± SE) in the water column (A) and (B) the sea ice at the marine site and in (C) the water column of Ace Lake.
Nota: The standing stock in the water column at the marine site was highest in late February 1994, reaching a maximum of 53,200 m-2. In contrast, low numbers (< 3.000 -2) were recorded from April to July by an increase in August and September. between May and July, > 98% of the population was found in the sea ice (Fig.3B). Within the sea ice, a maximum standing stock of 270,800 m-2 was reached in May, and a minimum of 45,200 individuals m-2 was seen in August (Fig.3B).
In Ace Lake, the standing stock in the water column was variable, ranging from ± 60,000 individuals m-23 on 28 June to a maximum of 340,000 ind. m -2 on 26 October (Fig.3C). |
 Issued from : K.M. Swadling, A.D. McKinnon, G. De'ath & J.A.E. Gibson in Limnol. Oceanogr., 2004, 49 (3). [p.650, Fig. 4]. Issued from : K.M. Swadling, A.D. McKinnon, G. De'ath & J.A.E. Gibson in Limnol. Oceanogr., 2004, 49 (3). [p.650, Fig. 4].
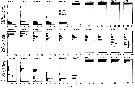
Percentage composition of developmental stages in the water column and sea ice at the matine site, December 1993-February 1995.
Brackets labeled ''fc'' denote the fast cohorte. |
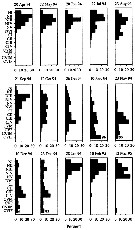 Issued from : K.M. Swadling, A.D. McKinnon, G. De'ath & J.A.E. Gibson in Limnol. Oceanogr., 2004, 49 (3). [p.651, Fig. 5]. Issued from : K.M. Swadling, A.D. McKinnon, G. De'ath & J.A.E. Gibson in Limnol. Oceanogr., 2004, 49 (3). [p.651, Fig. 5].
Percentage composition of the developmental stages in Ace Lake, April 19954-March 1995.
Numbers of the graphs for November and December represent the percentage of females carying spermatophores. |
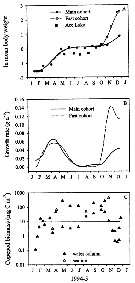 Issued from : K.M. Swadling, A.D. McKinnon, G. De'ath & J.A.E. Gibson in Limnol. Oceanogr., 2004, 49 (3). [p.652, Fig. 6]. Issued from : K.M. Swadling, A.D. McKinnon, G. De'ath & J.A.E. Gibson in Limnol. Oceanogr., 2004, 49 (3). [p.652, Fig. 6].
(A): Annual cycle of mean individual biomass of cohorts sampled at the marine site and Ace Lake.
(B): The corresponding instantaneous daily growth rates for the marine cohorts, and (C) biomass of the marine populations.
The stippled line indicates the calculated geometric mean biomass.
Nota: Annual somatic production at the marine site was estimated 123 mg C m-2 yr-1. This number was low compared with estimates of annual secondary production by a large polar copepods such as calanus glacialis (8.4 g C m-2 yr-1, after Slagstad & Tande, 1990). The similar sized Psedocalanus minutus achieved yerly rates of 341-496 mg C m-2 ur-1 during 1957 in Ogac Lake (McLaren, 1969).
Instantaneous growth rates calculated for the marine site showed a variable growth (0.04-0.14 d-1). The lacustrine population in general had faster growth rates tha the marine population (0.10-0.26 d-1) and reached maturity at a smaller size, ythis is attibuted, in part, to the higher environmental temperatures experienced by the lacustrine population. |
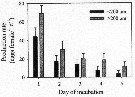 Issued from : K.M. Swadling, A.D. McKinnon, G. De'ath & J.A.E. Gibson in Limnol. Oceanogr., 2004, 49 (3). [p.652, Fig. 7]. Issued from : K.M. Swadling, A.D. McKinnon, G. De'ath & J.A.E. Gibson in Limnol. Oceanogr., 2004, 49 (3). [p.652, Fig. 7].
Egg-production rates for the Paralabidocera antarctica females from the marine site, July 1995.
The differences observed between food treatments (chain-diatoms < 200 µm or > 200 µm) in the egg-production experiments probably related to the greater abundance of large chain-forming diatoms in the > 200 µm treatment.
Nota: Egg-production rates are high (up to 69 eggs female-1 d-1, in accordance with the universal strategy of polar copepods to assume high levels of fecundity at maturity (Conover & Huntley, 1991). In terms of eggs produced per day, the egg-production rates of P. antarctica were in the midrange of those at temperatures <6°C, but the maximum specific egg production rate (0.88 d-1) was an order of magnitude higher than has been previously recorded (see in Mauchline, 1998, p.282, fig. 45). However, this may merely reflect a shortened, intensive period of egg production compared with other polar copepods. |
| | | | Loc: | | | Antarct. (Amundsen Sea, South Shetland Is., Peninsula, Scotia Sea, Weddell Sea, Syowa Station, Fletcher Lake, Ellis fjord, Ross Sea, Davis Station-Gardner Is., Terra Nova Bay, Dumont d'urville), New Zealand (very rare in Farran, 1929: juvenil form) | | | | N: | 43 | | | | Lg.: | | | (25) F: 2,07-1,98; (31) F: 1,7-1,67; (35) F: 2,1-1,92; M: 1,75-1,56; (114) F: 1,92-1,88; M: 1,62-1,54; (195) F: 1,5; 2-1,55; M: 1,6; (1322) (Marine site) F: 1,66-2,05; M: 1,36-1,77; (Ace Lake) F: 1,09-1,24; M: 1,02-1,09; {F: 1,09-2,05; M: 1,02-1,77} | | | | Rem.: | Sampling depth (Antact.): 0-100 m. Ice-associated.
After Atkinson (1998, p.296) the species feed on ice algae.
After Bradford (1971 b, p.28) stray specimens heve been found as far north as 42°06' S, 175°13' E.
Ohtsuka & Nishida (2017, p.584) underline the naupliar dormancy from this Antartic copepod (see Tanimura & al., 1996). | | | Last update : 19/06/2023 | |
|
|
 Any use of this site for a publication will be mentioned with the following reference : Any use of this site for a publication will be mentioned with the following reference :
Razouls C., Desreumaux N., Kouwenberg J. and de Bovée F., 2005-2024. - Biodiversity of Marine Planktonic Copepods (morphology, geographical distribution and biological data). Sorbonne University, CNRS. Available at http://copepodes.obs-banyuls.fr/en [Accessed April 20, 2024] © copyright 2005-2024 Sorbonne University, CNRS
|
|
|
|


;)
;)
;)
;)
;)
;)
;)
;)
;)

;)
;)
;)
;)
;)
;)
;)
;)
;)
;)
