|
|
 |
|
Calanoida ( Order ) |
|
|
|
Diaptomoidea ( Superfamily ) |
|
|
|
Acartiidae ( Family ) |
|
|
|
Acartia ( Genus ) |
|
|
|
Acartiura ( Sub-Genus ) |
|
|
| |
Acartia (Acartiura) omorii Bradford, 1976 (F,M) | |
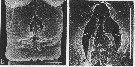
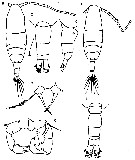
| | | | | | | Syn.: | Acartia clausi : Mori, 1937 (1964) (p.103, figs.F,M); Shen & Bai, 1956 (p.223, figs.F,M); Tanaka, 1965 (p.387, figs.F,M); Anraku, 1975 (p.79, microdistribution); Hirota & Hara, 1975 (p.115, fig.5); Hirota & Hara, 1975 (p.115, fig.5); Hirota & Uno, 1977 (p.77, eggs, seasonal abundance); ? Itoh & IIzuka, 1979 (p.5); Uye, 1980 (p.1, development); 1980 a (p.11, development); 1982 (p.21, abundance, seasonal cycle); ? Hirota 1981 (p.19, Table 1, length-weight-CHN, in Inland Sea, Japan); Uye, 1981 (p.255, egg production); 1982 (p.149, relation length-weight-C-N); 1982 a (p.55, population dynamics, production); Uye & al., 1984 (p.390, resting eggs-survival); Uye, 1985 (p.440, resting eggs); Ayukai, 1987 (p.137, feeding vs ESD, defaecation rate); Madhupratap & al., 1996 (p.77, Table 2: resting eggs); . | | | | Ref.: | | | Bradford, 1976 (p.173,figs.F,M); Ueda, 1986 b (p.134, figs.F,M); Kang Lee, 1990 (p.378, figs.F,M, Rem.); Yoo & al., 1991 (p.259); Chihara & Murano, 1997 (p.670, Pl.16: F,M); Bradford-Grieve, 1999 (N°181, p.5, figs.F,M); Barthélémy, 1999 (p.858, 862, figs.F); 1999 a (p.9, Fig.22, E, F); Soh & Suh, 2000 (p.332, Table I); Seuront, 2005 (p.1301, tab.I, Rem.); Lee S. & al., 2019 (p.71, 72: GenBank, 82, Table 2). | 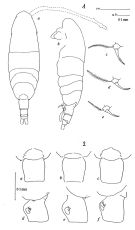 issued from : J.M. Bradford in N.Z. J. Mar. Freshw. Res., 1976, 10 (1). [p.174-175, Figs.11,12]. Female (from Japan): 1a, habitus (dorsal view); 1b, idem (lateral view); 1c-e, P5; 2a-c, genital segment (dorsal view); 2d-f, idem (lateral view).
|
 issued from : J.M. Bradford in N.Z. J. Mar. Freshw. Res., 1976, 10 (1). [p.175, Fig.13]. Male (from japan): a, habitus (dorsal view); b, idem (lateral view); c, posterior surface of P5; d, terminal segment of left P5.
|
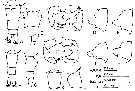
 issued from : O. Tanaka in Publs Seto Mar. Biol. Lab., 1965, XII (5). [p.388, Fig.244]. As Acartia clausi. Female: a, habitus (dorsal); b, last thoracic segment and urosome (left lateral side); c, proximal portion of A1; d, P5. Nota: Rostral filament absent. Abdomen 3-segmented, contained 3.3 times in the length of cephalothorax The abdomen segments and furca are in the proportional lengths as 41:24:14:21 = 100. Thorax segments and genital segment covered with fine hairs. P5: in the middle segment squarish in shape; the claw-like spine swollen at the basal portion and spinulose on each side; the outer marginal seta longer than the claw. Genital and 2nd abdominal segments fringed with fine teeth on the distal margin Male: P5. Nota: Lateral corner of last thoracic segment furnished with short hairs. Abdomen contained 3.1 times in the length of cephalothorax. The abdominal segments and furca are in the proportional lengths as 15:30:19:7:11:18 = 100. 2nd to 4th fringed with minute spinules on the dorsal distal margin.
|
 issued from : C.-j. Shen & S.-o. Bai in Acta Zool. sin., 1956, 8 (2). [Pl.VII, Figs.49-51]. As Acartia clausi. Male (from Chefoo): 49, habitus (dorsal); 50, P5. Female: P5. Nota: In the specimens, the 1st and 2nd abdominal segments of the female and the 2-4 abdominal segments of the male are without spinules on their posterior margins.
|
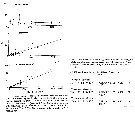
 issued from : H. Ueda in J. Oceanogr. Soc. Japan, 1986, 42. [p.136, Fig.2]. Comparative aspects between A. omorii, A. hudsonica and A. clausi. A. omorii (from Maizuru Bay, Japan): Female: A-B, urosome (dorsal and lateral, respectively);. Male: C, P5 (posterior view); D-E, 3rd segment of right P5 (other specimens). A. hudsonica (from Maizuru): Female: F-G, urosome (dorsal and lateral); H, P5 (posterior view); I-J, 3rd segment of right P5 (other specimens). A. clausi (after Bradford, 1976): Female: K-L, genital segment (dorsal and lateral, respectively).
|
 issued from : H. Ueda in J. Oceanogr. Soc. Japan, 1986, 42. [p.136, Table 1]. Comparative list of distinctive characters of A. omorii and A. hudsonica, after Bradford, 1976.
|
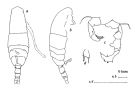
 issued from : T. Mori in The pelagic Copepoda from the neighbouring waters of Japan, 1937 (2nd edit., 1964). [Pl.50, Figs.8-13]. As Acartia clausi. Female: 8, habitus (dorsal); 10, P5; 13, forehead (ventral). Nota: Rostral filaments absent. Urosomal segments with fine spinules on the posterior margins. A1 with without spines on the proximal segments, and extend about the end of the genital segment. The middle segment of P5 is nearly as long as its width; the claw-like terminal segment is stout; the marginal seta is much longer than the terminal segment. Male: 9, habitus (dorsal); 11, P5; 12, right A1 (distal portion). Nota: Right leg of P5 consists of 4 segments; the inner margin of the 2nd segment has a blunt process of the distal portion; the 3rd segment also has a blunt process on the inner margin. Left leg of P5 consists of 3 segments; the terminal segment has a vermiform appendage and 1 spine.
|
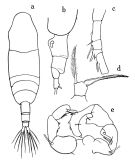
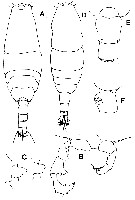 issued from : Y.-S. Kang & S.-S. Lee in Bull. Korean Fish. Soc., 1990, 23 (5). [p.380, Fig.1]. Female (from Korea): D, habitus (dorsal); E, 1st and 2nd urosomal segments (dorsal); F, genital segment (lateral). Male: A, habitus (dorsal); B, P5; C, inner lobe of 3rd segment of right P5.
|
 issued from : R.-M. Bathélémy in J. Mar. Biol. Ass. U.K., 1999, 79. [p.860, Fig.3, E, F]. Scanning electon miccrograph. Female (from Maizuru Bay, Japan): E, genital double-somite (ventral); F, genital area (external ventral view); Note the two lengthened genital slits (small arrows) each protected by a lamellar flap (arrowheads) and the medioventral position of genital area. Scale bars: 0.030 mm (E, F). Symbol: * = fixation of the spermatophore.
|
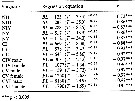
 issued from : L. Seuront in J. Plankton Res., 2005, 27 (12). [p.1303, Table I]. Comparisons of distinctive characters of Acartia species closely related to each other.
|
 issued from : L. Seuront in J. Plankton Res., 2005, 27 (12). [p.1304, Table II]. Prosome length and body proportions of Acartia omorii males and females sampled in the southern bight of the North Sea (France) and the type locality (Tokyo Bay, Japan) and Acartia clausi males and females sampled in the southern bigght of the North Sea (France).
|
 issued from : L. Seuront in J. Plankton Res., 2005, 27 (12). [p.1304, Table III]. Allometric relationships obtained between prosome length and different morphometric ratios for Acartia omorii adult males and females sampled in the southern bight of the North Sea (France) and in the type locality (Tokyo Bay, Japan).
|
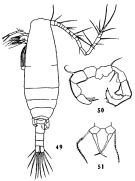
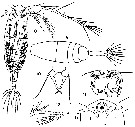
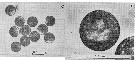 Issued from : R. Hirota & S. Uno in Bull. Plankton Soc. Japan, 1977, 24 (2). [p.80, Fig.3, C, D]. Pelagic eggs of Acartia clausi (= A. omorii) from vicinity of Amakusa-Matsushima (western Kyushu, Japan).
|
 Issued from : M. Chihara & M. Murano in An Illustrated Guide to Marine Plankton in Japan, 1997. [p.674, Pl. 16, fig.6 a-g]. Female: a, habitus (dorsal); b, last thoracic segment and urosome (dorsal); c, same (lateral, right side); d, P5. Male: e, habitus (dorsal); f, last thoracic segment and urosome (dorsal); g, P5 Nota: numbers show caracteristics of this species to compare with A. hudsonica.
|
 Issued from : H.Y. Soh & H.-L. Suh in J. Plankton Res., 2000, 22 (2). [p.332, Table I]. Distinctive characters of Acartia omorii. a: referred from Ueda (1986). Nota: Compare the distinctive characters with the closely related species A. hongi, A. hudsonica in the coastal waters of Korea, and A. bifilosa.
| | | | | Compl. Ref.: | | | Ueda, 1987 (p.691); Uchima, 1988 (p.93, gut content); Hirakawa, 1988 (p.337, invasive ); Hirakawa & al., 1990 (tab.3); Hirakawa, 1991 (p.376: fig.2); Uye & Takamatsu, 1990 (p.97, red-tide flagellate effects); Yoo, 1991 (tab.1); Hattori, 1991 (tab.1, Appendix); Hwang & Choi, 1993 (tab.3); Kimmerer, 1993 (p.267, tab.2); Uye & Kaname, 1994 (p.43, length v.s. fecal pellet volume); Kotani & al., 1996 (tab.2); Liang & Uye, 1996 (p.109, population dynamics, production); 1997a (p.415, mortality rate); Mauchline, 1998 (p.507); Ueda & al., 2000 (tab.1); Lacuna & Uye, 2001 (p.143, UVB radiation effect); Shimode & Shirayama, 2004 (tab.2); Hsiao & al., 2004 (p.325, tab.1); Dur & al., 2007 (p.197, Table IV); Kang J.-H. & al., 2007 (p.82, fig.3, temporal variation vs. temperature & predation effect); Youn & Choi, 2007 (p.222: Table 1, egg production); Kang H.-K & al., 2007 (p.236, dynamic population, egg production, production); Ohtsuka & al., 2008 (p.115, Table 4, 5); Suzuki & al., 2008 (p.541, predation); Brylinski, 2009 (p.253: Tab.1, p.256: Rem.); Chiba & al., 2009 (p.1846, Table 1, occurrence vs temperature change); Hirst & al., 2010 (p.2193, sex ratio); Itoh & al., 2011 (p.129, vertical distribution); Kang J.-H., 2011 (p.219, occurrences, inter-annual variability vs t° & Sal., Chl.a, Rem.: p.222); Hsiao S.H. & al., 2011 (p.475, Appendix I); Beltrao & al., 2011 (p.47, fig.3, Table 1, 2, 3, density vs time); DiBacco & al., 2012 (p.483, Table S1, ballast water transport); Jang M.-C & al., 2012 (p.37, abundance and seasonal distribution); Tachibana & al., 2013 (p.545, Table 1, seasonal change 2006-2008); Suzuki, K.W. & al., 2013 (p.15, Table 2, 3, 4, estuaries, annual occurrence); Seo & al., 2013 (p.448, Table 1, occurrence); Oh H-J. & al., 2013 (p.192, Table 1, occurrence); Ohtsuka & Nishida, 2017 (p.565, 578, Table 22.1, Fig.22.3: central station in Japanese waters); | | | | NZ: | 5 | | |
|
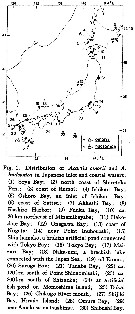
Distribution map of Acartia (Acartiura) omorii by geographical zones
|
| | | | | | 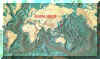 Chart of 1996 Chart of 1996 | |
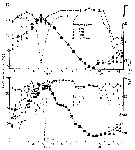
 issued from : H. Ueda in J. Oceanogr. Soc. Japan, 1986, 42. [p.136, Fig.1]. issued from : H. Ueda in J. Oceanogr. Soc. Japan, 1986, 42. [p.136, Fig.1].
Distribution of A. omorii and A. hudsonica in Japanese inlet and cosatal waters. |
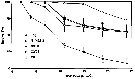
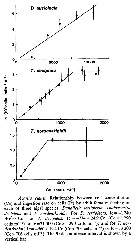
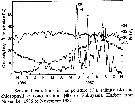
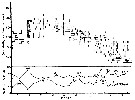 issued from : S.-I. Uye in J. Exp. Mar. Biol. Ecol., 1982, 57. [p.65, Fig.10]. issued from : S.-I. Uye in J. Exp. Mar. Biol. Ecol., 1982, 57. [p.65, Fig.10].
Generation of Acartia clausi ( = A. omorii) estomated from adult female cephalothorax length and relative abundance of CI and CIV as a percentage of all copepodites during the period from December, 1977 to September, 1978 in Onagawa Bay (Japan).
G: numero of the generation.
Nota: The life cycle is continuous throughout the year, while the fluctuation in population abundance is remarkable. The number of generations during the year is six.
If food is in excess, the females lay eggs at a physiologically maximum rate which is controlled by temperature (See Uye, 1981). Unless strong upwelling occurs, most eggs after spawning sink to the bottom and are inhibited from hatching for some period until being washed free from the bottom by wave action or tidal current (see Landry, 1978). Once eggs can hatch into nauplii, the larvae follow a characteristic growth mode, i.e. isochronal development (see Miller & al., 1977). |
 issued from : S.-I. Uye in J. Exp. Mar. Biol. Ecol., 1982, 57. [p.60, Fig.3]. issued from : S.-I. Uye in J. Exp. Mar. Biol. Ecol., 1982, 57. [p.60, Fig.3].
Seasonal change in water temperature at depths of 1, 5, 10 m and near the bottom, and salinity at depths of 1 and 10 m at inermost part of Onagawa Bay (38°25'N, 141°30'E) |
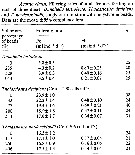
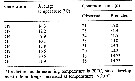
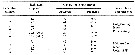 issued from : S.-I. Uye in J. Exp. Mar. Biol. Ecol., 1982, 57. [p.66, Table I]. issued from : S.-I. Uye in J. Exp. Mar. Biol. Ecol., 1982, 57. [p.66, Table I].
Estimated generation lengths from field data compared with lengths predicted from temperature during development.
a: Prediction is made assuming temperature is 20°C, since the development rate does not increase above 20°C.
Uye (1980) has previously investigated the postembryonic development at various temperatures with excess food in the laboratory and found that the time taken from egg-laying to adult stage is 17.9 times duration of the embryo which can be expressed by the beleradek equation. |
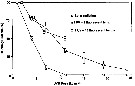
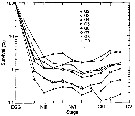
 issued from : S.-I. Uye in Bull. Plankton Soc. Japan, 1980, 27 (1). [p.13, Fig.2]. issued from : S.-I. Uye in Bull. Plankton Soc. Japan, 1980, 27 (1). [p.13, Fig.2].
Post-embryonic development of Acartia clausi (= A. omorii at 7.3, 11.2, 14.5, 16.4 and 20.3°C, cultured with excess food.
Each point is the time required for 50 % of individuals molting into each stage. Straight lines are fitted by the least squares to all points except one entering into N III. |
 Issued from : D.G. Lacuna & S.-I. Uye in J. Plankton Res., 2001, 23 (2). [p.152, Fig.9]. Issued from : D.G. Lacuna & S.-I. Uye in J. Plankton Res., 2001, 23 (2). [p.152, Fig.9].
Survival of some selected developmental stages of Acartia omorii exposed at different UVB doses under simultaneous irradiation of enhanced Photosynthetically Active Radiation (PAR: 400-700 nm). Vertical line denotes standard deviation.
Animals collected at Ondo (Kune, Japan).
Nota: no deleterious effect was inducede by UVA (320-400 nm) or PAR (400-700 nm), but UVB inflicted a more damaging effect with increasing UVB dose.
Among various life stages, eggs, particularly freshly-spawned ones (< 2 h old), were most susceptible, and adult females least susceptible. The feeding and egg production of adult females were not sibhificantly reduced until the UVB dose was elevated to 15.0 kJ per m2. |
 Issued from : D.G. Lacuna & S.-I. Uye in J. Plankton Res., 2001, 23 (2). [p.152, Fig.10]. Issued from : D.G. Lacuna & S.-I. Uye in J. Plankton Res., 2001, 23 (2). [p.152, Fig.10].
Hatching success of Acartia omorii eggs exposed at different solar UVB doses. Results from the two laboratory experiments using one UV plus one fluorescent lamp, and two UV plus 15 fluorecent lamps, are also plotted for comparison. Vertical line denotes standard deviation.
Nota: Experiment using solar UVB demonstrated that present-day levels of solar UVB radiation caused reduced hatching success of A. omorii eggs. In the habitat of A. omorii, however, due to high attenuation properties of the water, the solar UVB radiation may affect only young developmental stages distributed near the sea surface. |
 Issued from : H. Bi, K.A. Rose & M.C. Benfield in Mar. Ecol. Prog. Ser., 2011, 427. [p.157, Table 5]. Issued from : H. Bi, K.A. Rose & M.C. Benfield in Mar. Ecol. Prog. Ser., 2011, 427. [p.157, Table 5].
Instantaneous mortality rates (individuals per day) from litterature. |
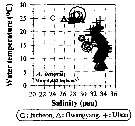 Issued from : J.-H. Kang in Ocean Sci. J., 2011, 46 (4). [p.228, Fig.5] Issued from : J.-H. Kang in Ocean Sci. J., 2011, 46 (4). [p.228, Fig.5]
Abundance-temperature-salinity diagram of A. omorii observed in the seaports from Korea during 3 years (2007-2009). |
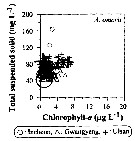 Issued from : J.-H. Kang in Ocean Sci. J., 2011, 46 (4). [p.229, Fig.6] Issued from : J.-H. Kang in Ocean Sci. J., 2011, 46 (4). [p.229, Fig.6]
Abundance-total suspended solid-chlorophyll-a diagram of A. omorii observed in the seaports from Korea during 3 years (2007-2009). |
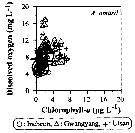 Issued from : J.-H. Kang in Ocean Sci. J., 2011, 46 (4). [p.230, Fig.7] Issued from : J.-H. Kang in Ocean Sci. J., 2011, 46 (4). [p.230, Fig.7]
Abundance-dissolved oxygen-chlorophyll-a diagram of A. omorii observed in the seaports from Korea during 3 years (2007-2009). |
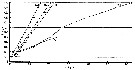
 Issued from : T. Ayukai in Mar. Biol., 1987, 94. [p.580, Fig.1]. As A. clausi (= A. omorii. Issued from : T. Ayukai in Mar. Biol., 1987, 94. [p.580, Fig.1]. As A. clausi (= A. omorii.
Relationship between ingestion rate and defecation rate of adult females feeding on each of three algal species, different by the equivalent spherical diameter (ESD).
The fecal pellet measurements in determining the ingestion rate of copepods has been discussed (Marshall & Orr, 1955; Gaudy, 1974; Reeve & Walter, 1977), but, Ayukai & Nishizawa (1986) reported that the volume of cells ingested by Calanus pacificus was directly correlated with that of their fecal pellets, and that the ingestion rate of cells was indirectly calculated by determining the defecation rate.
In Table 1 the ESD and volume respectively of the three species of algae offered to females are : Dunaliella tertiolecta: 5,6 µm, 91 ± 24 µm; Thalassiosira decipiens 13,4 µm, 1270 ± 180 µm3; Thalassiosira nordenskioldii 17.7 µm, 2880 ± 390 µm3.
The adult females Acartia clausi (= A. omorii) are sampled in Onagawa Bay (northeast mainland of Japan). |
 Issued from : T. Ayukai in Mar. Biol., 1987, 94. [p.581, Fig.2]. As A. clausi (= A. omorii). Issued from : T. Ayukai in Mar. Biol., 1987, 94. [p.581, Fig.2]. As A. clausi (= A. omorii).
Relationship between cell concentration and ingestion rate on cells by adult females feeding on each three algal species. |
 Issued from : T. Ayukai in Mar. Biol., 1987, 94. [p.582, Fig.3 & Table 7]. As A. clausi (= A. omorii. Issued from : T. Ayukai in Mar. Biol., 1987, 94. [p.582, Fig.3 & Table 7]. As A. clausi (= A. omorii.
Relationship between bead concentration and ratio of ingested beads to ingested cells for adult females feeding on each three algal species in mixtures with polystyrene beads (15.7 µm diameter). |
 Issued from : T. Ayukai in Mar. Biol., 1987, 94. [p.585, Table 6]. As A. clausi (= Acartia omorii). Issued from : T. Ayukai in Mar. Biol., 1987, 94. [p.585, Table 6]. As A. clausi (= Acartia omorii).
Filtering rates of adult females feeding on each of three algae, singly or in mixture with polystyrene beads. |
 Issued from : T. Ayukai in Mar. Biol., 1987, 94. [p.583, Table 3]. As A. clausi (= Acartia omorii). Issued from : T. Ayukai in Mar. Biol., 1987, 94. [p.583, Table 3]. As A. clausi (= Acartia omorii).
Ingestion rates of adult females feeding on Thalassiosira decipiens singly (13.4 µm diameter) or in mixtures with polystyrene beads (15.7 µm diameter). |
 Issued from : T. Ayukai in Mar. Biol., 1987, 94. [p.584, Table 5]. As A. clausi (= Acartia omorii). Issued from : T. Ayukai in Mar. Biol., 1987, 94. [p.584, Table 5]. As A. clausi (= Acartia omorii).
Ingestion rates of juveniles and adults feeding on Thalassiosira decipiens singly (13.4 µm diameter) or in mixture with polystyrene beads (15.7 µm diameter).
The present study shows that juvenile copepods discriminate between beads and cells more succesfully than adults and suggests that the presence of beads rarely affects the ingestion rate of juvenile on cells. Juvenile copepods have an advantage in maximizing the net energy gain over adults, especiially when suspended particulate matter consists mainly of detritus and nanoplankton dominates over microplankton. Adversely, adult copepods need tactical feeding behaviors under such conditions; the predatory feeding and the utilisation of large particles such as fecal pellets are the possible ones (Ayukai, 1986). [[also, see the vertical distribution different between juvenile stages and adults and the structure of mouthpart appendages (Nival & Nival, 1976: Particle retention efficiencies of an herbivorous copepod, A. clausi, adult and copepodite stages: effects on grazing). CR.]].
When mixtures of beads and Thalassiosira weissflogii were offered to stages N III to C II (Fernandez, 1979) and C IV to VI (Huntley & al., 1983) of Calanus pacificus, bead interference was observed only in individuals in the latter stages. Similarly, bead interference was more probable for adult female A. omorii than for the juveniles (Table 5). These may result from small copepods having a higher ability to perceive cells individually than large ones. This notion may be supported by a finding that T. weissflogii are individually perceived by small Eucalanus species, but poorly perceived by large ones such as E. elongatus (Price & Paffenhöfer, 1986).
In a mixture of beads and T. decipiens, A. omorii with hihgh food requirements tend to ingest more beads than those with low food requirements, i.e. starved adult females vs well fed ones, adult females vs adult males and spawning females vs post-spawning females (Table 5). Three possibilies have been considerd:
- beads elicit some response from copepods with high food requirements, though beads offered singly were ingested by neither starved nor well fed adult female.
- Copepods with high food requirements respond to cells at a longer distance than those with low food requirements. A chance of bead ingestion may increase with increasing response distance. These explanations are based on the assumption that the former have a higher ability to perceive cells than the latter.
- Copepods with high food requirements devote more time collecting cells pasively, and reluctantly ingest more beads than those with low food requirements. It is necessary to test these possibilities. |
 Issued from : T. Ayukai in Mar. Biol., 1987, 94. [p.584, Table 4]. As A. clausi (= Acartia omorii). Issued from : T. Ayukai in Mar. Biol., 1987, 94. [p.584, Table 4]. As A. clausi (= Acartia omorii).
Ingestion rates of adult females feeding on Dunaliella tertiolecta (ESD = 5.6 µm diameter) singly or in mixtures with polystyrene beads (15.7 diameter).
Female selectively ingested D. tertiolecta in mixtures with beads, the volume of the later being 20 times larger than of the former. The simplest model of the apparent size-selective feeding of copepods (Boyd, 1976; MLam & Frost, 1976; Friedman, 1976) cannot explain this result.. Copepods have numerous chemoreceptors on the moth part (Friedman & Strickler, 1975; Friedman, 1980). Direct cinematographic observations have revealed that copepods detect the chemical properties from cells at a distance (Alcaraz & al., 1980; Paffenhöfer & al., 1982).
Copepods capture individually perceived cells in an active mode and poorly perceived ones in a passive mode (Price & al., 1983).
- In an active mode, copepods bring individual cells to the mouthpart by maneuvering the movements of feeding appendages, capture the water parcel with a cell inside and then remove the water by squeezing it out (Koehl & Strickler, 1981; Strickler, 1982)
- In a passive mode, copepods accumulate cells near the mouthpart by continuous low amplitude vibration of the 2nd maxillae (Mx2) and ingest these cells somewhat inefficienlly (Price & al., 1983)
The pattern of the movements of feeding appendages is different between A. omorii and other calanoids (Conover, 1956; Gauld, 1966). Little is known as to whether or not A. omorii capture differently perceived cells in different feeding modes. However, the results of experiments are well explained by assuming that the female A. omorii ingest Thalassiosira nordenskioldii (ESD =17.7 µm diameter) in a active mode, Dunaliella tertiolecta (ESD = 5.6 µm diameter) in a passive mode and T. decipiens (ESD = 13.4 µm diameter) in both modes.
The presence of beads (15.7 µm diameter) did not affect the ingestion rate of adult female A. omorii on T. nordenskioldii, and the more cells female A. omorii ingested, the higher the ingestion rate on beads (Table 2). The ratio of ingested beads to ingested cells was linearly correlated with bead concentration (Table 7). These results suggest that that the problem of the bead ingestion is related to the probability of the existence of beads in the water parcel containing a cell and the probability increases with increasing bead concentration. If so, it may be understood that the ingestion rate on beads continued to increase up to about 10000 beads ml-1, whereas the ingestion rate on cells became satured (Table 2, 3).
In the present study, beads offered singly were not ingested by adult female. This result suggests that beads are ingested by 'chance' in feeding bouts of copepods on cells. Paffenhöfer & Van Sant (1985) reached the similar conclusion that the bead ingestion is a function of the cell ingestion. |
 Issued from : T. Ayukai in Mar. Biol., 1987, 94. [p.582, Table 2A. clausi (= Acartia omorii). Issued from : T. Ayukai in Mar. Biol., 1987, 94. [p.582, Table 2A. clausi (= Acartia omorii).
Ingestion rates of adult females feeding on Thalassiosira nordenskioldii singly or in mixtures with polystyrene beads.
T. nordenskioldii (ESD = 17.7 µm diameter; volume = 2880 ± 390 µm3; beads (ESD = 15.7 µm diameter). |
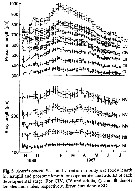
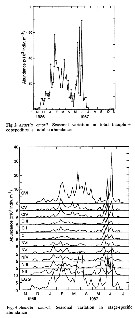 Issued from : D. Liang & S. Uye in Mar. Biol., 1996, 125. [p.111, Figs. 2, 3]. Issued from : D. Liang & S. Uye in Mar. Biol., 1996, 125. [p.111, Figs. 2, 3].
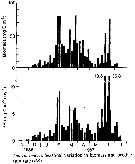
Fig. 2: Seasonal variation of Acartia omorii from Fukuyama Harbor (Inland Sea of Japan) in total (nauplii + copepodites + adults) abundance.
Fig. 3: Seasonal variation in stage-specific abundance. |
 Issued from : D. Liang & S. Uye in Mar. Biol., 1996, 125. [p.110, Fig.1]. Issued from : D. Liang & S. Uye in Mar. Biol., 1996, 125. [p.110, Fig.1].
Seasonal variations in temperature, salinity and chlorophyll a concentration in Fukuyama Harbor (Inland Sea of Japan) from November 1986 to November 1987. |
 Issued from : D. Liang & S. Uye in Mar. Biol., 1996, 125. [p.112, Fig.5]. Issued from : D. Liang & S. Uye in Mar. Biol., 1996, 125. [p.112, Fig.5].
Seasonal variation in body size of Acartia omorii in Fukuyama Harbor (Inland Sea of Japan) in November 1986 to July 1987.
Nota: As usual, the body size fluctuated seasonally for all developmental stages, being larger in winter and early spring and smaller in summer and fall. mean body size of each developmental stage was inversely related to temperature at the time of sampling. |
 Issued from : D. Liang & S. Uye in Mar. Biol., 1996, 125. [p.112, Table 2]. Issued from : D. Liang & S. Uye in Mar. Biol., 1996, 125. [p.112, Table 2].
Acartia omorii from Fukuyama (Inland Sea of Japan). Regression equations describing the relationship between body size and water temperature (T,°C); body length (BL, µm) for nauplii and prosome length (PL, µm) for copepodites and adults.
Nota: The relationships were well expressed by Belehradek's functions. |
 Issued from : D. Liang & S. Uye in Mar. Biol., 1996, 125. [p.111, Fig.4]. Issued from : D. Liang & S. Uye in Mar. Biol., 1996, 125. [p.111, Fig.4].
Generation analysis based on numerical abundance of NII, relative abundance of CI in copepodites, relative abundance of adults (CVI) in total abundance, and prosome length of adults females.
Possible generations (G1-9) indicated by alternation of stippled/non-stippled areas. See in Figs. 2 and 3: seasonal abundances (total and stage-specific abundances) |
 Issued from : D. Liang & S. Uye in Mar. Biol., 1996, 125. [p.112, Table 1]. Issued from : D. Liang & S. Uye in Mar. Biol., 1996, 125. [p.112, Table 1].
Acartia omorii from Fukuyama Harbor (Inland Sea of Japan). Comparison between generation times observed in the field and development times from egg-laying to adult predicted from laboratory experiments (Cf. Fig.4).
Nota: Comparisons were made between generation times in the field and those predicted from temperature during development under food-satiated laboratory conditions; the latter were calculated as the times from egg-laying to adult from the equation (Uye, 1980): DCVI = 11742 (T + 5.8) - 2.05 , by interpolating the average water temperature during each generation period.
The times derived from these two different methods were roughly in agreement, suggesting that the natural population was not food-limited. |
 Issued from : D. Liang & S. Uye in Mar. Biol., 1996, 125. [p.113, Fig.6]. Issued from : D. Liang & S. Uye in Mar. Biol., 1996, 125. [p.113, Fig.6].
Acartia omorii from Fukuyama Harbor (Inland Sea of Japan). Seasonal variation in sex composition in CIV, CV and adults.
There were no significant differences in sex ratio among these stages; the mean percentage of males was 58 ± 12.9%, 52 ± 12.2% and 54 ± 18.7%, respectively for CIV, CV and adult stages.
In June and July, the relative abundance of males decreased significantly with stage, indicating higher mortality of males in CV and adult stages.
[CR: Generally in pelagic copepods, the males are less abundant than females in the samples, probably because the the live-time much shorter than females, owing to the energy spent by males searshing females for mate.] |
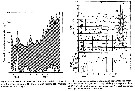 Issued from : D. Liang & S. Uye in Mar. Biol., 1996, 125. [p.113, Figs.7, 8]. Issued from : D. Liang & S. Uye in Mar. Biol., 1996, 125. [p.113, Figs.7, 8].
Acartia omorii from Fukuyama Harbor (Inland Sea of Japan).
Fig.7 : Seasonal variation in fecondities estimated from the model equation and egg-ratio method.
The incubation fecundity calculated from the model equation fluctuated between 26 and 60 eggs/female/day, while the estimated egg-ratio fecundity was much lower, ranging from 0.5 to 25 eggs/female/day. The difference between these two fecundities was regarded as a loss, ranging from 38.2 to 99.2% (mean: 89.5%) of the eggs produced, caused by sedimentation and predation.
The loss by sedimentation may not be an actual loss to the population, since sedimenting eggs may be quiescent or diapause eggs (see Uye, 1985).
Nota: << The fecundity estimation by incubation can be determined by incubating adult females in bottles with a natural assemblage of phytoplankton; the eggs producede per unit time represent the fecundity without egg loss.
The incubation fecundity (F1, eggs /female/day) of Onagawa Bay (Uye, 1981) was found to be: F1= 0.000331 (T + 12.0)3.25 SWf/(0.470 + S)
Where T: water temperature (°C) in the range of 2.5 and 22.5°C, S: chlorophyll a concentration (µg/L), and Wf is female carbon content (µg). The incubation fecundity of A. omorii in Fukuyama Harbor at temperatures > 22.5°C was assumed to be equal to the rate at 22.5°C.
Other method, the egg-ratio fecundity (F2, eggs/female/day) was determined based on eggs remaining after loss in the field (see Edmonson & al., 1962) : F2 = E/ (A x DE)
Where E and A are abundance of eggs (eggs m3 and females (ind m3, respectively, and DE is egg development time (d). DE was calculated by substituting ambient temperature into the equation:
DE = 650 (T + 5.8) -2.05.
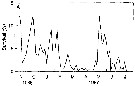
Fig. 8 : Seasonal variation in population egg production rate (PEPR: in logarithmic scale) and daily midstage abundance (DMA) of each developmental stage older than NI. Each generation (G1-9) is delimited by vertical lines.
Assuming steady state of the population near each sampling date, the number passing at the midpoint of each stage per day can be calculated by:
DMAi = Ni / Di where DMAi is the daily midstage abundance of Stage i (ind/m3) and Di id the duration of Stage i (see Fager, 1973); Results shown in figure.
The daily midstage abundance of NII, which also represents the recruitment rate to the planktonic population, was roughly parallel with the population egg production rate. However, in March and April, despite relatively high population egg production rates, the midstage abundance of Nauplius III was low. |
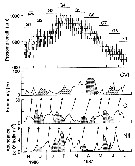
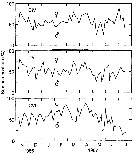
 Issued from : D. Liang & S. Uye in Mar. Biol., 1996, 125. [p.114, Fig.9]. Issued from : D. Liang & S. Uye in Mar. Biol., 1996, 125. [p.114, Fig.9].
Acartia omorii from Fukuyama Harbor (Inland Sea of Japan).
Survival curves for generations G2-G9.
The survival curve from egg to successive stages older than Nauplius II for each generation was obtained from the mean egg production rate and the daily midstage abundance of a given generation.
The survival curve of each generation, except for G1 which was derived entirely from resting eggs on the sea-bottom is shown in the figure.
Each generation showed a similar pattern, i.e the mortality was extremely high from egg to NII, ranging from 92.1% in G2 to 99.5% in G6 (mean: 97.5%) However, beyond NII the mortality became almost negligible It was noticeable that negative mortality occuirred in late copepodite stages, suggesting that the isochronal development observed by Uye (1980) for the laboratory-kept population might not be applicable for A. omorii in Fukuyama Harbor (see Landry, 1983). |
 Issued from : D. Liang & S. Uye in Mar. Biol., 1996, 125. [p.116, Fig.13 A]. Issued from : D. Liang & S. Uye in Mar. Biol., 1996, 125. [p.116, Fig.13 A].
A: Acartia omorii from Fukuyama Harbor (Inland Sea of Japan). Seasonal variation in survival from egg to Nauplius II.
Nota: << This figure shows the seasonal variations in survival from egg to nauplii II. The causes of the mortality in the life-stages could be predation. In Fukuyama Harbor, true carnivorores such as fish larvae, chaetognaths, medusae and ctenophores were absent (or extremely rare), at least during the period from January to June. It is most likely that adults and late copepodites of Acartia omorii and Centropages abdominalis were causative predators, since they are capable of ingesting their eggs and hatched nauplii, and they were actually very abundant. The clearance rate of each predator was 50 ml/day, 1 to 86% of the water comumn was estimated to be cleared byb these predators by day (Liang & al., 1994). The survival was low when these predators were abundant, suggesting that the predation within the copepod community, including cannibalism, is important in regulating the population abundance in Fukuyama Harbor.
Due to the shallow depth of the sampling site, the loss of eggs by sedimentation must be significant, although not investigated in this study.
Acartia omorii produces both subitaneous and diapause eggs; the latter were spawned mainly in June-July.
When the subitaneous eggs sediment to the bottom, they turn to quiescent eggs due to anoxia and/or darkness (Uye, 1980).
Diapause eggs accumulate on the sea-bottom and undergo aestivation. In fact, a large number of A. omorii eggs (0.5 X 10⁶ to 3.0 X 10⁶ eggs m2 were present near our sampling station (Uye & al., 1984). The first planktonic population of A. omorii was apparently derived from the benthic resting eggs.
The mortality beyond Nauplius II was negligible, and adults accounted for the largest numerical proportion in the population, which is attributed to rarity of large carnivores in our study period. >> |
 Issued from : D. Liang & S. Uye in Mar. Biol., 1996, 125. [p.114, Fig.10]. Issued from : D. Liang & S. Uye in Mar. Biol., 1996, 125. [p.114, Fig.10].
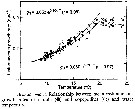
Acartia omorii from Fukuyama Harbor (Inland Sea of Japan). Relationship between mean instantaneous growth rates of nauplii (black circle) and copepodites (white circle) and water temperature.
Nota: << The instantaneous growth rate of each stage was calculated on each sampling date, and the mean growth rates for nauplii and copepodites are plotted against temperature.
As an assumption that instar duration was not shortened at temperaztures above 20°C, growth rate results were constant (0.38/ day for nauplii and 0.35/day for copepodites above 20°C and exponential below 20°C :
gN = 0.053 e 0.104T for nauplii and gC = 0.060 e 0.091T for copepodites >>. |
 Issued from : D. Liang & S. Uye in Mar. Biol., 1996, 125. [p.114, Fig.11]. Issued from : D. Liang & S. Uye in Mar. Biol., 1996, 125. [p.114, Fig.11].
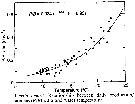
Acartia omorii from Fukuyama Harbor (Inland Sea of Japan). Seasonal variation in biomass and production rate (PR).
Nota: << Seasonal variation in biomass and production rate showed three biomass peaks in February, March and June.The maximum biomass of 80.5 mg C m3 was recorded on 25 March 1987, owing to the combination of high numerical density and large body size of the individuals.
The pattern of seasonal variation in production rate was similar to that of the biomass, but the peak in June (36.8 mg Cm3 per day) was much greater than the other peaks because of elevated growth rate in this period.Cumulative production between 7 November 1986 and 21 July 1987 was 749 mg C m3 or 5.62 g C m2.
The contribution of nauplii to the population production rate was minor (mean: 5.7%). The production came primarily from copepodites (38.5%) and adult females (55.8%).
In Fukuyama Harbor, Centropages abdominalis and Acartia omorii were the most dominant copepod species betweenj January and June. The former was more important until late March (Liang & al., 1996), then the latter become more important.
The production rate of A. omorii was much higher than that of A. omorii in Onagawa Bay (0.04 to 3.2 mg C/m3/day, Uye, 1982), because its abundance was more than an order of magnitude greater than that in Onagawa Bay. The production of A. omorii in Fukuyama Harbor is attributed primarily to the egg production by adult females (mean : 56%)). However, extremely high mortality in the egg stage indicates that a significant part of the production by adult females was in vain. >> |
 Issued from : D. Liang & S. Uye in Mar. Biol., 1996, 125. [p.115, Fig.12]. Issued from : D. Liang & S. Uye in Mar. Biol., 1996, 125. [p.115, Fig.12].
Acartia omorii from Fukuyama Harbor (Inland Sea of Japan). Relationship between daily production/biomass (P/B) ratio and water temperature.
Nota: << An empirical relationship between the ratio of daily production rate to biomass (P/B) and temperature examined: the resulting ratio was exponential , expressed by :
P/B = 0.024 e 0.133T >>. |
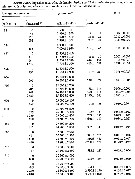
| | | | Loc: | | | China Seas (Yellow Sea, East China Sea, South China Sea, Korea (NW, S & E, Geumo Is., Gwangyang Bay), Korea Strait, Ilkwang Bay, Japan (Tokyo Bay, Izu, Ondo, Toyama Bay, off Sanriku, Fukuyama Harbor, Honshu: Maizuru Bay, Suruga Bay, Seto Inland Sea, Ariake Sea, Amakusa-Matsushima, Tanabe Bay, south estuaries, Honshu: Onagawa Bay, Gokasko Bay,, Okkirai Bay, Kyushu: Shijiki Bay, ? Omura Bay, Hokkaido), Taiwan, Kuroshio Current, California (Tomales Bay), Chile, SW North Sea (Calais Harbour) | | | | N: | 62 ? | | | | Lg.: | | | (91) F: 1,22-1,17; M: 1,07-1; (119) F: 1,22-1,06; M: 1,19-0,94; (174) F: 1,05-0,94; M: 0,9-0,81; (866) F: 0,9-1,3; M: 0,8-1,2; {F: 0,90-1,30; M: 0,80-1,20} | | | | Rem.: | epipelagic.
Transport to Chile and California (San Francisco) without doubt in ship's ballast (Hirakawa, 1988, p.357), like in the port of Dunkirk, France (Seuront, 2005). After Brylinski (2009, p.256) this species has not been seen since in the Dunkerk harbour, and it is not posible to confirm the long-term establishment.
Ohrsuka & Nishida (2017, p.578) consider this species as a cold-water species on the japanese coasts infuenced by Oyashio waters. | | | Last update : 11/01/2021 | |
|
|
 Any use of this site for a publication will be mentioned with the following reference : Any use of this site for a publication will be mentioned with the following reference :
Razouls C., Desreumaux N., Kouwenberg J. and de Bovée F., 2005-2025. - Biodiversity of Marine Planktonic Copepods (morphology, geographical distribution and biological data). Sorbonne University, CNRS. Available at http://copepodes.obs-banyuls.fr/en [Accessed December 11, 2025] © copyright 2005-2025 Sorbonne University, CNRS
|
|
|
|


 omorii - Plate 1 of morphological figures',750,500);)
 omorii - Plate 2 of morphological figures',750,500);)
 omorii - Plate 3 of morphological figures',750,500);)
 omorii - Plate 4 of morphological figures',750,500);)
 omorii - Plate 5 of morphological figures',750,500);)
 omorii - Plate 7 of morphological figures',750,500);)
 omorii - Plate 8 of morphological figures',750,500);)
 omorii - Plate 10 of morphological figures',750,500);)
 omorii - Plate 14 of morphological figures',750,500);)
 omorii - Plate 15 of morphological figures',750,500);)

 omorii - Distribution map 2',650,500);)
 omorii - Distribution map 3',750,500);)
 omorii - Distribution map 4',750,500);)
 omorii - Distribution map 5',750,500);)
 omorii - Distribution map 7',750,500);)
 omorii - Distribution map 8',750,500);)
 omorii - Distribution map 9',750,500);)
 omorii - Distribution map 11',750,500);)
 omorii - Distribution map 12',750,500);)
 omorii - Distribution map 13',750,500);)
 omorii - Distribution map 14',750,500);)
 omorii - Distribution map 15',750,500);)
 omorii - Distribution map 16',750,500);)
 omorii - Distribution map 17',750,500);)
 omorii - Distribution map 18',750,500);)
 omorii - Distribution map 20',750,500);)
 omorii - Distribution map 21',750,500);)
 omorii - Distribution map 22',750,500);)
 omorii - Distribution map 23',750,500);)
 omorii - Distribution map 24',750,500);)
 omorii - Distribution map 25',750,500);)
 omorii - Distribution map 26',750,500);)
 omorii - Distribution map 27',750,500);)
 omorii - Distribution map 28',750,500);)
 omorii - Distribution map 29',750,500);)
 omorii - Distribution map 30',750,500);)
 omorii - Distribution map 31',750,500);)
 omorii - Distribution map 32',750,500);)
 omorii - Distribution map 33',750,500);)
 omorii - Distribution map 34',750,500);)
 omorii - Plate 1 of morphological figures)
 omorii - Plate 2 of morphological figures)
 omorii - Plate 3 of morphological figures)
 omorii - Plate 4 of morphological figures)
 omorii - Plate 5 of morphological figures)
 omorii - Plate 6 of morphological figures)
 omorii - Plate 7 of morphological figures)
 omorii - Plate 8 of morphological figures)
 omorii - Plate 9 of morphological figures)
 omorii - Plate 10 of morphological figures)
 omorii - Plate 11 of morphological figures)
 omorii - Plate 12 of morphological figures)
 omorii - Plate 13 of morphological figures)
 omorii - Plate 14 of morphological figures)
 omorii - Plate 15 of morphological figures)
 omorii - Distribution map 2)
 omorii - Distribution map 3)
 omorii - Distribution map 4)
 omorii - Distribution map 5)
 omorii - Distribution map 6)
 omorii - Distribution map 7)
 omorii - Distribution map 8)
 omorii - Distribution map 9)
 omorii - Distribution map 10)
 omorii - Distribution map 11)
 omorii - Distribution map 12)
 omorii - Distribution map 13)
 omorii - Distribution map 14)
 omorii - Distribution map 15)
 omorii - Distribution map 16)
 omorii - Distribution map 17)
 omorii - Distribution map 18)
 omorii - Distribution map 19)
 omorii - Distribution map 20)
 omorii - Distribution map 21)
 omorii - Distribution map 22)
 omorii - Distribution map 23)
 omorii - Distribution map 24)
 omorii - Distribution map 25)
 omorii - Distribution map 26)
 omorii - Distribution map 27)
 omorii - Distribution map 28)
 omorii - Distribution map 29)
 omorii - Distribution map 30)
 omorii - Distribution map 31)
 omorii - Distribution map 32)
 omorii - Distribution map 33)
 omorii - Distribution map 34)
