|
|
 |
|
Calanoida ( Order ) |
|
|
|
Calanoidea ( Superfamily ) |
|
|
|
Calanidae ( Family ) |
|
|
|
Calanoides ( Genus ) |
|
|
| |
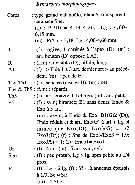
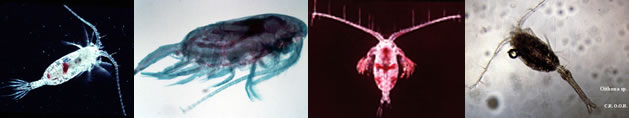
Calanoides acutus (Giesbrecht, 1902) (F,M) | |
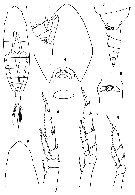
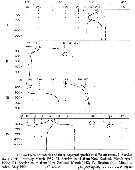
| | | | | | | Syn.: | Calanus acutus Giesbrecht, 1902 (p.17, figs.F); Wolfenden, 1908 (p.10, figs.F); 1911 (p.192, Rem.F); Farran, 1929 (p.207, 216); McKintosh, 1934 (p.74, 86, fig.F); Hardy & Gunther, 1935 (1936) (p.127, Rem., distribution charts); Ottestad, 1936 (p.11, 32, vertical and antarctic distribution); Sewell, 1948 (p.569, 572, 574); Baker, 1954 (p.203, 211, fig.5); Brodsky, 1972 (1975) (p.9, 71, 87, 120, figs.); Vyshkvartzeva, 1972 (1975) (p.188, figs.); 1976 (p.14); 1977 a (p.97, figs.); Ikeda & Hing Fay, 1981 (1982) (p.921, metabolism, ammonia excretion, O:N ratio); Fleminger, 1985 (p.275, fig.M) | | | | Ref.: | | | Vervoort, 1951 (p.41, figs.F,M, Rem.); 1957 (p.29, Rem.); Tanaka, 1960 (p.14, figs.F, Rem. Juv V); Vervoort, 1965 a (p.384, figs.F,M, Rem.); Bradford, 1971 b (p.15, fig.F, Rem.); Bradford & Jillett, 1974 (p.6, 9); Séret, 1979 (p.37, figs.F); Björnberg & al., 1981 (p.604, 618, fig.M); Fleminger, 1985 (p.275, 285, Table 1, 4, Rem.: A1); Prado Por, 1986 (p.517); Bradford, 1988 (p.77); Nishida, 1989 (p.173, table 1, 2, 3: dorsal hump); Schnack, 1989 (p.137, fig.7: Md); Razouls, 1994 (p.31, figs.F,M); Bradford-Grieve, 1994 (p.24, figs.F,M, fig.98); Bradford- Grieve & al., 1999 (p.877, 907, figs.F,M); Braga & al., 1999 (p.79, tab.1, Biomol.); Bucklin & al., 2003 (p.335, tab.2, fig. 4, Biomol.); Michels & Schnack-Schiel, 2005 (p.483, fig.1: Md); Sabatini & al., 2007 (p.359, tab.4, 5); Ferrari & Dahms, 2007 (p.62, Rem.); Park & Ferrari, 2009 (p.143, Table 2, fig.1, Appendix 1, biogeography from Southern Ocean); Cheng F. & al., 2013 (p.119, molecular biology, GenBank) | 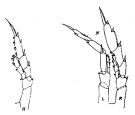 issued from : J.M. Bradford & J.B. Jillett in Crustaceana, 1974, 27 (1). [p.14, Fig.2, H,N]. Female: H, P5. Male: N, P5 (L = left, R = right).
|
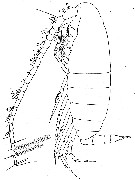
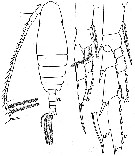
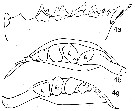
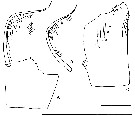
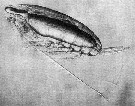
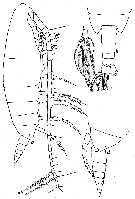 issued from : W. Vervoort in Verh. K. ned. Akad. Wet., Afd. Natuurk., 1951, (Sect. 2) 47 (2). [p.43, Fig.25]. Female (from 64°29'S, 9°39'W): a, habitus (lateral); b, d, posterior part cephalothorax and urosome (dorsal and lateral, respectively); c, left caudal ramus (dorsal). Nota : Head and 1st thoracic segment separated by a very weak line (visible only on the dorasal portion of the body), 4th and 5th well separated. Head dorsally with a distinct chitinous thickening of the carapace, forming a carina (the development of the carina varies slightly in various females, but it is always distinctly visible in dorsal view). Frontal organ with 2 minor hairs ; Rostrum with 2 long and slender filaments. Carapace of the body almost hyaline, so that the internal organs can be distinctly recognized. Proportional lengths of cephalothorax and abdomen as 91 :22. Postero-lateral margin of the last thoracic segment triangularly produced, rounded laterally and covering the beginning of the genital segment, covers about 1/3 of the genital segment. Urosome 4-segmented, with the caudal rami have the proportional lengths 35 :20 :14 :16 :15 = 100. A1 25-segmented (8th and 9th segments imperfectly separated), the terminal segment is exceptionally long.
|
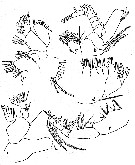
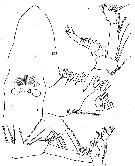 issued from : W. Vervoort in Verh. K. ned. Akad. Wet., Afd. Natuurk., 1951, (Sect. 2) 47 (2). [p.45, Fig.26]. Female: a, forehead (dorsal); b, left A2; c, genital somite (ventral); d, right Mx2; e, left Mxp. Nota: A2 and oral appendages are not essentially different from those of Calanus propinquus but, for so large a species, they are remarkably small. Endopod of A2 slightly longer than the exopod ; the 1st endopodal segment is 3.5 times as long as wide, the 2nd segment is elongate, with 6 + 8 seate ; exopodal segments separated, 1st and 2nd exopodal segments, each with 2 setae. Mx2 as Calanus propinquus. Genital segment with ventrally a distinct genital operculum, receptacles small, orifices covered by the small, semicircular flap ; the flap lies in a more or less squarish depression of the small genital tubercle.
|
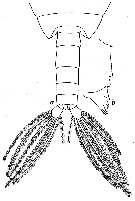
 issued from : W. Vervoort in Verh. K. ned. Akad. Wet., Afd. Natuurk., 1951, (Sect. 2) 47 (2). [p.46, Fig.27]. Female: a, left Md (cutting edge); b, left Mx1; c, left Md; d, habitus (dorsal). Nota: Endopod of Md 5-segmented. Mx1 as Calanus propinquus. Anal segment with distinct anal flap. Caudal rami symmetrical, rami about twice as long as broad, each ramus with 4 marginal setae of subequal length, the setae have a characteristic structure (at about 1/3 their length from the base they have a peridermal thickening in the shape of a ring ; all are densely haired ; the internal is small, curved and haired, the external seta is almost as long as the marginal setae and has the same structure, it is also densely haired.
|
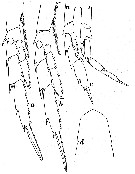
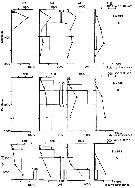
 issued from : W. Vervoort in Verh. K. ned. Akad. Wet., Afd. Natuurk., 1951, (Sect. 2) 47 (2). [p.47, Fig.28]. Female: a-e, P1 to P5 (right feet, a-e: anterior surface, d: posterior surface). Nota: The inner edge of the 1st basal segment of P5 completely smooth ; the 3rd endopodal segment has no outer edge setae, 2 apical setae and 2 inner edge setae.
|
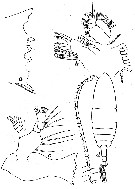
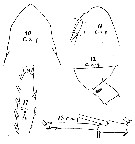
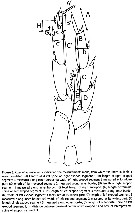
 issued from : W. Vervoort in Verh. K. ned. Akad. Wet., Afd. Natuurk., 1951, (Sect. 2) 47 (2). [p.48, Fig.29]. Male (from ± 63°.5S, 10°W): a, habitus (lateral). Nota : Head and 1st thoracic segment, 4th and 5th separate. Head laterally broadly rounded, with a knob opposite the place of attachement of the A2. Rostrum and frontal organ as in the female. Proportional lenths of cephalothorax and abdomen as 35 :11. A1 22-segmented (1st- 2nd, 3rd-5th segments fused, although weak lines of separation can be made out) much shorter than in the female, the apical segments just reach the end of the caudal rami ; on nearly all the segments a pair of club-like appendages.
|
 issued from : W. Vervoort in Verh. K. ned. Akad. Wet., Afd. Natuurk., 1951, (Sect. 2) 47 (2). [p.49, Fig.30]. Male: a, posterior part cephalothorax and urosome (dorsal); b, right Md (cutting edge). Nota: Urosome 5-segmented ; proportional lengths with the caudal rami 16 :28 :16 :12 :13 :15 = 100. Caudal rami symmetrical rami about twice as long as wide.
|
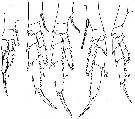
 issued from : W. Vervoort in Verh. K. ned. Akad. Wet., Afd. Natuurk., 1951, (Sect. 2) 47 (2). [p.51, Fig.31]. Male: a, left Mx1; b, right A2; c, 2nd endopodal segment of right A2; d, right Mx2; e, Md; f, right Mxp. Nota: A2 and mouth parts, compared with the females, are much reduced in size and structure. Endopod and exopod of A2 have nearly the same length. Mandibular blade much reduced in size ; the teeth along the cutting edge are weakly indicated ; the structure of the blade proves that it is unfit for feeding purposes. Mx1 is strongly reduced in size ; 1st inner lobe with 10 weak, spiniform setae, some of which are haired, others plumulose ; the 4 smaller setae observed on that lobe in the female are absent ; 2nd inner lobe with 2 strong and haired setae and 2 small, naked spines ; 3rd inner lobe with 4 haired setae ; 1st outer lobe with 9 setae, 2nd outer lobe indicated, without seta ; exopod with 11 setae, the distal seta is short and thin ; setae on 2nd basal segments and endopod as in female. Mx2 small and exceedingly delicate ; all setae are nude, with the exception of the plumose seta at the outer edge ; there is, however, no reduction in the number of setae compared with the female.
|
 issued from : W. Vervoort in Verh. K. ned. Akad. Wet., Afd. Natuurk., 1951, (Sect. 2) 47 (2). [p.52, Fig.32]. Male: a, habitus (dorsal); b, right P5 (anterior); c, right P2 (anterior); d, endspine of the 3rd endopodal segment of right P2.
|
 issued from : W. Vervoort in Verh. K. ned. Akad. Wet., Afd. Natuurk., 1951, (Sect. 2) 47 (2). [p.54, Fig.33]. Male: a, right P3; b, right P4; c, P5 (lt = left foot, rt= right foot); d, forehead (dorsal). a-c: anterior surface of feet.
|
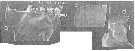 issued from : J. Michels & S.B. Schnack-Schiel in Mar. Biol., 2005, 146. [p.485, Fig.1]. Mandibular gnathobase. a: Female (from Weddell and Bellingshausen Seas); Male: c-d. a, c, d: left gnathobase from cranial; V: ventral tooth, C1-C4: central teeth, D1-D3: dorsal teeth, B: dorsal bristle. Scale bars 0.020 mm. Nota: The gnathobase males are strongly reduced, particularly in the ventral and central areas of the alignment. The ventral tooth does not exist, and the central teeth are either missing or only exist a small cone-shaped structures. Instead of the dorsal teeth, a lobe-like structure with five lappet-like appendages is located in the dorsal area. The dorsal bristle is missing. Altogether the gnathobases are very similar to the gnathobases of nauplius stage 6.
|
 issued from : W. Giesbrecht in Copepoden. Res. voyage du S. Y. Belgica. Rapports scientifiques, Zoologie, 1902. [Taf. I, Figs.10-14]. As Calanus acutus. Female (from S, SE Peter Ist Island): 10-11, forehead (dorsal and lateral, respectively); 12, last thoracic segment and genital segment (lateral); 13, A1 distal segments; anterior); 14, exopodite 3 of P2.
|
 issued from : N.V. Vyshkvartzeva in Issled. Fauny Moreï, 1972, 12 (20). [p.166, Fig.5, 4a, 4b,4g). As Calanus acutus. Female Md (masticatory edge): 4a, lateral view; 4b, left Md (above view); 4g, right Md (above view).
|
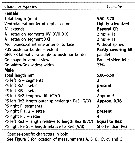
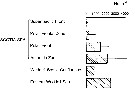
 issued from : M. E. Sabatini, F. C. Ramirez & J. Bradford-Grieve in Invert. Syst., 2007, 21. [p.361, Table 4]. Comparison characters to distinguish Females C. acutus.
|
 issued from : M. E. Sabatini, F. C. Ramirez & J. Bradford-Grieve in Invert. Syst., 2007, 21. [p.361, Table 5]. Comparison characters to distinguish Males C. acutus.
|
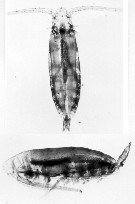 issued from C. Razouls (pers. coll.) Female (dorsal and lateral), from Kerguelen Islands, 18 October 1995. Nota: Note the ovocytes include in the gonad.
|
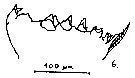 issued from : S.B. Schnack in Crustacean Issue, 1989, 6. [p.144, Fig.7: 6]. 6, Calanoides acutus (from Antarctic): Cutting edge of Md.
|
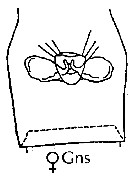 issued from : J.M. Bradford-Grieve, E.L. Markhaseva & C.E.F. Rocha & B. Abiahy in South Atlantic Zooplankton, Edit. D. Boltovskoy. 1999. Vol.2. Copepoda. [p.978, Fig. 7.9]. Female: genital segment (ventral).
|
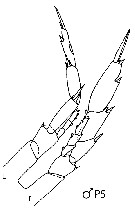 issued from : J.M. Bradford-Grieve, E.L. Markhaseva & C.E.F. Rocha & B. Abiahy in South Atlantic Zooplankton, Edit. D. Boltovskoy. 1999. Vol.2. Copepoda. [p.978, Fig. 7.9]. Male: P5.
|
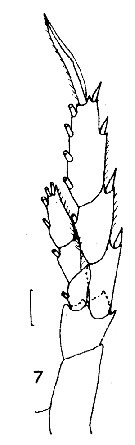 Issued from : J.M. Bradford in N.Z. Oceanogr. Inst., 1971, 206, Part 8, No 59. [p.15, Fig.7]. Female (from 71°S-McMurdo Sound, 165°E-178°E): 7, P5 Scale bar: 100 µm.
|
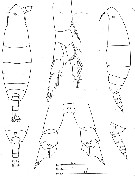
 Issued from : O. Tanaka in Spec. Publs. Seto mar. biol. Lab., 10, 1960 [Pl. III]. Female (from Antarctic, Indian sector): 1, habitus (dorsal); 2, head (lateral); 3, last thoracic segment and urosome (lateral); 4, genital segment (ventral); 5, area field of genital segment (ventral); 6, P2; 7, P4; 8, P5; 9, head (dorsal view other specimen). Nota: Proportional lengths cephalothorax and abdomen 81 to 19. In some specimen the head slightly carinated at the apex in dorsal view. The Body slender, soft-skined and transparent. Rostral filaments long. Lateral margin of the last thoracic segment, when viewed from the side, triangularly produced but narrowly rounded at the distal end which extends about to the middle of the genital segment. Abdomen 4-segmented. Segments and caudal rami in proportional length 38 : 17 : 12 : 14 : 19 = 100. Genital segment with a lateral swelling on the proximal 1/4 of the segment. Receptacles small; genital flap semi-circular in ventral aspect. Caudal rami about 2 times as long as wide. 1st segment of the exopod has no inner distal seta. The outer marginal spine of the 3rd segment of the exopod divides the outer margin in the proportions 17 : 9. The 3rd segment of the endopod has no outer marginal seta.
|
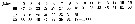 Issued from : O. Tanaka in Spec. Publs. Seto mar. biol. Lab., 10, 1960 [p.15]. Female: Proportional length of segments of A1. Nota: A1 25-segmented, exceeds the end of the caudal rami by distal 1 or 2 segments; segments 8 and 9 separate.
|
 Issued from : O. Tanaka in Spec. Publs. Seto mar. biol. Lab., 10, 1960 [p.15]. Female: Proportional lengths of the 3rd segment and the terminal spine of the 3rd exopodal segment of the P2 to P4, in the table herewith.
|
 Issued from : C. Séret in Thesis UPMC, Paris 6. 1979 [Pl. V]. Female (from off N Kerguelen Is.): 17, last §horacic segment and urosome (dorsal); 18, same (lateral); 19, P1; 20, P5. Female stage V: 15, habitus (dorsal); 16,same (lateral).
|
 Issued from : C. Razouls in Ann. Inst. océanogr., Paris, 1994, 70 (1). [p.31]. Caractéristiques morphologiques de Calanoides acutus femelle et mâle adultes. Terminologie et abbréviations: voir à Calanus propinquus.
|
 Issued from : J.A. Fornshell & F.D. Ferrari in Crustaceana, 2014, 87 (1). [p.108, Fig.4, A-C]. Von Vaupel Klein's organ on right endopodal segment 1 and right basal seta of P1. A, anterior, distal up (ventral endopodal seta not drawn; B, right basal seta; C, proximal endopodal segment Scale line; short = 60 µm; long = 210 µm. The Von Vaupel Klein organ is an association (srtucture) of the distal seta from basis and the proximal endopodal segment of P1. This structure shows significant variability among many gymnoplean copepods, in the shape of the distodorsal corner of the proximal endopodal segment, presence and location of denticles on the anterior face of the segment, presence and size of denticles along the distal margin of the segment , number of pores on the segment, shape of the seta that originates on the basis, and the morphology of the basis at the origin of the seta. The function of this complex structure is not known.
|
 Issued from : J.M. Bradford-Grieve, L. Blanco-Bercial & I. Prusova in J. Nat. Hist., 2017, 51 (13-14) [p.828, Table 5]. Character states distinguished known of Calanoides. A1 = antennule, a = aesthetasc; approx. = approximately; CR = caudal rami; Gns = genital double-somite; Go = genital operculum; ms = modified seta; Pd5 = pedigerous somite 5; P5 = fifth leg; Re = exopod; Ri = endopod; SR = seminal receptacle; St = terminal spine.
|
 Issued from : J.M. Bradford-Grieve, L. Blanco-Bercial & I. Prusova in J. Nat. Hist., 2017, 51 (13-14) [p.812, Fig. 3]. Calanoides male P5 indicating the measurements made, from which the ratios in Table 4 and 5 were calculated.
| | | | | Compl. Ref.: | | | Sewell, 1948 (p.569, 572, 574); Brodsky, 1964 (p.105, spatial distribution); Murano, 1965 (p.91, fig.3, abundance, geographic distribution); Andrews, 1966 (p.117, life history); Vinogradov, 1968 (1970) (p.66, 67, 68, 69, 94, 234); Voronina, 1968 (p.277, Rem.: p.278); 1970 (p.162, spatial distribution); 1972 (p.336, vertical distribution); 1972 a (p.415, vertical distribution); Björnberg, 1973 (p.384); Voronina & Sukhanova, 1976 (1977) (p.614, food composition); Arashkevich, 1978 (p.118, Table: diets); Vladimirskaya, 1978 (p.202, vertical distribution, age composition); Voronina & al., 1978 (p.512, distribution); 1979 (p.76, geographic distribution, life history); Voronina & al., 1980 (p.90, production); Hirche, 1984 a (p.361, respiration); Schnack & al., 1985 (p.256, fig.4); Hubold, 1985 (p.43, Table 1, predation by fish); Hopkins, 1985 (p.197, Table 1, gut contents); Dearborn & al., 1986 (p.1, predation by benthic star); Reinhardt & Van Vleet, 1986 (p.149, lipid composition); Zmijewska, 1987 (tab.2a); Huntley & al., 1987 (p.158, egg production); Hopkins & Torres, 1988 (tab.1); Ferrari & Dearborn, 1989 (p.1315, predator); Ward, 1989 (tab.2); Trofimov & al., 1989 (p.426); Tucker & Burton, 1990 (p.591, tab.1, fig.4, seasonal, spatial variations); Atkinson & al., 1990 (p.1213, tab.1); Atkinson, 1991 (p.79, antarctic zonation, seasonal change, vertical distribution, life history); Schnack-Schiel & al., 1991 (p.17, life cycle); Rau & al., 1991 (p.1, isotopic forms vs feeding); Conover & Huntley, 1991 (p.1, Table 2, 3, 5, 7, 9, 10, 13, polar seas comparison); Huntley & Escritor, 1991 (p.1145, spatial distribution, nutrition, egg production); Huntley & Lopez, 1992 (p.201, Table A1, B1, egg-adult weight, temperature-dependent production, growth rare); Siegel & al., 1992 (p.18, tab.3,4); Atkinson & al., 1992 (p.583, diel vertical migration, feeding); 1992 a (p.49, feeding rates, vertical migration); Vuorinen & Bonsdorff, 1992 (p.679, dispersion index); Freire & al., 1993 (tab.3); Hagen & al., 1993 (p.135, lipid storage); Zmijewska, 1993 (p.73, seasonal and spatial variations); Bathmann & al., 1993 (p.333, chart distribution, sex ratio, grazing); Marin & Schnack-Schiel, 1993 (p.35, vertical distribution); Lopez & al., 1993 (p.153, vertical distribution, egg production); Drits & al., 1994 (p.201); Atkinson, 1994 (p.551, feeding selectivity); 1994 a (p.1, feeding); Huntley & al., 1994 (p.209, modelling of population dynamics); Donnelly & al., 1994 (p.171, chemical composition); Graeve & al., 1994 (p.915, lipid composition vs. diet); Kattner & al., 1994 (p.637, lipid seasonal changes); Schnack-Schiel & Hagen, 1994 (p.1543, life cycle); Hosie & Cochran, 1994 (p.21); Atkinson & Shreeve, 1995 (p.1291, vertical distribution, grazing); Ward & al., 1995 (p.195, abundance, biomass, vertical distribution); Ward & Shreeve, 1995 (p.721, egg production); Metz & Schnack-Schiel, 1995 (p.71, feeding); Huntley & Nordhausen, 1995 (p.457, elemental composition, ammonium excretion rates, Rem.: p.463); Atkinson, 1996 (p.85, feeding); Atkinson & al., 1996 (p.195, feeding v.s. phytoplankton bloom); Knox & al., 1996 (tab.1); Froneman & al., 1996 (p.15, nutrition, grazing); Hagen & Schnack-Schiel, 1996 (p.139, seasonal lipid, gonad maturation); Albers & al., 1996 (p.347, lipids vs. diet); Pakhomov & McQuaid, 1996 (p.271, abundance, distribution, seabirds); Froneman & al., 1997 (p.201, abundance, grazing); Zmijewska & al., 1997 (p.127); Errhif & al., 1997 (p.422); Beaumont & Hosie, 1997 (p.121, spatial distribution); Vuorinen & al., 1997 (p.280); Swadling & al., 1997 (p.39, Table 1, figs. 6, 7, 8, grazing); Atkinson & al., 1997 (p.99, life cycles vs zones); Atkinson, 1998 (p.289, Table 1: biological data, life history); Spiridonov & Kosobokova, 1997 (p.233, spatial distribution, vertical migration, gonad maturation, sex ratio); Voronina, 1998 (p.375, biomass); Elwers & Dahms, 1998 (p.150, 151); Ward & Shreeve, 1998 (p.142, fig.1, egg hatching vs temperature); Atkinson & al., 1999 (p.63, Krill-copepod interactions, fig.7: diel migration); Tirelli & Mayzaud, 1999 (p.197, gut evacuation); Atkinson & Sinclair, 2000 (p.46, 50, 51, 53, 55, zonal distribution); Razouls & al., 2000 (p.343, tab. 2, 5, Appendix); Pakhomov & al., 2000 (p.1663, Table 1, 2, transect Cape Town-SANAE antarctic base); Chiba & al., 2001 (p.95, tab.4, 7); Voronina & al., 2001 (p.401); Pasternak & Schnack-Schiel, 2001 (p.25); Li & al., 2001 (p.894, tab.1); Voronina, 2002 (p.68, abundance vs stations); Ward & al., 2002 (p.2183, tab.2, 3, fig.7); Cabal & al., 2002 (p.869, Table 1, abundance); Ward & al., 2003 (p.121, tab.4); Hunt, 2004 (p.1, 47, 74, Table 3.2, 4.4, fig.4.7, 4.11, fig.5.10: seasonal abundance); Tarling & al., 2004 (p.165, life-cycle, modelling approach); Miller C.B., 2005 (p.219, Rem.); Calbet & al., 2005 (p.1195, tab.3); Ward & al., 2005 (p.421, Table 6, 8, 9, abundance, biomass); Ward & al., 2006 (p.83: tab.4); Schultes & al., 2006 (p.21, fig.1); Hunt & Hosie, 2006 (p.1182, seasonal succession, indicator); Dias & Araujo, 2006 (p.31); Tsujimoto & al., 2006 (p.140, Table1); Deibel & Daly, 2007 (p.271, Table 6a, 6b, 7a, 7b, Fig.5, Rem.: Antarctic polynyas); Guglielmo & al., 2007 (p.747, Table 5); Ward & al., 2007 (p.1871, Table 2, fig.6, 7, abundance, egg production); Kattner & al., 2007 (p.1628, Table 1); Varpe & al., 2007 (p.1331, life history model); Schnack-Schiel & al., 2008 (p.1045: Tab.2, p.1049: fig.6); Ward & al., 2008 (p.241, Tabls, Appendix II ); Kiko & al., 2008 (p.1000, Table 3); Galbraith, 2009 (pers. comm.); Sartoris & al., 2010 (p.1860, buoyancy, diapause, hemolymph cation concentration); Takahashi & al., 2010 (p.317, Table 3, 4, fig. 5); Swadling & al., 2010 (p.887, Table 2, 3, A1, fig.6, abundance, indicator species); Hsiao & al., 2010 (p.179, Table III, trace metal concentration); Yang & al., 2011 (p.1065, fig.2a); Yang & al., 2011 a (p.921, Table 2, inter-annual variation 1999-2006); Takahashi & al., 2011 (p.134, distribution); Marrari & al., 2011 (p.1599, table 2, abundance, composition, interannual variation); 2011 a (p.1614, Table 2, Figs. 2A, 5, 6); Swadling & al., 2011 (p.118, Table 2, figs.5, 7, interannual abundance); Pond & Tarling, 2011 (p.1310, wax esters composition vs buoyancy in diapause); Ward & al., 2012 (p.78, Table 1, fig.5, 6, Table A1, B1, C1, abundance, weight, depth); Thompson G.A. & al., 2012 (p.127, Table 2, 3, fig.5); Pond, 2012 (p.443, Rem.: p.444, wax esters); Tarling & al., 2012 (p.222, Table 1, 3, seasonal biomass); Pond & al., 2012 (p.93, wax ester vs diapause); Makabe & al., 2012 (p.432, Table II, abundance vs mesh-size used); Michels & al., 2012 (p.369, Table 1, fig.11, occurrence frequency, vertical distribution); Yang G. & al., 2013 (p.1701, fig.4, Table 2, feeding); Schründer & al., 2013 (p.1, sodium/ammonium and ph effects in the hemolymph); Ojima & al., 2013 (p.1293, Table 2, 3, 4, fig.3, abundance); Lee D.B. & al., 2013 (p.1215, Table 1, 2, 3, 4, abundance, composition, fig.9: grazing); Wilson R.J. & al., 2013 (p.438, lipid vs diapause, buoyancy); Pond & Tarling, 2013 (p.441, lipid vs temperature, transition phase); Hernandez-Leon & al., 2013 (p.196, fig.8, vertical distribution, , grazing, ETS activity); Ward & al., 2014 (p.305, Table 4, abundance in the ''Discovery'' Investigations in the 1930s); Kouwenberg & al., 2014 (p.290, biogeography, Map 2); Baumgartner & Tarrant, 2017 (p.387, Table 1, diapause); Record & al., 2018 (p.2238, Table 1: diapause); Varpe & Ejsmond, 2018 (p.623, diapause model); Xavier & al., 2020 (p.15, Rem.). | | | | NZ: | 2 | | |
|
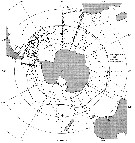
Distribution map of Calanoides acutus by geographical zones
|
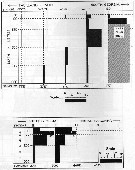
| | | | | |  issued from : F.J. Sartoris, D.N. Thomas, A. Cornils & S.B. Schnack-Schiel in Limnol. Oceanogr., 2010, 55 (5). [p.1863, Fig.3]. issued from : F.J. Sartoris, D.N. Thomas, A. Cornils & S.B. Schnack-Schiel in Limnol. Oceanogr., 2010, 55 (5). [p.1863, Fig.3].
Vertical distribution of the total numbers and hemolymph ammonium levels (mean and standard deviation) of Clalanoides acutus female and CV ar different sampling dates.
Numbers in parentheses: abundance (ind. per m3) within the studied water comumn.
Nota: Sampling from southern Scotia Sea and northwestern Weddell Sea |
 Issued from : M.I. Zmijewska in Oceanologia, 1993, 35. [Fig. 3.1]. Issued from : M.I. Zmijewska in Oceanologia, 1993, 35. [Fig. 3.1].
Diel changes in abundance distribution (ind. m2) of Calanoides acutus (from 64°50'S, 61°50'W, Croker Passage, Antarctic Peninsula) adult female and male during 3 austral seasons.
N = night; D = day. |
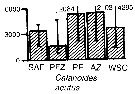
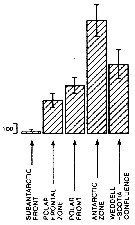 Issued from : A. Atkinson in Mar. Biol., 1991, 109. [p.82, Fig.2]. Issued from : A. Atkinson in Mar. Biol., 1991, 109. [p.82, Fig.2].
Calanoides acutus. Mean abundance (nos./1000 m) of vertical haul) in top 1 000 m within five water types. bars represent standard errors of means, calculated from assumed Poisson distribution.
Estimated contributions to total copepod biomass in study area: 17 %.
Nota: Water types:
1- Either in sub-Antarctic zone or in vicinity of subantarctic front.
2- Within polar frontal zone.
3- In vicinity of polar front.
4- Within Antarctic zone.
5- Within Weddell Sea or in Weddell-Scotia confluence. |
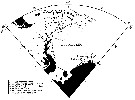
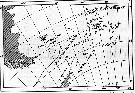
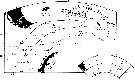 Issued from : A. Atkinson in Mar. Biol., 1991, 109. [p.80, Fig.1]. Issued from : A. Atkinson in Mar. Biol., 1991, 109. [p.80, Fig.1].
Positions of 72 stations sampled in Scotia Sea. The Scotia Sea, containing majority of stations, is bordered on east by a chain of oceanic islands and on west by Drake Passage (between South America and the Antarctic Peninsula.
Mean positions of oceanic fronts, and zones which they separate are drawn from Gordon (1967).
SAF: subantarctic front.
PFZ: polar frontal zone.
PF: polar front.
AZ: Antarctic zone.
WSC: Weddell-Scotia confluence. |
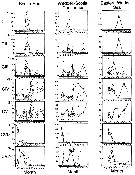
 Issued from : A. Atkinson in Mar. Biol., 1991, 109. [p.82, Fig.3]. Issued from : A. Atkinson in Mar. Biol., 1991, 109. [p.82, Fig.3].
Calanoides acutus. Mean vertical distribution during four seasons. Values are numbers/250 m of vertical haul. |
 Issued from : A. Atkinson, S.B. Schnack-Schiel, P. Ward & V. Marin in Mar. Ecol. Progr. Ser., 1997, 150. [p.102, Fig.1]. Issued from : A. Atkinson, S.B. Schnack-Schiel, P. Ward & V. Marin in Mar. Ecol. Progr. Ser., 1997, 150. [p.102, Fig.1].
Calanoides acutus. Position sampling stations, classified by water temperature.
Symbols separate sub-regions according to temperature criteria:
1- Scotia Sea: Subantarctic Front vicinity temperatre range > 2.68 °C; Polar Frontal zone 2.26-2.2,68 °C; Polar Front vicinity 1.98-2.26 °C; Antarctic Zone 1.60-1.98 °C.
2- Weddell-Scotia Confluence: < 1.6 °C.
3- Eastern Weddel Sea: < 0.8 °C.
Nota: Classification of stations according to their mean temperature at 400, 600, 800 and 1000 m depth. |
 Issued from : A. Atkinson, S.B. Schnack-Schiel, P. Ward & V. Marin in Mar. Ecol. Progr. Ser., 1997, 150. [p.104, Fig.2]. Issued from : A. Atkinson, S.B. Schnack-Schiel, P. Ward & V. Marin in Mar. Ecol. Progr. Ser., 1997, 150. [p.104, Fig.2].
Calanoides acutus. Median abundance in sub-regions of study area.
Values are total copepodids undzer 1 m2 in the sampled water column. Bars represent interquartile ranges. |
 ssued from : A. Atkinson, S.B. Schnack-Schiel, P. Ward & V. Marin in Mar. Ecol. Progr. Ser., 1997, 150. [p.104, Fig.3]. ssued from : A. Atkinson, S.B. Schnack-Schiel, P. Ward & V. Marin in Mar. Ecol. Progr. Ser., 1997, 150. [p.104, Fig.3].
Calanoides acutus. Median depth of the population.
Each point represents a group of stations in the Scotia Sea and Eastern Weddell Sea. |
 Issued from : A. Atkinson & J.D. Sinclair in Polar Biol., 2000, 23. [p.50, Fig.3] Issued from : A. Atkinson & J.D. Sinclair in Polar Biol., 2000, 23. [p.50, Fig.3]
Calanoides acutus from Scotia Sea.
Median and interquartile ranges of copepods (nos /m2) in the five water zones; from north to south these are SAF Subantractic Front area, PFZ Polar frontal Zone, PF Polar Front area, AZ Antarctic Zone, WSC Weddell-Scotia Confluence area/ East Wind Drift.
Numbers on the plots are upper interquartiles where these could not be scaled. |
 issued from : A. Atkinson in J. Mar. Syst., 1998, 15. [p.299, Fig.1]. issued from : A. Atkinson in J. Mar. Syst., 1998, 15. [p.299, Fig.1].
Calanoides acutus. Percentage composition of developmental stages within three regions of the Atlantic sector.
Each point represents a sampling station and the trend lines link mean values of age structure from transects or groups of stations (as described in Atkinson & al., 1997).
Nota: Because of the intense seasonality of the Southern Ocean, the length of growing season, as well as growth rates during summer, presumably dictate the duration of the life cycle. Because Calanoides acutus is herbivorous, has a seasonal migration cycle and does not feed at depth, the period when the population is in the surface layer dictates the potential period for growth and production.
The durations in the Scotia Sea and eastern Weddell Sea corresopnd to the reported timing of elevated Chl a concentrations in these regions (see in Hart, 1942 and Savidge & al., 1996). |
 Issued from : V.A. Spiridonov & K.N. Kosobokova in Mar. Ecol. Prog. Ser., 1997, 157. [p.236, Fig.2 (modified)]. Issued from : V.A. Spiridonov & K.N. Kosobokova in Mar. Ecol. Prog. Ser., 1997, 157. [p.236, Fig.2 (modified)].
Abundance of Calanoides acutus, Calanus propinquus and Rhincalanus giga (A) along the Greenwich transect in the upper 0 to 500 m water layer from subantarctic to Antarctic continent (stations 571 to 606), and stage composition C2 to C5 (B), in early to mid-winter.
PF: Polar front; ACC: Antarctic Circumpolar Current; WF: Weddell Front; MR: Maud Rise; CWB: Continental Water Boundary. |
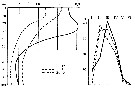
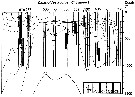 Issued from : V.A. Spiridonov & K.N. Kosobokova in Mar. Ecol. Prog. Ser., 1997, 157. [p.239, Fig.4]. Issued from : V.A. Spiridonov & K.N. Kosobokova in Mar. Ecol. Prog. Ser., 1997, 157. [p.239, Fig.4].
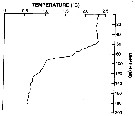
Vertical distribution of temperature (°C) and characteristics of the vertical distribution of particular copepodite stages of Calanoides acutus sampled from surface to 1000 m depth along the Greenwich transect from 55°S (station 576) to 69°S (station 603).
Vertical lines (1) show the range of occurrence, horizontal bars (2) mark the median depth of occurrence, and rectangles (3) cover the range centered around the median depth where a core (50% of a hemipopulation) is concentrated.
C3 to C6: copepodite stages. |
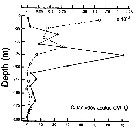
 Issued from : S.B. Schnack-Schiel & W. Hagen in J. Plankton Res., 1994, 16 (11). [p.1548, Fig.3]. Issued from : S.B. Schnack-Schiel & W. Hagen in J. Plankton Res., 1994, 16 (11). [p.1548, Fig.3].
Vertical distribution of C. acutus from eastern Weddell Sea, as a percent of total numbers and temperature profile within the upper 1000 m. |
 Issued from : M. Murano inThe Ocean Res. Inst., Univ. Tokyo, 1965. Coll. Rep., 1964, Vol.3. [p.102, Fig.3]. Issued from : M. Murano inThe Ocean Res. Inst., Univ. Tokyo, 1965. Coll. Rep., 1964, Vol.3. [p.102, Fig.3].
The quantitative distribution of Calanoides acutus (Giesbrecht), gathered by NORPAC net, hauls vertically up to the water surface from a depth of 200 m between December, 1961 and February, 1962. |
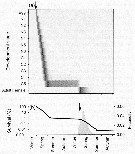
 issued from A. de C. Baker in 'Discovery' Rep., 1954, 27. [p.215, Fig.5]. issued from A. de C. Baker in 'Discovery' Rep., 1954, 27. [p.215, Fig.5].
Occurrence of Calanus acutus (= Calanoides acutus) in all longitudes around Antarctic zone of the Southern Ocean.
The percentage frequency of occurrence in samples taken within every 20° of longitude.
Nota: During the 'Discovery' investigations some thousands of plankton samples have been taken from stations spread over the whole of the Southern Ocean at all seasons of the year, the majority south of the Antarctic Convergence. An arbitrary selection of samples has been made from hauls between the surface and a depth of 250 m, which means that they have been taken from within the limits of the Antarctic surface water.
The data suggest that the Southern Ocean is an uninterrupted circumpolar belt with more or less uniform conditions prevailing in east and west directions, the range of planktonic species of the Antarctic surface water may be expected to extend as far as these uniform conditions persist, i.e to be circumpolar. |
 Issued from : P. Ward, A. Atkinson, A.W.A. Murray, A.G. Wood, R. Williams & S. Poulet in Polar Biol., 1995, 15. [p.200, Fig.3]. Issued from : P. Ward, A. Atkinson, A.W.A. Murray, A.G. Wood, R. Williams & S. Poulet in Polar Biol., 1995, 15. [p.200, Fig.3].
Abundance and biomass (g dry mass/m3) profiles for the shelf station (54°48'S, 38°15'W) in January 1990.
Values on the horizontal axes at the base represent abundance and the one above biomass. Solid line = midday haul; hatched line = midnight haul. |
 Issued from : P. Ward, A. Atkinson, A.W.A. Murray, A.G. Wood, R. Williams & S. Poulet in Polar Biol., 1995, 15. [p.198, Fig.1, A (modified C.R.)]. Issued from : P. Ward, A. Atkinson, A.W.A. Murray, A.G. Wood, R. Williams & S. Poulet in Polar Biol., 1995, 15. [p.198, Fig.1, A (modified C.R.)].
Temperature profile for the shelf station at Bird Island, South Georgia (54°48'S, 38°15'W) in January 1990. |
 Issued from : P. Ward, A. Atkinson, A.W.A. Murray, A.G. Wood, R. Williams & S. Poulet in Polar Biol., 1995, 15. [p.202, Fig.4, A]. Issued from : P. Ward, A. Atkinson, A.W.A. Murray, A.G. Wood, R. Williams & S. Poulet in Polar Biol., 1995, 15. [p.202, Fig.4, A].
Abundance (10/m3) and biomass (g dry mass/m3) profiles at the oceanic station from the shelf break in water 4000 m deep off Bird Island, South Georgia (53°04'S, 39°51'W) in January 1990.
Values on the horizontal axes at the base of each profile represent abundance and the one above biomass. Solid line = midday haul; hatched line = midnight haul. |
 Issued from : P. Ward, A. Atkinson, A.W.A. Murray, A.G. Wood, R. Williams & S. Poulet in Polar Biol., 1995, 15. [p.198, Fig.1, B (modified C.R.)]. Issued from : P. Ward, A. Atkinson, A.W.A. Murray, A.G. Wood, R. Williams & S. Poulet in Polar Biol., 1995, 15. [p.198, Fig.1, B (modified C.R.)].
Profile temperature-depth at the oceanic stations from the shelf break in water 4000 m deep off Bird Island, South Georgia, in January 1990. |
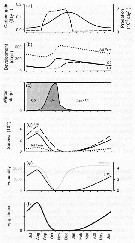
 Issued from : N.M. Voronina, V.V. Menshutkin & V.B. Tseytlin in Oceanology, 1980, 20 (1). [p.91, Fig.1]. Issued from : N.M. Voronina, V.V. Menshutkin & V.B. Tseytlin in Oceanology, 1980, 20 (1). [p.91, Fig.1].
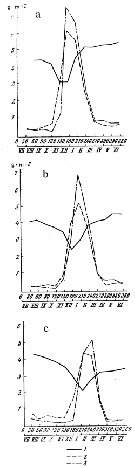
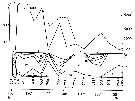
Variations in the production, elimination, and biomass of a Calanoides acutus population in the course of the year in various latitude zones. a: nothern; b: middle; c, southern.
1: biomass; 2: monthly elimination (by predation or death of females; 3: monthly production (g/m2).
Days of the model year are shown on the abscissa; Roman numerals indicate the month of the year.
Nota: Calculation of net annual production gave 22.3, 18.3 and 13.8 g /m2 in the northern, middle and southern zones, respectively.
The annual coefficient P/B (ratio of total annual production to the average annual biomass) at various latitudes in the Antarctic and in different years varies from 1.6 to 5.7 and averaged 4.3, 4.8 and 4.0 for the northern, middle and southern zones, respectively, and 4.5 for the entire area.
The variations in the elimination (predation and mortality) are generally similar to variations in production. During the winter months, when the population is scattered in the entire deep water column, the number of individuals consumed is very small and losses in biomass are close to its increment, while molting of winteing individuals is rare. Increased elimination in spring has twon reasons: first, because the crustaceans which have risen after wintering form concentrated accumulations and are therefore eaten at a higher rate, and second, because the death of females which had spawned. Intense elimination, and its causes, i.e., migration and reproduction, starts earlier in the north and is delayed with distance toward south. |
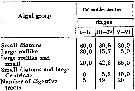 Issued from : N.M. Voronina & I.N. Sukhanova in Oceanology, 1977, 16 (6). [p.615]. Issued from : N.M. Voronina & I.N. Sukhanova in Oceanology, 1977, 16 (6). [p.615].
Frequency of encounter of various groups of diatom algae in the character of leading objects in the food pellet (% of number of digestive tracts with food).
Data from stations between 57°S-69°43'S.
The animals utilize all diatom species from 5 to 300 µm in size, the only animal food found there were tintinnids and radiolarians in negligible quantity. |
 Issued from : N.M. Voronina in Antarctic Ecology, M.W. Holdgate (edit.), 1970, I. [p.170, Fig.7]. Issued from : N.M. Voronina in Antarctic Ecology, M.W. Holdgate (edit.), 1970, I. [p.170, Fig.7].
The northern boundaries of distribution of three copepod species in the 500-0 m layer in the second part of the summer. |
 Issued from : N.M. Voronina in Antarctic Ecology, M.W. Holdgate (edit.), 1970, I. [p.169, Fig.6]. Issued from : N.M. Voronina in Antarctic Ecology, M.W. Holdgate (edit.), 1970, I. [p.169, Fig.6].
The northern boundaries of distribution of three copepod species in the 500-0 m layer at different times. |
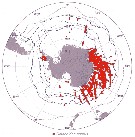
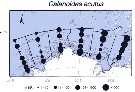 Issued from : K.M. Swadling, So. Kawaguchi & G.W. Hosie in Deep-Sea Research II, 2010, 57. [p.897, Fig.6 (continued)]. Issued from : K.M. Swadling, So. Kawaguchi & G.W. Hosie in Deep-Sea Research II, 2010, 57. [p.897, Fig.6 (continued)].
Distribution of indicator species Calanoides acutus from the BROKE-West survey (southwest Indian Ocean) during January-February 2006.
Sampling with a RMT1 net (mesh aperture: 315 µm), oblque tow from the surface to 200 m.
The survey area was located predominantly within the seasonal ice zone, and in the month prior to the survey there was considerable ice coverage over the western section but none over the east.
See map showing sampling sites in Calanus propinquus. |
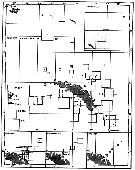 Issued from : A.C. Hardy & E.R. Gunther in Discovery Reports, 1935 (1936), 11. [p.135, Fig.63]. Issued from : A.C. Hardy & E.R. Gunther in Discovery Reports, 1935 (1936), 11. [p.135, Fig.63].
Charts showing the distribution of Calanus acutus (= Calanoides acutus) in the upper layers of waters at stations in the 1926-7 surveys around South Georgia.
The squares represent the average numbers per 50 m vertical haul from 250 m (or less at shallow-water stations) to the surface with N 70 V nets. |
 Issued from : E.T. Park & F.D. Ferrari in A selection from Smithsonian at the Poles Contributions to International Polar year. I. Krupnik, M.A. Lang and S.E. Miller, eds., Publs. by Smithsonian Institution Scholarly Press, Washington DC., 2009. [p.165, Fig.1] Issued from : E.T. Park & F.D. Ferrari in A selection from Smithsonian at the Poles Contributions to International Polar year. I. Krupnik, M.A. Lang and S.E. Miller, eds., Publs. by Smithsonian Institution Scholarly Press, Washington DC., 2009. [p.165, Fig.1]
Distribution of selected pelagic calanoids Calanoides acutus of the Southern Ocean and the closest relative. |
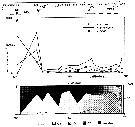
 Issued from : N.M. Voronina in Oceanology, 2002, 42 (1). [p.72, Fig.4]. Issued from : N.M. Voronina in Oceanology, 2002, 42 (1). [p.72, Fig.4].
Variation in the abundance and age structure of the Calanoides acutus population along the transect (67°S). Roman numerals : copepodite stages.
Dashed line: salp biomass per 1 m2 within the 0 to 500 m layer |
 Issued from : N.M. Voronina in Oceanology, 2002, 42 (1). [p.69, Fig.1]. Issued from : N.M. Voronina in Oceanology, 2002, 42 (1). [p.69, Fig.1].
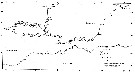
Hydrological characteristics at the transect from Adelaide Island (Antarctic Peninsula) to the Balleny Island along 67°S during the period from February 23 to March 30, 1992.
Over the greater part of the transect, the vertical temperature distribution was typical of the summer season.
The area studied was located entirely within the waters of the Antarctic vertical structure and covered four segments: The low-latitude ACPC waters (stations 694-733), the high-latitude ACC waters (stations 775, 791 and 793), the mixed waters of both types within the Ross Sea (stations 746-771 and 788), and the shelf waters represented by only a single station on its slope (station 779).
The boundary between the low-latitude and mixed waters of the high latitude modification runs along the pronounced secondary frontal zone in the area of station 739, whereas that between the mixed and properly high-latitude water modifications runs near station 778 (see in Maslennikov, 1992). |
 Issued from : N.M. Voronina in Oceanology, 2002, 42 (1). [p.71]. Issued from : N.M. Voronina in Oceanology, 2002, 42 (1). [p.71].
Average abundance (and its error) of the mass population within different waters (ind./m2 within the 0 to 1500 m layer). n: number of stations |
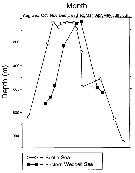
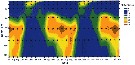 Issued from : D.W. Pond & G.A. Tarling in J. Plankton Res., 2013, 35 (2). [p.442, Fig.2]. Issued from : D.W. Pond & G.A. Tarling in J. Plankton Res., 2013, 35 (2). [p.442, Fig.2].
Summary of data of depth distributions of Calanoides acutus from Andrews (1966, Discovery Report, 34: 1-116).
The plot is a synthesis of Southern Ocean data collected monthly over an annual cycle. The data set was repeated over 2 years before interpolation to reduce distortion at the temporal limits. |
 Issued from : D.W. Pond in J. Plankton Res., 2012, 34 (6). [p.447, Fig.3 a] Issued from : D.W. Pond in J. Plankton Res., 2012, 34 (6). [p.447, Fig.3 a]
Copepodite stage V Calanoides acutus with large oil sac containing wax esters.
Nota: The solid-liquid phase transitions of lipids are a factor regulating the buoancy of the copepods. These phase transitions are controlled in relation to the physical environment, through the selective accumulation of specific lipids with optimum levels of unsaturation. The necessity to control buoyancy and maintain an optimum depth is a fundamental evolutionary force, driving anatomical, biochemical and behavioural adaptations within the aquatic realm. It is hypothesized that each species adjusts the amount, composition and anatomical location of lipids, to maximize fitness according to the preferred habitat and life history traits |
 Issued from : C. Séret in Thesis 3ème Cycle, UPMC, Paris 6. 1979, Annexe. [p.23]. Issued from : C. Séret in Thesis 3ème Cycle, UPMC, Paris 6. 1979, Annexe. [p.23].
Geographical occurrences of Calanoides acutus in the Indian Ocean. [after publications from: Brady, 1883, 1918; Thompson, 1900; Wolfenden, 1908, 1911; With , 1915; Rosendorn, 1917; Farran, 1929; Sewell, 1929, 1947; Brady & Gunther, 1935; Steuer, 1929, 1392, 1933; Ommaney, 1936; Vervoort, 1957; Tanaka, 1960; Brodsky, 1964; Seno, 1966; Andrews, 1966; Grice & Hulsemann, 1967; Seno, 1966; Frost & Fleminger, 1968; Voronina, 1970; Zverva, 1972]. |
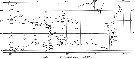
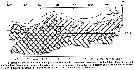
 Issued from : A.C. Hardy & E.R. Gunther in Discovery Reports, 1935 (1936), 11. [p.138, Fig.65]. Issued from : A.C. Hardy & E.R. Gunther in Discovery Reports, 1935 (1936), 11. [p.138, Fig.65].
Vertical distribution of Calanus acutus ( = Calanoides acutus) at stations between Falkland Islands and South Georgia February 1927 and between South Georgia and Tristan da Cunha February 1926.
The scale represents the numbers per 50 m vertical haul taken by a series of closing N 70 V nets.
Horizontal broke lines show the ranges of these vertical hauls. |
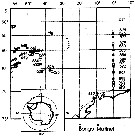
 Issued from : A.C. Hardy & E.R. Gunther in Discovery Reports, 1935 (1936), 11. [p.7, Fig.4]. Issued from : A.C. Hardy & E.R. Gunther in Discovery Reports, 1935 (1936), 11. [p.7, Fig.4].
Chart showing the line of the Antarctic Convergence, separating the Antarctic and the sub-Antarctic Zones, and the course of the two surface currents with influence South Georgia within the Antartic Zone. |
 Issued from : J. Michels, S.B. Schnack-Schiel, A. Pasternak, E. Mizdalski, E. Isla & D. Gerdes in Polar Biol., 2012, 35. [p.380, Fig.11 (part., copepodid stages omitted.)]. Issued from : J. Michels, S.B. Schnack-Schiel, A. Pasternak, E. Mizdalski, E. Isla & D. Gerdes in Polar Biol., 2012, 35. [p.380, Fig.11 (part., copepodid stages omitted.)].
Vertical distribution of the adult females and of Calanoides acutus from East Weddell Sea shelf (70°48.558'S, 10°43.698'W) between 9 and 28 December 2003. The water depth at the sampling spots varied between 438 and 484 m.
The white dots represent the weighted mean depths. |
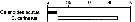
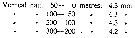 Issued from : P. Ottestad in On Antarctic Copepods from the ''Norvegia'' Expedition 1930-1931. Scient. Results Norw. Antarct. Exped., 1936, 15. [p.34, Table 18]. Issued from : P. Ottestad in On Antarctic Copepods from the ''Norvegia'' Expedition 1930-1931. Scient. Results Norw. Antarct. Exped., 1936, 15. [p.34, Table 18].
The mean length of cephalothorax of mature C. acutus in the various vertical hauls. at station 18 (± 63°S, 175°E). |
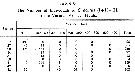 Issued from : P. Ottestad in On Antarctic Copepods from the ''Norvegia'' Expedition 1930-1931. Scient. Results Norw. Antarct. Exped., 1936, 15. [p.18, Table 6]. Issued from : P. Ottestad in On Antarctic Copepods from the ''Norvegia'' Expedition 1930-1931. Scient. Results Norw. Antarct. Exped., 1936, 15. [p.18, Table 6].
I + II + iii = copepodid stages; depth in meters. Vertical hauls by standard plankton net (Rustad, 1930). |
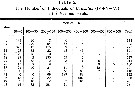 Issued from : P. Ottestad in On Antarctic Copepods from the ''Norvegia'' Expedition 1930-1931. Scient. Results Norw. Antarct. Exped., 1936, 15. [p.17, Table 5]. Issued from : P. Ottestad in On Antarctic Copepods from the ''Norvegia'' Expedition 1930-1931. Scient. Results Norw. Antarct. Exped., 1936, 15. [p.17, Table 5].
IV+ V+ VI = copepodid stages; depth in meters. Vertical hauls by standard plankton net (Rustad, 1930).
Nota: The vertical distribution of the 3 oldest stages will be seen from Table V. It will be seen that the vertical distribution is not the same at all stations. At the stations taken in the area between Kerguelen and the Ross Sea (stations 6 to 18) the greatest quantities were taken in the water layer above 200 m. The same applies also to stations 27, 28, and 38 in Bellinghausen Sea. In contrast to this greatest quantities in the Scotia Sea (Stations 42 and 43) were found between 400 and 200 m. A similar state of affairs also appkies to stations 46 and 47 in the Weddell Sea. In contrast to the older stages the youngest are found almost exclusively in the surface layer (see Table 6). |
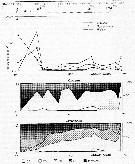
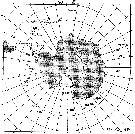 Issued from : P. Ottestad in On Antarctic Copepods from the ''Norvegia'' Expedition 1930-1931. Scient. Results Norw. Antarct. Exped., 1936, 15. [p.7, Fig.1]. Issued from : P. Ottestad in On Antarctic Copepods from the ''Norvegia'' Expedition 1930-1931. Scient. Results Norw. Antarct. Exped., 1936, 15. [p.7, Fig.1].
The position of the biological stations of ''Norvegica'' 1930-1931. |
 Issued from : P. Ottestad in On Antarctic Copepods from the ''Norvegia'' Expedition 1930-1931. Scient. Results Norw. Antarct. Exped., 1936, 15. [p.7, Fig.1]. [p35, Fig.10]. Issued from : P. Ottestad in On Antarctic Copepods from the ''Norvegia'' Expedition 1930-1931. Scient. Results Norw. Antarct. Exped., 1936, 15. [p.7, Fig.1]. [p35, Fig.10].
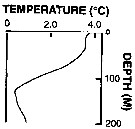
The variation of the temperature with depoth in the upper 100 m at stations 12, 11, and 13 and the composition of the stock in stages for C. acutus at the same stations. |
 Issued from : J.H.M. Kouwenberg, C. Razouls & N. Desreumaux in Biogeographic Atlas of the Southern Ocean, Scient. Comm. Antarct. Res., Cambridge, 2014, 6.6. [p.291, Map 2]. Issued from : J.H.M. Kouwenberg, C. Razouls & N. Desreumaux in Biogeographic Atlas of the Southern Ocean, Scient. Comm. Antarct. Res., Cambridge, 2014, 6.6. [p.291, Map 2].
Distribution of Calanoides acutus. |
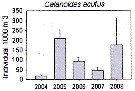 Issued from : K.M. Swadling, F. Penot, C. Vallet & al. in Polar Sci., 2011, 5. [p.125, Fig.5]. Issued from : K.M. Swadling, F. Penot, C. Vallet & al. in Polar Sci., 2011, 5. [p.125, Fig.5].
Mean abundance (ind. per 1000 m3) and standard errors of Calanoides acutus collected each summer (January), 2004-2008 in the region covered the area from 139°E to 145°E from Terre Adélie to the Mertz Glacier Tongue.
Nota: The entire region sampled during 2004 to 2008 surveys was south of the continental slope and was under the influence of the westward flowing Antarctic Coastal Current. Macrozooplankton were collected by oblique tows of a Bongo net (500 µm mesh aperture) |
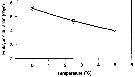 Issued from : P. Ward & R. Shreeve in Polar Biol., 1998, 19. [p.143, Fig.1]. Issued from : P. Ward & R. Shreeve in Polar Biol., 1998, 19. [p.143, Fig.1].
Time to 50% hatching versus temperature (Belehradek function relating embryonic duration: D : days; a = 4883; alpha = - 27.19; b fixed as - 2.05) to temperature (T°C) fitted to the data for Calanoides acutus from South Georgia (53.5° S, 37° W).
Prosome length = 4.10 mm (± 0.18); egg diameter: outer membrane : 190 µm (± 8). |
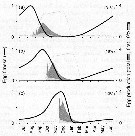
 Issued from : V.A. Spiridonov & K.N. Kosobokova in Mar. Ecol. Prog. Ser., 1997, 157. [p.236, Fig.2]. Issued from : V.A. Spiridonov & K.N. Kosobokova in Mar. Ecol. Prog. Ser., 1997, 157. [p.236, Fig.2].
Abundance of Rhincalanus gigas and Calanoides acutus, Calanus propinquus (A) and stage composition of C. acutus (B) and C. propinquus (C) populations along the Greenwich transect in the upper 0 to 500 m water layer. PF: Polar frint; ACC: Antarctic Circumpolar Current; WF: Weddell Fronf; MR: Maud Rise; CWB: Continental Water Boundary. |
 Issued from : V.A. Spiridonov & K.N. Kosobokova in Mar. Ecol. Prog. Ser., 1997, 157. [p.236, Fig.2]. Issued from : V.A. Spiridonov & K.N. Kosobokova in Mar. Ecol. Prog. Ser., 1997, 157. [p.236, Fig.2].
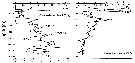
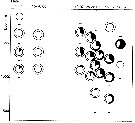
Stations at which zooplankton sampling was performed in the Weddell Sea and adjacent areas during the Winter Weddell Gyre study 1992 (in June-July 1992). |
 Issued from : V.A. Spiridonov & K.N. Kosobokova in Mar. Ecol. Prog. Ser., 1997, 157. [p.239, Fig.4]. Issued from : V.A. Spiridonov & K.N. Kosobokova in Mar. Ecol. Prog. Ser., 1997, 157. [p.239, Fig.4].
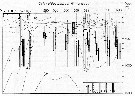
Vertical distribution of temperature (°C) and characteristics of the vertical distribution of copepodite stages of Calanoides acutus sampled to 1000 m depth along the Greenwich transect.
Vetical lines (1) show the range of occurrence, horizontal bars (2) mark the median depth of occurrence, and rectangles §3) cover the range centered around the median depth where a core (50% of a hemi-population) is concentrated. C3 to C6 copepodite stages. |
 Issued from : V.A. Spiridonov & K.N. Kosobokova in Mar. Ecol. Prog. Ser., 1997, 157. [p.240, Fig.5]. Issued from : V.A. Spiridonov & K.N. Kosobokova in Mar. Ecol. Prog. Ser., 1997, 157. [p.240, Fig.5].
Examples of the vertical distribution of Calanoides acutus at particular stations in the Weddell Gyre (A, B) and in the Coastal Current (C).
Histograms show absolute numbers; line graphs represent proportions of hemi-populatio,ns inhabiting particular layers; x: very low abundance (< 1 ind. 1000 per m3) of a stage |
 Issued from : V.A. Spiridonov & K.N. Kosobokova in Mar. Ecol. Prog. Ser., 1997, 157. [p.241, Fig.7]. Issued from : V.A. Spiridonov & K.N. Kosobokova in Mar. Ecol. Prog. Ser., 1997, 157. [p.241, Fig.7].
Proportion of males (black sectors) and females (white sectors) in CV (inner circles) and adults (outer circles) of Calanoides acutus at various depths. Horizontal bars indicate vertical limits of sampling. |
 Issued from : Ø. Varpe, C. Jørgensen, G.A. Tarling & Ø. Fiksen in Oikos, 2007, 116. [p.1333, Fig.1] Issued from : Ø. Varpe, C. Jørgensen, G.A. Tarling & Ø. Fiksen in Oikos, 2007, 116. [p.1333, Fig.1]
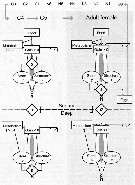
Schematic overview of processes and decisions in a copepod life history model.
Three life history decisions are optimised: alocation of carbon to store or structure (alfa), the use of store (epsilon, and habitat change (sigma) (active in the surface, diapause while deep).
Note that relevant decisions differ with stage and habitat.
Migration coasts are added to metabolism when changing from surface to deep habitat.
Stores are used for metabolism if net carbon gain is negative (not shown for surface habitat)
Development of early life-cycle stages (egg-C3, always in the surface) are modelled as temperature and food dependent stage transitions.
The authors note that timing of reproduction influenses future prospects of offspring and therefore the reproductive value of parents. Early offspring are often more valuable than later ones when food availability and predation risk fluctuate seasonally. Marine zooplankton have evolved a diversity of life history strategies in response to seasonality.
From the offspring's perspective, there are at least three general drivers of annual rhythms in reproduction:
1 - Food; as peak food demands of the offspring should coincide with high food availability (see Both & al., 2006). This is the essence of the classical match-mismatch hypothesis (Cushing, 1990).
2 - Predation; as the offspring's prospects will vary when predation risk is seasonal (Vonesh, 2005).
3 - Habitat availability; as suitable habitat conditions influence the prosoects of young at several stages in their development ( fo rexample nursing in ice-breeding seals, sea birds). Each factors can have direct effects on phenology, or impose constraints such as develpmental thresholds that affect phenology earlier in life.
Individuals of Calanoides acutus are characterised by four states; developmental stage, structural size, energy reserves and vertical location.
There are two habitats, a surface habitat with seasonal predation risk and food availability, and a safer deep habitat with no food and low metabolism (diapause). Optimal life histeries (diapause and energy allocation strategies) are found by dynamic programming: seasonal egg fitness (reproductive value) emerges from the model and peak values are typically before the feeding season. Disentangling the fitness components, Varpe & coll. conclude that seasonality in egg fitness is caused by environmental seasonality in food and predation risk and by time-constraints onj development and diapause preparation. Realised egg production, as predicted from population simulations, does not match the seasonal peak in offspring fitness but is delayed relative to peak egg fitness. The authors term this an 'internal life history mismatch' as contraints and tradeoffs cause sub-optimal birth dates for most eggs whereas mothers maximise their reproductive value by high number of eggs rather than few and optimally timed eggs. The earliest eggs have a disproportionately high contribution to population recruitment, emphasing the importance of early eggs and the need to understand seasonal patterns in offspring fitness. |
 Issued from : Ø. Varpe, C. Jørgensen, G.A. Tarling & Ø. Fiksen in Oikos, 2007, 116. [p.1334, Fig.2]. Issued from : Ø. Varpe, C. Jørgensen, G.A. Tarling & Ø. Fiksen in Oikos, 2007, 116. [p.1334, Fig.2].
Calanoides acutus.
Possible body masses are shown in grey: total body mass for given structural size x (irreverible) depends on the size of stores y (reversible).
Maximum store is three times structure.
An example is included of how the allocation decision alpha detemines change in structure and store.
In addition, store decreases if used for reproduction, structural growth or metabolism (see fig.1).
Individuals moult to the next stage at fixed strucrural mass.
The state space captures common structure-store combination for developmental stages from C4 to adult females.
For simplicity, structural body mass of adult females is constant at 120 µg carbon whereas stores may vary;
Details on how the state space is derived are available in Appendix 1 |
 Issued from : Ø. Varpe, C. Jørgensen, G.A. Tarling & Ø. Fiksen in Oikos, 2007, 116. [p.1334, Fig.3] Issued from : Ø. Varpe, C. Jørgensen, G.A. Tarling & Ø. Fiksen in Oikos, 2007, 116. [p.1334, Fig.3]
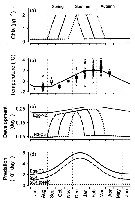
Environmental forcing and development of young stages in a life history model of the Southern Ocean copepod Calanoides acutus .
(a) Food availability in Chla units for an early, intermediate, and late feeding scenario.
(b) Temperature in the surface habitat; model forcing (solid) based on measurements at 50 m depth, or nearest depth above (circles are data points, squares are monthly means)
Qara from stations in the World Ocean Atlas (http://www.nodc.noaa.gov) located in the reference area (fig. A1).
(c) Development as daily transition probabilities between stages (Eq. A5). Development is temperature-dependent for egg-Nauplios 2, and temperature- and food dependent for Nauplius 3-Copepodite 3 (seasonality depends on feeding scebario).
(d) Predation rate for different stages and habitats. |
 Issued from : Ø. Varpe, C. Jørgensen, G.A. Tarling & Ø. Fiksen in Oikos, 2007, 116. [p.1336, Fig.4]. Issued from : Ø. Varpe, C. Jørgensen, G.A. Tarling & Ø. Fiksen in Oikos, 2007, 116. [p.1336, Fig.4].
Development, survival, and fecundity as predicted for a cohort of copepod egg produced in early spring; arrows are one year apart and indicate the start date of the cohort (1 September).
(a) Temporal distribution of egg, nauplii, and copepodites resulting from the egg cohort (relative abundances) . Note that some individuals spend diapause as C4 stage but most as C5 stage.
Expected survival probability (line) and fecundity (eggs per individual; solid area) for the same cohort. |
 Issued from : Ø. Varpe, C. Jørgensen, G.A. Tarling & Ø. Fiksen in Oikos, 2007, 116. [p.1337, Fig.6]. Issued from : Ø. Varpe, C. Jørgensen, G.A. Tarling & Ø. Fiksen in Oikos, 2007, 116. [p.1337, Fig.6].
Seasonality in fitness components and overall egg fitness predicted by a copepod life history model.
(a) Carbon gain (broken line) and predation rate (solid line) of the early feeding scenario (see fig.3).
(b-f) Expected fate of eggs produced at the different days (egg date) of the year.
(b) Development time to specific stages (weighted average for the whole cohort).
(c) Stage at mid-winter (1 July).
(d) Survival probabily until specific stages.
(e) Potential fecundity (female offspring) of a single egg assuling no predation, and flifetime reproductive suxxess (LRS) when predation is included.
(f) Egg fitness measured relative to the egg with maximum reproductive value and adjusted for the population growth rate. |
 Issued from : Ø. Varpe, C. Jørgensen, G.A. Tarling & Ø. Fiksen in Oikos, 2007, 116. [p.1338, Fig.7]. Issued from : Ø. Varpe, C. Jørgensen, G.A. Tarling & Ø. Fiksen in Oikos, 2007, 116. [p.1338, Fig.7].
Egg fitness and egg production for (a) the early, (b) intermediate, and (c) late feeding scenario.
Egg production is derived from population simulations where individuals follow the optimal life history strategy, and are shown as daily population egg production as a percentage of total annual egg production.
The 10% earliest eggs from the previous year contribute to a disproportionately large part of total egg production (contribution highlighted in light grey and given in parentheses).
Seasonality in net carbon gain (grey line) is indicated (cf. fig.6 and A3). |
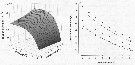 Issued from : Ø. Varpe, C. Jørgensen, G.A. Tarling & Ø. Fiksen in Oikos, 2007, 116. [Appendix 1, np.4, Fig. A2]. Issued from : Ø. Varpe, C. Jørgensen, G.A. Tarling & Ø. Fiksen in Oikos, 2007, 116. [Appendix 1, np.4, Fig. A2].
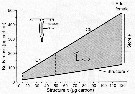
Growth and development in a life-history model of Calanoides acutus.
(a) Modelled net carbon gain vs temperature and food availability of stages C4 ro adult female (after equation A1, p.4). Temperature influences net gain via temperature-dependent metabolism and growth. Note that when converting to growth per individual (equation A3, p.4), the net gain G is a function of structure rather than total body carbon (structure + store).
(b) Median development time (MDT) from hatching to stage C4 and C5 at different temperatures. Simulated MTD frpm the model (symbols) compared with laboratory derived estimates of MTD (lines). The simulated cohort is set to resemble laboratory conditions experiencing non-limited food and the same mortality for all stages. Simulated MDT to C4 is shown with squares. For clarity, C4s and C5s are here given a fixed energy allocation rule alpha. We present MDT to C5 if 25% (triangles) or 75% is allocated to more (diamonds). |
 Issued from : C.B. Miller in Biological Oceanography, Blackwell Publishing, 2005. [p.197, Fig. 9.9]. After Andrews, 1966. Issued from : C.B. Miller in Biological Oceanography, Blackwell Publishing, 2005. [p.197, Fig. 9.9]. After Andrews, 1966.
The distribution pattern (filled circles) of Calanoides acutus at stations (all circles) sampled by the Discovery Expedition. |
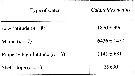
| | | | Loc: | | | Antarct. (King George Is., Potter Cove, Gerlache & Bransfield Strait, Bellingshausen Sea, S & SE Peter 1st Island, Amundsen Sea, Croker Passage, Peninsula, Scotia Sea, South Georgia, Drake Passage, Weddell sea, Orkney Is., Lazarev Sea, Atlant. (SW, SE), Indian, Dumont d'Urville Sea, Davis station-Gardner Is., Prydz Bay, Lützow-Holm Bay, Pacif. (SW, SE), Croker Passage, Cap Evans (under ice), sub-Antarct. (Atlant. SW, N & S South Georgia, Indian, SW Pacif., Prydz Bay | | | | N: | 212 | | | | Lg.: | | | (10) F: 5,3-4,5; (25) F: 5,7-4,75; (31) F: 5,65; M: 4,6; (33) F: 4,7-5,3; (66) F: 5,28-4,58; (102) F: 5,7-4,6; (196) F: 4,6-3,5; (246) F: 5,27-4,64; {F: 3,50-5,70; M: 4,60}
Prosome: (1204) F: 4.10 mm (± 0.18); (1205) F: 4.36 mm (SD = 0.2016); M: 3.54 mm (SD = 0.174). | | | | Rem.: | Epi-mesopelagic.
Sampling depth (Antarct., sub-Antarct.): 0-1000 m.
After Ottestad (1936, p.32) with regard to the horizontal distribution, Mackintosh (1934) has demonstrated that this form belongs to ''species found on all isotherms but with a slight preference for colder water''. The greatest quantities are found between the isotherms for -1° and -2°C, but great quantities are also found up to +3°C; in areas with a temperature above +3° the quantity of this species decreases very heavily with increasing temperature. Furthermore, Mackintosh remarks numerically, this is the most important species of all. It is distributed throughout the Antarctic surface waters, and there have been catches of 1000 m or more everywhere from the convergence to the cold waters of the Bellinghausen and Weddell Seas. The species is on the whole evenly distributed and there is no tendency to form shoals. In our material C. acutus is found from the surface downwards, in any event to 500-600 m. The quantity at this depth is very small in comparison with what is found in the surface waters. As a rule the quantity decreases heavily from 300 m downwards. However, there is a substantial difference between the vertical distribution of the young and older stages.. The three youngest copepodite stages are not found deeper than 300 m, they occur only in the surface layer; it is only the older animals which are found at greater depths.
For Vervoort (1951, p.53) this species differs from the genus Calanus Leach, 1816 in several respects, in particular by a carinated cephalon and 4 setae (2 apical and 2 along the inner edge) on the 3 rd endopodal segment of the female P5; the male has reduced oral parts (in size and also in the number of setae) and by the prsence of a small seta on the inner edge of the right 2nd exopodal segment of P5 and by the reduction of the endopods. The genus Calanoides, in spite of its laconic characterisation by Brady (1883), should be preserved.
After Tanaka (1960, p.16) the species is one of the common species of the Antarctic, showing marked decrease in the region of the Antarctic Convergence and found this form at stations from the Indian Ocean (between 66°06'S, 44°10'E and 67°03'S, 10°44'E) in December, between the surface and 400 m usually taken mixed with the developmental stages.
For Andrews (1966) this species is mostly confined to south of the antarctic convergence.
After Arashkevich (1978) the diets of the species are pennate diatoms (mainly in the gut content), and centric diatoms (less frequent).
For Voronina & al. (1979, p.76) this species is a non-selective filtrator, one of the three abundant species of antarctic copepods, which constitutes 73 % of the total plankton biomass.
Ferrari & Dearborn show that this species is consumed by an Antractic brittle star (Astrotoma agassizii) resulted from near-bottom aggregations of lipid-rich C. acutus during downward migration. It is an exemple of pelagic-to-benthic trophic link.
After Zmijewska (1993, p.90) the species in Croker Passage (Antractica) shows one-year life cycle. The first fertilized females produced eggs, which remain in a dormant state until the spring.
For Graeve & al. (1994, p.915) the trophic position of this species can be elucidated by means of the lipid composition (''marker lipids''); total lipid contents of both stages varied from 35 to 51% of dry weight. By far the prdominant lipid class were wax esters accounting for about 92% of total lipids, the rest were phospholipids and small amounts triacylglycerols. Characteristic lipid compenents were long-chain monounsaturated fatty acids and fatty alcohols 20:1 (n-9) and 22:1 (n-11). These components together with elevated amounts of the 18:4 (n-3) and, to a lesser degree, of the 16:1 (n-7) fatty acids, typical of phytoplankton lipids, indicate an herbivorous feeding.
In summary: the species has a seasonal migration between the feeding habitat (surface waters) and the diapause habitat (depths of 500-1000 m). before diapause most individuals have reached C4 stage or older (Andrews, 1966; Atkinson & al., 1997). While deep, most individuals moult to the adult stage and mating takes place before or during the spring ascent. Only females return to the surface, with sperm stored for the whole breeding season (Varpe & al., 2007) | | | Last update : 02/07/2021 | |
|
|
 Any use of this site for a publication will be mentioned with the following reference : Any use of this site for a publication will be mentioned with the following reference :
Razouls C., Desreumaux N., Kouwenberg J. and de Bovée F., 2005-2025. - Biodiversity of Marine Planktonic Copepods (morphology, geographical distribution and biological data). Sorbonne University, CNRS. Available at http://copepodes.obs-banyuls.fr/en [Accessed August 29, 2025] © copyright 2005-2025 Sorbonne University, CNRS
|
|
|
|


;)
;)
;)
;)
;)
;)
;)
;)
;)
;)
;)
;)
;)
;)
;)
;)
;)
;)
;)
;)
;)
;)
;)

;)
;)
;)
;)
;)
;)
;)
;)
;)
;)
;)
;)
;)
;)
;)
;)
;)
;)
;)
;)
;)
;)
;)
;)
;)
;)
;)
;)
;)
;)
;)
;)
;)
;)
;)
;)
;)
;)
;)
;)
;)
;)
;)
;)
;)
;)
