|
|
 |
|
Calanoida ( Order ) |
|
|
|
Calanoidea ( Superfamily ) |
|
|
|
Calanidae ( Family ) |
|
|
|
Neocalanus ( Genus ) |
|
|
| |
Neocalanus cristatus (Kröyer, 1845) (F,M) | |
| | | | | | | Syn.: | Calanus cristatus Kröyer, 1845 (in Damkaer & Damkaer, 1979 (p.22); Giesbrecht, 1892 (p.91, 127, figs. juv.); Giesbrecht & Schmeil, 1898 (p.16); With, 1915 (p.11, Rem.); Campbell, 1929 (p.306); Mori, 1937 (1964) (p.15, figs.Juv.F); Tanaka, 1938 (p.599, figs.F,M); Wilson, 1942 a (p.172); Sewell, 1948 (p.395, 495, 555, 559); C.B. Wilson, 1950 (p.177); Brodsky, 1950 (1967) (p.94, figs.F,M); Tanaka, 1956 (p.258); Minoda, 1958 (p.253, Table 1, 2, abundance); Heinrich, 1962 (p.465, life history, production); Brodsky, 1962 c (p.97); 1964 (p.105, 107); Kitou, 1965 (p.95, Tables 1-5); Furuhashi, 1966 a (p.295, vertical distribution vs mixing Oyashio/Kuroshio region); Tanaka & Omori, 1967 (p.241); Fleminger, 1967 a (tabl.1); Vinogradov, 1968 (1970) (p.32, 45, 49, 51, 52, 53, 56, 60, 61, 86, 91, 94, 97, 109, 141, 194, 221-22, 234, 243, 244, 256, 291); Park, 1968 (p.532); Lubny-Gertzyk, 1968 (p.275); Heinrich, 1968 (p.287, fig.1, 3); Arashkevich, 1969 (p.698, figs.F); Omori, 1969 (p.5, Table 1); Nakai J., 1969 (p.183, indicator Oyashio movement); Mullin, 1969 (p.308, Table I: estimates of production); Omori, 1970 (p.113, body size & chemical composition); Morris, 1970 (p.2300); Vaupel-Klein, 1970 (p.3, 7); Minoda, 1971 (p.15); Shih & al., 1971 (p.144, 201); Ikeda, 1971 (p.280, respiration, organic matter composition); Tahuchi & Ishii, 1972 (p.419, respiration-excretion-grazing); Marshall & Orr, 1972 (p.8); Brodsky, 1972 (1975) (p.9, 68, 84, 120, figs.); Vyshkvartzeva, 1972 (1975) (p.188, figs.); Ikeda, 1974 (p.1, respiration, ammonia excretion rate); Sullivan & al., 1975 (p.176); Peterson & Miller, 1976 (p.14, Table 1, 3, abundance vs interannual variations); Kos, 1976 (Vol. II, figs.F,M, Rem.); Vyshkvartzeva, 1976 (p.14, figs.); 1977 a (p.97, figs.); Peterson & Miller, 1977 (p.717, Table 1, seasonal occurrence); Mauchline & Nemoto, 1977 (p.109, figs.F, juv.: pattern of integumental organs); Brodsky & al., 1983 (p.176, figs.F,M); Gordon & al., 1985 (p.89, Table 3, fish diet); Ishii, 1986 (p.291, chromosomes); Fleminger, 1985 (p.275, 283, Table 1, fig.M); Nagasawa & Terazaki, 1987 (p.475); Sasaki al., 1988 (p.505, tab.1, fecal pellets flux); Terazaki & Wada, 1988 (p.177, vertical distribution, carcasses); Giguère & al., 1989 (p.522, Table 1, formaldehyde preservation); Park & al., 1991 (p.203); Hernandez-Trujillo, 1991 (1993) (tab.I); Zauke & al., 1996 (p.141, Table 7, metal bioaccumulation); Pinchuk & Paul, 2000 (p.4, table 1, % occurrence); Hernandez-Trujillo & Esqueda-Escarcega, 2002 (in Appendix) | | | | Ref.: | | | Bradford & Jillett, 1974 (p.6, figs.F,M); Gardner & Szabo, 1982 (p.142, figs.F,M); Mackas & Sefton, 1982 (p.1179); Bradford, 1988 (p.74, 76, 79, Rem.); Nishida, 1989 (p.173, table 2, 3, dorsal hump); Miller al.,1990 (p.91, fig.: Md); Chihara & Murano, 1997 (p.739, Pl.67: F,M); Bucklin & al., 1999 (p.239, molecular systematic); Bucklin & al., 2003 (p.335, tab.2, figs.2, 4, Biomol.); Machida & al., 2004 (p.71, genetic); Machida & al., 2006 (p.1071, tab.1,3, figs.3,4, molecular phylogeny); Kim S. & al., 2013 (p.64, fig.3: mitochondrial genome); Lewis A., 2014 (p.1200, Table I, II, figs. labrum-paragnaths); Ohtsuka & Nishida, 2017 (p.578, fig. 22.2, Rem.) | 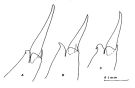 issued from : J.M. Bradford & J.B. Jillett in Crustaceana, 1974, 1. [p.10, Fig.1,A,B,C]. Male (from Gulf of Alaska): A, outer distal part of exopod segment 1 of P2. Female: B, idem. Stage V copepodite: C, idem.
|
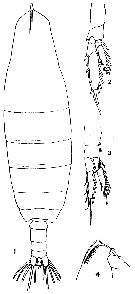
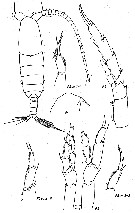
 issued from : K.A. Brodsskii in Calanoida of the Far Eastern Seas and Polar Basin of the USSR. Izdatel'stov Akad. Nauk SSSR, 1950 (Israel Programm for Scientific Translations, Jerusalem, 1957). [p.94, Fig.23]. As Calanus cristatus. Female and Male, Copepodod V (J). S5 = P5; NP = northern part of the Pacific Ocean.
|
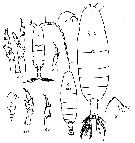
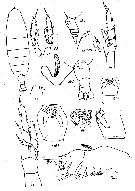
 issued from : T. Mori in The pelagic Copepoda from the neighbouring waters of Japan, 1937 (1964). [Pl.3, Figs.1-4]. As Calanus cristatus. Neocalanus cristatus juvenile V Female: 1, habitus (dorsal); 2, P5 (anterior); 3, P1 (anterior); 4, forehead (lateral).
|
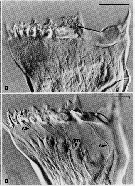 Issued from : C.B. Miller, D.M. Nelson, C. Weiss & A.H. Soeldner, 1990, 106. [p.92, Fig.1, B, D]. Chewing surfaces of the mandibular gnathobase of copepodite 4 : B, Jaw at interphase of molt cycle ; epidermis is little differentiated under tooth row ; D, Jaw after apolysis at an early stage of extrusion of tooth molds from terminal ends of epidermal cells, showing (arrowed) salivary ducts (S) passing through tooth molds , apolysis space (part without folds), and old exoskeleton. Scale bars : 0.065 mm (B); 0.070 mm (D). Nota : The teeth are equipped to deliver some sort of substance directly through ducts opening immediately on the tooth surface. This substance could be either poisonous (to subdue active, animal prey) or an aid to digestion.
|
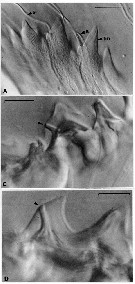 Issued from : C.B. Miller, D.M. Nelson, C. Weiss & A.H. Soeldner, 1990, 106. [p.93, Fig.2, A, C, D]. Chewing surfaces of the mandibular gnathobase of copepodite 4 : A, detail of tooth molds of specimen in fig. 1D on different focal plane (S: ''salivary'' ducts; tm: tooth molds); C-D, examples of ''salivary'' ducts passing through cusps of central teeth (arrow indicates duct openings on teeth). Scale bars: 0.010 mm.
|
 Issued from : C.B. Miller, D.M. Nelson, C. Weiss & A.H. Soeldner, 1990, 106. [p.94, Fig.3, C]. Chewing surfaces of the mandibular gnathobase of copepodite 4 : C, jaw in postmolt phase (h = extension of hemocoele fills the anterior side. Scale bar: 0.090 mm.
|
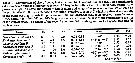
 issued from : R.J. Machida, M.U. Miya, M. Nishida & S. Nishida in Mar. Biol., 2006, 148. [p.1077, Table 5]. Comparisons of selected biological characteristics of 6 species olus 1 subspecies of Neocalanus.
|
 issued from : A. Fleminger in Mar. Biol., 1985, 88. [p.283, Fig.5 A]. As Calanus s.l. cristatus.
Male (from N Pacific, subarctic): Left A1 proximal segments (ventral view);
Nota: see remarks in Calanus s.l. pacificus californicus (Fleminger, 1985, p.275) concerning the dimorphism in the female A1.
|
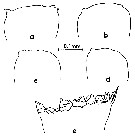 issued from : M. Omori in Marine Food Chain. Ed. J. J.H. Steele, 1970. [p.123, Fig.3]. Variation of cutting edge of Md in Calanus cristatus. Female: a and b. Male: c and d. Copepodite V: e. After Omori (1970, p.122) when the species becomes adult, the cutting edge of its mandible is reduced greatly, and it is probable that the species almost stops feeding.
|
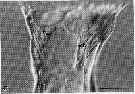
 issued from : C.B. Miller, Huntley M.E. & Brooks E.R. in Limnol. Oceanogr., 1984, 29 (6). [p.1284, Fig.10]. Interference contrast micriograph of mandibular edge of Neocalanus cristatus fourth copepodite that is nearly ready to molt (\"premolt\"). New teeth have formed in the apolysis space below the old teeth. Scale bar = 0.050 mm.
|
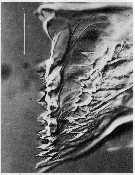
 issued from : A.K. Heinrich in Oceanol., 1969, 8. [p.234, Fig.2,c]. Calanus (= Neocalanus) cristatus from NE Pacific Ocean: Chewing edge of mandible in Stage I copepodite. v1, ventral tooth; c, central teeth. Nota: Apart from other distinctive characteristics, however, the fully grown individuals of the several Calanus and Neocalanus species present certain differences in the structure of the chewing edge of the mandible (See in Beklemishev, 1959).
|
 ssued from : J. Mauchline & T. Nemoto in Bull. Plankton Soc. Japan, 1977, 24 (2). [p.111, Fig.5, A]. Distributions of pores in the treated integuments of Calanus cristatus (= Neocalanus cristatus) adult female from east Hokkaido, Japan (about 42°N, 146°E).
|
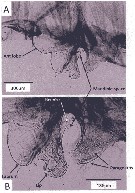 Issued from : A. Lewis in Crustaceana, 2014, 87 (10). [p.1213, Fig.6]. Neocalanus cristatus (Krøyer, 1848): A, lateral view of labrum-paragnath complex including anterior labral lobe 'Ant lobe) but without mandible; B, enlarged view of labrum, lip and paragnaths. See: http://booksandjournals.brillonline.com/content/journals/15685403. Nota: Relative to the body axis, the average angle of the labral-paragnath complex is +16°; the complex faces down and forward. The anterior margin of the labrum proper is located a very short distance behind the first antenna, about 3% of the total body length. In lateral view, the labrum is a hood with a tongue-like projection originating within the hood and terminating in the lip; the labrum is contiguous with an anterior labral lobe. From a ventral view, the labrum bears a group of long setules that overlap the lip. The lip is bilobed, the lobes bearing spinules. The margins of the mandible opening are heavily sclerotized and have at least one very small, brush-shaped process (fig.6B). The paragnaths are subconical and bear verically arranged clusters of spinules (fig.7A). The average length of the labrum-paragnath complex (without the anterior labral lobe) is almost 9% of the total body length, 12% with the lobe. The length of the labrum is 45% of the labrum-paragnath complex (witout the anterior labral lobe). The height of the labrum (hood without lip) is slightly less than 1.5 times the length; the height of each paragnath is slightly less than 75% of the length. Remarks: Calanoid paragnaths are paired lobes that project from a cuticular plate or pair of plates. Although the paragnaths have been called the labium, Huys & Boxshall (1991) believe the term labium should be used only when they are fused and form a median lobe.
|
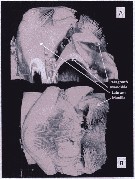 Issued from : A. Lewis in Crustaceana, 2014, 87 (10). [p.1214, Fig.7]. Neocalanus cristatus (Krøyer, 1848): A, confocal: lateral view of complex to show nature of armature elements on labrum and paragnath; B, confocal: ventral view with image rotated to show thickness of labrum and proximity of first maxillae to paragnath base. See: http://booksandjournals.brillonline.com/content/journals/15685403.
|
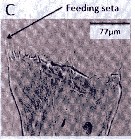 Issued from : A. Lewis in Crustaceana, 2014, 87 (10). [p.1220, Fig.13, C]. Neocalanus cristatus (Krøyer, 1848): C, gnathobase. See: http://booksandjournals.brillonline.com/content/journals/15685403. Nota: The mandible gnathobase bears a series of small teeth and a knob-shaped pad next of the ventralmost tooth. The spinulate feeding seta is slender and short; this seta on the dorsal end fits into oesophagus and enables food introduction into the digestive tract as a result of gnathobase movement (Lewis & al., 1998). The dentition of the gnathobase along with evidence of silica in the teeth (Miller & al., 1990), is an indication of the species ability to crush diatom frustules as well as its hebivorous nature. From the litterature (Gifford, 1993) however, there is evidence that nanoplankton and even small zooplankton may serve as food.
|
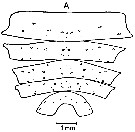
 Issued from : K.A. Brodsky, N.V. Vyshkvartzeva, M.S. Kos & E.L. Markhaseva in Opred. Faune SSSR, 1983, 135. [p.177, Fig.77]. As Calanus cristatus. Female (after Tanaka, 1938; Brodsky, 1938, 1950, 1972). Note urosome (Abd) with a spermatophore attached on ventral genital segment.
|
 Issued from : K.A. Brodsky, N.V. Vyshkvartzeva, M.S. Kos & E.L. Markhaseva in Opred. Faune SSSR, 1983, 135. [p.178, Fig.78]. As Calanus cistatus. Male (after Brodsky, 1938 and 1972).
|
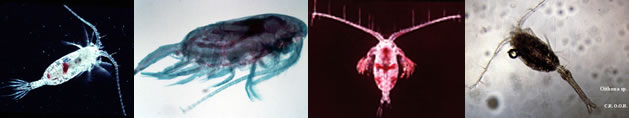
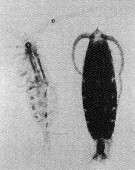 Issued from : M. Terazaki & M. Wada in Mar. Biol., 1988, 97. [p.179, Fig. 2].
Calanus cristatus : Dorsal view of living copepodite Stage V (right) and caecass (left).
| | | | | Compl. Ref.: | | | Mackas & Sefton, 1982 (p.1173, Table 1); Vidal & Whitledge, 1982 (p.77, respiration v.s. latitude); Dagg & al., 1982 (p.45, abundance, ingestion, respiration, excretion); Dagg & Wyman, 1983 (p.37, natural ingestion rates); Frost & al., 1983 (p.1, feeding behavior); Miller & al., 1984 (p.201, life history); Price & Paffenhöfer, 1985 (p.115, feeding); Bamstedt & Tande, 1985 (p.259, Table 2: literature data respiration & excretion); Vidal & Smith, 1986 (p.523, Table 1, biomass); Smith & Vidal, 1986 (p.215, Table 4, 5, fig.4, population dynamic); Ohman, 1987 (p.1317, Rem.: p.1326, feeding); Greene & Landry, 1988 (p.1069, feeding); Landry & Fagerness, 1988 (p.509, Table (stage 5) 1, 3, 5, 6, fig.1, 6, 8, grazing vs behaviour & morphology); Miller & al., 1988 (p.1, fig.4, Rem.: p.17); Springer & al., 1989 (p.359, Fig.5, 10, 11, Table 1); Coyle & al., 1990 (p.763); Hirakawa & al., 1990 (tab.3); Shih & Marhue, 1991 (tab.3); Hattori, 1991 (tab.1, Appendix); Huntley & Lopez, 1992 (p.201, Table A1, B1, egg-adult weight, temperature-dependent production, growth rate); Dagg, 1993 (p.163, Table 1, 2, 3, figs., abundance, gut pigment); Oh & al., 1993 (p.13, biochemical composition); Tsuda & al., 1993 (p.39, patch distribution); Tsuda, 1995 (p.261, fractal distribution); Kotani & al., 1996 (tab.2); Dower & Mackas, 1996 (p.837, Table 2, seamount effects v.s. abundance); Mauchline, 1998 (p.140, 508: Rem., 524); Suarez-Morales & Gasca, 1998 a (p108); Russell & al., 1999 (p.77, tab.1); Goldblatt & al., 1999 (p.2619, tabl.1, 2, Fig.4); Dolganova & al., 1999 (p.13, tab.1); Mackas & Tsuda, 1999 (p.335, Table 1); Saito & Tsuda, 2000 (p.2141, egg production, development, figs. a-b: egg, nauplius); Rebstock, 2001 (tab.2); Mackas & al., 2001 (p.685, Tab. 3, 6, fig.3: interannual changes in species composition); Rebstock, 2002 (p.71, Table 3, 4, climatic variability); Mackas & Galbraith, 2002 (p.725, tab.2a, 2b); 2002 a (p.423, Table 2); Yamaguchi & al., 2002 (p.1007, tab.1); Yamaguchi & al., 2004 (p. 477, 479, tab.2); Ikeda & al., 2004 (p.1181, metabolism, ETS, C & N composition); Tsuda & al., 2004 (p.10, life history); Park, W al., 2004 (p.464, tab.1); Liu & al., 2005 (p.647 grazing vs microbial food); Ashjian al., 2005 (p.1380: tab.2); Coyle, 2005 (p.77, fig.7, tab.2,4,5); Mackas & al., 2004 (p.875, Table 2); Miller C.B., 2005 (p.219, Rem.); Mackas al., 2005 (p.1011, tab.2, 3); Mackas & Coyle, 2005 (p.707, fig.6); Hopcroft & al., 2005 (p.198, table 2); Ware & McQueen, 2006 (p.28, Table B1, weight ranges); Lavaniegos & Jiménez-Pérez, 2006 (p.148, tab.2, 3, Rem.); Lewis & al., 2006 (p.501, Table I); Deibel & Daly; 2007 (p.271, Table 4, Rem.: Arctic polynyas); Mackas & al., 2007 (p.223, climatic change index); Kirby & al., 2007 (p.97, genetic variation); Humphrey, 2008 (p.84: Appendix A); Wilson S.E. & al., 2008 (p.1636, Rem.: p.1645); Morales-Ramirez & Suarez-Morales, 2008 (p.518); Coyle & al., 2008 (p.1775, Table 3, 4, abundance): Kobari & al., 2008 (p.1648, coppodids I-VI, depth distribution); Takahashi & al., 2008 (p.222, Table 2, grazing impact); Terui & Kishi, 2008 (p.77, population dynamic model); Hopcroft & al., 2009 (p.9, Table 3); Galbraith, 2009 (pers. comm.); Chiba & al., 2009 (p.1846, Table 1, occurrence vs temperature change); Mackas & Beaugrand, 2010 (p.300, figs.13); Lewis & al., 2010 (p.695, Table I); Tatebe & al., 2010 (p.409, Table 1, 2, horizontal transport); Kobari & al., 2010 (p.1703: feeding); Kobari & al., 2010 (p.1715, figs., Table 2, 3, development, growth); Yamaguchi & al., 2010 (p.1679, figs.5, 10, Table 1, population structure); Yamaguchi & al., 2010 (p.1691, figs.2, 6, 10, vertical distribution); Wilson S.E. & al., 2010 (p.1278, Table 3, fatty acids); Machida & Tsuda, 2010 (p.1: gene sequences); Matsuno & Yamaguchi, 2010 (p.123, Rem. p.129); Kosobokova & Hopcroft, 2010 (p.96, Table 1, fig.7); Homma & Yamaguchi, 2010 (p.965, Table 2); Doi & al., 2010 (p.1733, trophic niche); Hidalgo & al., 2010 (p.2089, Table 2); Hopcroft & al., 2010 (p.27, Table 1, 2, fig.9); Bucklin & al., 2010 (p.40, Table 1, Biol mol.); Kosobokova & al., 2011 (p.29, Table 2, Rem.: Arctic Basins); Saito & al., 2011 (p.145, fig.5, abundance); Yamaguchi & al., 2011 (p.13, seasonal variation, life history); Yoshiki & al., 2011 (p.63, egg production, development vs pressure); Batten & Walne, 2011 (p.1643, Table I, abundance vs temperature interannual variability); Homma & al., 2011 (p.29, Table 2, 3, 5, abundance, feeding pattern: suspension feeders); Sato & al., 2011 (p.1230, vertical distribution); Matsuno & al., 2011 (p.1349, Table 1, abundance vs years); Matsuno & al., 2012 (Table 2); Terui & al., 2012 (p.727, population dynamic, model): DiBacco & al., 2012 (p.483, Table S1, ballast water transport); Takenaka & al., 2012 (p.1669, fig.2, 3, Table 1, bioluminescence); Volkov, 2012 (p.474, Table 6, fig.7, 14, abundance, distribution, interannual variation); Chiba & al., 2012 (p.63, temporal variation vs regions); Irvine & Crawford, 2013 (p.1, Rem.: p.59, anomaly time series); in CalCOFI regional list (MDO, Nov. 2013; M. Ohman, comm. pers.); Kobari & al., 2013 (p.78, Table 2); Ohashi & al., 2013 (p.44, Table 1, Rem.); Questel & al., 2013 (p.23, Table 3, interannual abundance & biomass, 2008-2010); Yoshiki & al., 2013 (p.993, interannual variations 2001-2009); Barton & al., 2013 (p.522, Table 1: metabolism, diapause, population dynamic, biogeo); Kobari & al., 2013 (p.97, Table I, DNA, RNA, protein contents vs development & depth); Eisner & al., 2013 (p.87, Table 3: abundance vs water structure); Coyle, 2014 (p.97, table 3, 7, 9, 10, 11, 14); Chiba S. & al., 2015 (p.968, Table 1: length vs. climate); Smoot & Hopcroft, 2016 (p.1, Rem.: p.5: occurrence); Baumgartner & Tarrant, 2017 (p.387, Table 1, diapause); Record & al., 2018 (p.2238, Table 1: diapause); Hirai & al., 2020 (p.1, Fig. 5: cluster analysis (OTU), spatial distribution). | | | | NZ: | 8 | | |
|
Distribution map of Neocalanus cristatus by geographical zones
|
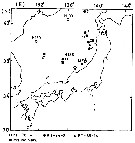
| | | | | | 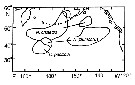 issued from : D.L. Mackas & A. Tsuda in Progress in Oceanography, 1999, 43. [p.353, Fig.9]. issued from : D.L. Mackas & A. Tsuda in Progress in Oceanography, 1999, 43. [p.353, Fig.9].
Regions in which different components of the crustacean zooplankton community are especially dominant, as indexed by the gut contents of planktivorous baleen whales (after Kawamura, 1982). |
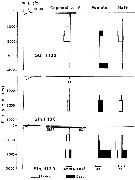
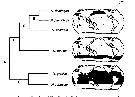 issued from : R.J. Machida, M.U. Miya, M. Nishida & S. Nishida in Mar. Biol., 2006, 148. [p.1077, Fig.4]. issued from : R.J. Machida, M.U. Miya, M. Nishida & S. Nishida in Mar. Biol., 2006, 148. [p.1077, Fig.4].
Relationship between the phylogeny and distribution pattern of the Neocalanus species.
Shaded portions of the maps represent distributions based on the litterature. Clades A-E correspond to those in Fig.3, p.1075. |
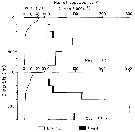
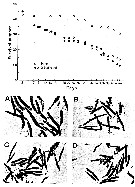 issued from : T. Ikeda in Bull. Fac. Fish. Hokkaido Univ., 1971, 21 (4). [p.283, Figs.1, 2]. issued from : T. Ikeda in Bull. Fac. Fish. Hokkaido Univ., 1971, 21 (4). [p.283, Figs.1, 2].
Above: Survival rate of Calanus cristatus Stage V under fed and starved conditions.
Below: Faecal pellets produced after 1 (A), 15 (B), 25 (C) and 34 (D) days of starvation.
Nota: Animals collected at 50-60°N, 179°W in June. Temperature in the experiment tank rnged from 6.9° to 9.4°C over the first 6 days, but increased from 9.9° to 11.9°C berween the 15th and 36th days.
Just after the starvation had begun yhe animals fed on their own feces. After 15 days of starvation the faecal pellets were more transparent than those seen on the 1st day. With progressive starvation the size of pellets became gradually smaller. However, the pellets became slightly more dense on the 25th and 34th days than those on the 15th day.
Whereas the mortality was almost constant through the whole starvation period, living individuals began feeding on dead specimens only in the later period (necrophagy). The experiments suggest that if this sort of feeding occurs in nature, it would probably occur only in deep water in continuoius darkness.
|
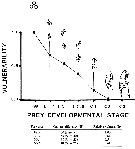 Issued from : C.H. Greene & M.R. Landry in Can. J. Fish. Aquat. Sc., 1988, 45 (6). [p.1072, Fig.1 and Table 3]. Issued from : C.H. Greene & M.R. Landry in Can. J. Fish. Aquat. Sc., 1988, 45 (6). [p.1072, Fig.1 and Table 3].
Fig.2: Vulnerability of the different developmental stages of Calanus pacificus to carnivorous feeding by Neocalanus cristauus from experimental animals captured from the deep waters adjacent to Friday Harbor, the San Juan Archipelago (Washington state).
Bars correspond to 95% confidence intervals.
Table 3: Comparison of the abilities of C. pacificusprey types to escape capture by a simulated feeding current versus their relative vulnerabiliyies to capture by N. cristatus
Capture efficiencies were determined from videotaped observations (N is the number of observations); 100% capture efficiency is assumed for the eggs.
As might be expected0, capture effivciency appears to decrease with increasing naupliar size. |
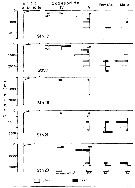
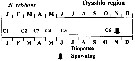 issued from : A. Yamaguchi, K. Ohgi, T. Kobari, G. Padmavati & T. Ikeda in Bull. Fish. Sci. Hokkaido Univ., 2011, 61 (1). [p.18, Fig.5 (part.)] issued from : A. Yamaguchi, K. Ohgi, T. Kobari, G. Padmavati & T. Ikeda in Bull. Fish. Sci. Hokkaido Univ., 2011, 61 (1). [p.18, Fig.5 (part.)]
Schematic diagram showing life cycle timing (mating, spawning, quiescence or diapause) of Neocalanus cristatus, one of five dominant copepods in the Oyashio region, western subarctic Pacific (Site H: 41°30'N-42°30'N, 145°00'E-146°00'E).
Compare with Metridia pacifica, Eucalanus bungii, Neocalanus flemingeri and Neocalanus plumchrus. |
 Issued from : A. Yamaguchi, K. Ohgi, T. Kobari, G. Padmavati & T. Ikeda in Bull. Fish. Sci. Hokkaido Univ., 2011, 61 (1). [p.20, Fig.6 (part.)]. Issued from : A. Yamaguchi, K. Ohgi, T. Kobari, G. Padmavati & T. Ikeda in Bull. Fish. Sci. Hokkaido Univ., 2011, 61 (1). [p.20, Fig.6 (part.)].
Schematic diagram showing life cycle timing (mating, spawning, quiescence or diapause) of Neocalanus cristatus, one of five dominant copepods in the subarctic Pacific (except Oyashio region, western subarctic Pacific (Site H: See Fig.5).
Compare with Metridia pacifica, Eucalanus bungii, Neocalanus flemingeri and Neocalanus plumchrus. |
 Issued from : T. Yoshiki, T. Ono, A. Shimizu & T. Toda in Mar. Ecol. Prog. Ser., 2011, 430. [p.65, Table 1]. Issued from : T. Yoshiki, T. Ono, A. Shimizu & T. Toda in Mar. Ecol. Prog. Ser., 2011, 430. [p.65, Table 1].
Neocalanus cristatus: Spawning interval, clutch size, and egg hatching success as observed in the Oyashio region of the Western Subarctic Pacific in January 2006 and January 2007 and previously by Saito & Tsuda (2000).
d: day; na: data not available.
Compare with N. plumchrus, N. flemingeri. |
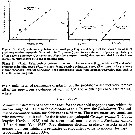
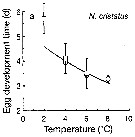 Issued from : T. Yoshiki, T. Ono, A. Shimizu & T. Toda in Mar. Ecol. Prog. Ser., 2011, 430. [p.66, Fig. 1a]. Issued from : T. Yoshiki, T. Ono, A. Shimizu & T. Toda in Mar. Ecol. Prog. Ser., 2011, 430. [p.66, Fig. 1a].
Average (±SEM) egg development times from the Neocalanus cristatus in the Oyashio region of the Western Subarctic Pacific in January 2006 and January 2007 (o) and from Saito & Tsuda (2000) (suare) under atmospheric pressure and different temperatures.
Egg development times significantly descreased with increasing temperature. |
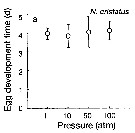 Issued from : T. Yoshiki, T. Ono, A. Shimizu & T. Toda in Mar. Ecol. Prog. Ser., 2011, 430. [p.66, Fig. 2a]. Issued from : T. Yoshiki, T. Ono, A. Shimizu & T. Toda in Mar. Ecol. Prog. Ser., 2011, 430. [p.66, Fig. 2a].
Average (±SEM) egg development time under pressures from 1 to 100 atm at 4°C to Neocalanus cristatus collected in the Oyashio region of the Western Subarctic Pacific in January 2006 and January 2007.
Differences in egg development time between pressure conditions were not statistically significant. |
 Issued from : T. Yoshiki, T. Ono, A. Shimizu & T. Toda in Mar. Ecol. Prog. Ser., 2011, 430. [p.69, Fig.5b]. Issued from : T. Yoshiki, T. Ono, A. Shimizu & T. Toda in Mar. Ecol. Prog. Ser., 2011, 430. [p.69, Fig.5b].
Neocalanus spp. (N. cristaus, N. plumchrus, N. flemingeri) collected in the Oyashio region of the Western Subarctic Pacific in January 2006 and January 2007. Depth ranges experienced during early life stages (from egg to nauplius; dotted line). |
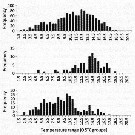 Issued from : S.D. Batten & A.W. Walne in J. Plankton Res., 2011, 33 (11). [p.1647, Fig.3]. Issued from : S.D. Batten & A.W. Walne in J. Plankton Res., 2011, 33 (11). [p.1647, Fig.3].
Frequency distribution of all sample temperatures (top) and an example warm water copepod (Clausocalanus spp.) (centre) and exam^le cold water copepod (Nannocalanus cristatus CV-CVI) (bottom).
CPR sampling from the north-east Pacific (2000 to 2009).
Nota: Recent fluctuations in ocean climate, from the warmest year on record in 2005 to one of the coldest in decades in 2008, provided conditions to observe temperature-related interannual variability.
The abundance and northwards extension of warm water species were significantly positively correlayrd with mean annual temperature and the Pacific Decadal Oscillation.
The cold water species showed no correlations with temperature/PDO within the study region; however if the 4 years of sampling that extended south to 39*N were examined separately, there was a strong relationship between temperature/PDO and the southern extent of subarctic copepods.
Under warm ocean conditions, the range overlap of the two groups will increase as warm water species extend northwards, causing an increase in copepod diversity. Since warm water species are generally smaller and nutritionally poorer, this has implications for higher trophic levels. |
 Issued from : H. Saito & A. Tsuda in Deep-Sea Res. I, 47. [p.2146, Table I]. Issued from : H. Saito & A. Tsuda in Deep-Sea Res. I, 47. [p.2146, Table I].
Egg diameter, carbon and nitrogen contents and prosome length (PL) of females of Neocalanus cristatus from 42°00' N, 145°00' E. (Oyashio region, western subarctic Pacific). In incubators at 2°C and 4°C, also 6°C; salinity: 32.0-33.5 psu.
Nota: Compare with N. plumchrus and N. flemingeri and others species in genus Calanus. |
 Issued from : H. Saito & A. Tsuda in Deep-Sea Res. I, 47. [p.2146, Table 2]. Neocalanus cristatus: Issued from : H. Saito & A. Tsuda in Deep-Sea Res. I, 47. [p.2146, Table 2]. Neocalanus cristatus:
Mean ± 1 S.E. of prosome length (mm), carbon and nitrogen contents (µg), and C:N ratio. Values in parenthesis give the range.
Compare with N. plumchrus and N. flemingeri. |
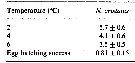 Issued from : H. Saito & A. Tsuda in Deep-Sea Res. I, 47. [p.2149, Table 4]. Neocalanus cristatus: Issued from : H. Saito & A. Tsuda in Deep-Sea Res. I, 47. [p.2149, Table 4]. Neocalanus cristatus:
Egg hatching time (days: mean ± 1 S.E.) at different temperature and egg hatching success (%) of Neocalanus spp.
ND: mean no data.
Compare with N. plumchrus anxd N. flemingeri. Fecundity of N. cristatus was less than half that of the other species. Egg hatching success was similar between species. This could indicate a lower mortality rate of N. cristatus compared to the other two species, at least in some stages . If nauplii of N. plumchrus and N. flemingeri require feeding for growth to CI (as do Calanus), the non-feeding naupliar stages could have lower mortality rates.. Also, the deeper distribution at copepodid stagess of N. cristatus than the other two species, could allow lower mortality bay visual predators Although larger copepods are more conspicuous to visual predators, strong swimming ability resulting from their large size is advantageous for escape Their longer antennules with mechano- and chemoreceptors make it possible to detect more quickly predators.
If the relative developmental time between CI and CV (CI-CV) to hatching-CI was similar to Calanus developmental days from CI to CV can be estimated to be 72 days at 2°C and 44 days at 6°C. [Corkett & al., 1986 showed that the equiproportional rule of development was appropriate for C, and relative times of reaching various stages between hatching and moulting to CI were similar among species. Relative time of egg hatching to CI of N. cristatus, 0.09-0.011, also compares well with the reported values for Calanus spp.]
The estimated developmental time between CI-CV in the present study is comparable to the previous observation in the Bering Sea, where the mean duration of each copepodid stage was estimated to be 20 days at 0.5-6°C (Vidal & Smith, 1986). Kobari & Ikeda (1999) estimated the developmental time from spawning to CI and spawning to CV in the Oyashio region to be 2 months and 6 months, respectively, by tracing peak abundance of each developmental stage. Their estimate of duration in naupliar stages was only slightly longer than in authors observation at 2°C. On the other hand, the duration between CI and CV was much longer than the authors' estimate. This result suggests a possible growth delay due to food limitation in the Oyashio region (Huntley & Boyd, 1984). However, it should be noted that the estimates of stage duration by cohort analysis are problematicd, aznd can be overestimated if mortality increases with stage development (Miller, 1993). |
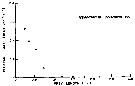
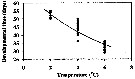 Issued from : H. Saito & A. Tsuda in Deep-Sea Res. I, 47. [p.2150, Fig. 4]. Neocalanus cristatus developed to CI without feeding.: Issued from : H. Saito & A. Tsuda in Deep-Sea Res. I, 47. [p.2150, Fig. 4]. Neocalanus cristatus developed to CI without feeding.:
Bélehràdek's temperature functions for developmental time (days) from hatching to copepodite stage I (Dci: days) was described . by Bélehràdek equation: Dci = 17068 x (T + 14.7) exp -2.05, where T indicate temperature (°C)
Nota: The developmental times from hatching to CI in the figure 4. The Q10 of the developmental time was 3.4 between 2 and 6°C. |
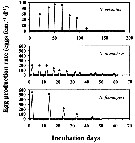 Issued from : H. Saito & A. Tsuda in Deep-Sea Res. I, 47. [p.2147, Fig. 3]. Issued from : H. Saito & A. Tsuda in Deep-Sea Res. I, 47. [p.2147, Fig. 3].
Typical egg laying pattern comparison between Neocalanus cristatus (top), N. plumchrus (middle) and N. flemingeri (bottom).
Open circles mean the day of death.
Nota: Females of N. cristatus laid 4-110 eggs at 7-20 day intervals. The authors calculated mean clutch size and the spawning interval excluding the last two clutches as they were considerably smaller than those earlier in the spawning period, often less than 10 eggs per clutch, and the interval between the last two clutches was usually longer than between previous clutches. The mean duration of the interval decreased with increasing temperature; means ± 1 S.E. were 14.7 ± 2.8 days at 2°C, 11.0 ± 1.5 days at 4°C and 8.0 ± 1.0 days at 6°C. No apparent effect of temperature on clutch size was observed, and the mean ± 1 S.E. was 76 ± 19.3 eggs per clutch. The maximum clutch number was 7, and the maximum fecondity was 521 eggs per female.
Mean fecundity of females that produced more than 5 clutches was 386 ± 116 eggs per female. This means that a female released 2057 µg C and 197 µg N in the form of eggs (based on mean carbon and nitrogen contents of an egg, see in Table 1).
Egg laying periods, calculated from the mean interval and the maximum clutch number, were 91 days at 2°C, 37 days at 4°C and 49 days at 6°C.
After the final egg laying, spent females of N. plumchrus and N. flemingeri were alive for 6-35 days. Spent N. cristatus stayed alive up to 115 days.
Eggs of subarctic Neocalanus are spawned at depth (500-2000 m), and nauplii migrate to the surface layer (Miller & al., 1984; Miller & Nielsen, 1988; Kobari & Ikeda, 1999). Unlike the surface layer, the annual or seasonal change in temperature in the spawning layer and naupliar habitat are small, and temperature influences on their developmental duration may be negligible (Mackas & al., 1998). However, the temperature differences of these layers between oceanic Pacific (1.8-4.0°C) and its adjacent seas, i.e., Japan Sea (0.0-0.6°C), Okhotsk Sea (1.5-2.3°C; Kawasaki, pers. comm.), Bering Sea (2.0-3.5°C), Strait of Georgia (7-9°C), are large enough to influence the spawning duration of individual females and the development of nauplii. Temperature during the egg laying period and early development may be one of the important factors generating the regional differences in the life histories. of Neocalanus (Miller & Nielsen, 1988; Miller & Terazaki, 1989; Kobari & Ikeda, 1999; Tsuda & al., 1999). |
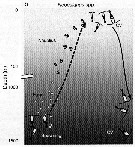
 Issued from : M. Terazaki & M. Wada in Mar. Biol., 1988, 97. [p.179, Fig. 3]. Issued from : M. Terazaki & M. Wada in Mar. Biol., 1988, 97. [p.179, Fig. 3].
Calanus cristatus. Vertical distribution with water temperature profiles at Stns. H 133, H 136 and H 139 during the KH-70-4 Cruise. |
 Issued from : M. Terazaki & M. Wada in Mar. Biol., 1988, 97. [p.178, Fig. 1]. Issued from : M. Terazaki & M. Wada in Mar. Biol., 1988, 97. [p.178, Fig. 1].
Calanus cristatus. Sampling stations of carcasses in the Japan Sea.
A sampling array with five sediment traps was deployed to collect carcasses at Stn. 12.
KH-70-4:H 133, 136, 139, August 2-21, 1970; KH-84-3 and 85-14, September 1984, 1985; MZ-84-1, to 85-18, March-October 1984,MZ 85-2, 85-6, April-May 1985; MZ85-18, December 14, 1985. April 1985
Nota: Calanus cristatus (= Neocalanus cristatus) is a major large calanoid living in Subarctic waters. This herbivorous species has been reported from various regions in the Japan Sea.
Individual of this species performed ontogenic vertical migration during their life cycle (see Heinrich, 1957; Sekiguchi, 1975), and C5 which have a life span of about seven months have been reported to occur as deep as 1600 m, 2000 m and above 3850 m.
In the North Pacific , the reproduction of this species occurs in winter and there is one brood a year. The new brood reaches the C1 and C2 stages by the beginning of the period of phytoplankton bloom; these stages rapidly grow to C5. C5 store large amounts of fat and then begin to sink to the deeper layers in late summer. After they moult to adults, the masticatory edges of the mandibles degenerate and they no longer ingest any food (Henrich, 1962).
A well developed thermocline was detected at all stations. According to Morioka (1973), the temperature at which this species were captured as lower than 10°C in the Japan Sea. No individuals was collectede from the surface layer because of temperature above 15°C. The 10°C isotherm deepened southward. For example, it was 15 m at Stn H 133, 25 m at Stn 139, and 100 m at Stn H 136. Living males and females occurred in the bathypelagic layer. The results thus indicate that it seems that the peincipal zone of spawning is below 1000 m.
The occurrence of carcasses of this species in the Japan Sea showed two peaks, from thermocline to 200 m and below 1000 m, and the smallest number of carcasses was collected from the mesopelagic layer. The shallow peak consisted of copepodite Stages C2-C5, and adults composed the deep peak. Bacterial attachment was observed by SEM, which may be chitinoclastic.. |
 Issued from : M. Terazaki & M. Wada in Mar. Biol., 1988, 97. [p.180, Fig. 4]. Issued from : M. Terazaki & M. Wada in Mar. Biol., 1988, 97. [p.180, Fig. 4].
Calanus cristatus. Vertical distribution with water temperature profiles at Stns.7, 11, 16, 21 and 29 during the KH-84-3 Cruise. |
 Issued from : M. Terazaki & M. Wada in Mar. Biol., 1988, 97. [p.180, Fig. 5]. Issued from : M. Terazaki & M. Wada in Mar. Biol., 1988, 97. [p.180, Fig. 5].
Calanus cristatus. Vertical distribution with water temperature profiles at Stn. B1 and H 139 during the KT-85-14 Cruise. |
 Issued from : M. Terazaki & M. Wada in Mar. Biol., 1988, 97. [p.181, Fig. 6]. Issued from : M. Terazaki & M. Wada in Mar. Biol., 1988, 97. [p.181, Fig. 6].
Calanus cristatus. Vertical distribution of copepodite Stage V with water temperature profiles at Stn. MZ on May 1994 and October 1985. |
 Issued from : M. Terazaki & M. Wada in Mar. Biol., 1988, 97. [p.181, Fig. 7]. Issued from : M. Terazaki & M. Wada in Mar. Biol., 1988, 97. [p.181, Fig. 7].
Calanus cristatus. Vertical variation of mean wet weight (mg) of living individuals and carcasses at Stn. 11. |
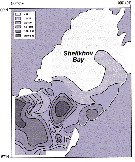 Issued from : A.I. Pinvhuk & A.J. Paul in Univ. Alaska Sea Grant College Progr., 2000. [p.20, Fig.20]. Issued from : A.I. Pinvhuk & A.J. Paul in Univ. Alaska Sea Grant College Progr., 2000. [p.20, Fig.20].
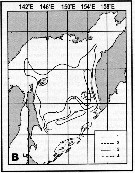
Distribution of Calanus cristatus biomass (mg.m3) in the 0-50 m layer in Shelikhov Bay during June 1963. (from Kotlyar, 1965). |
 Issued from : A.I. Pinvhuk & A.J. Paul in Univ. Alaska Sea Grant College Progr., 2000. [p.30, Fig.35B]. Issued from : A.I. Pinvhuk & A.J. Paul in Univ. Alaska Sea Grant College Progr., 2000. [p.30, Fig.35B].
Distribution of Neocalanus cristatus biomass (mg.m3) in the 0-100 m layer in the Okhotsk Sea.
1: September-October 1652; 2: June-July 1951; 3: June-July 1650; 4: August-September 1949. (from Lubny-Gertsik, 1959). |
 Issued from : M.R. Landry & V.L. Fagerness in Bull. Mar. Sc., 1988, 43 (3) [p.512, Fig.1]. Issued from : M.R. Landry & V.L. Fagerness in Bull. Mar. Sc., 1988, 43 (3) [p.512, Fig.1].
Clearance rates of Neocalanus cristatus stage 5 feeding on naupliar (closed symbols) and copepodid stages (open symbols).
Data from Greene & Landry (1988). |
 Issued from : M.R. Landry & V.L. Fagerness in Bull. Mar. Sc., 1988, 43 (3) [p.514, Table 3]. Issued from : M.R. Landry & V.L. Fagerness in Bull. Mar. Sc., 1988, 43 (3) [p.514, Table 3].
Comparison of size of body and appendages for seven species of marine copepods. Relationships among predation rates, selection patterns, swimming speed and orientation, and morphology of prey sensory and capture appendages. |
 Issued from : M.R. Landry & V.L. Fagerness in Bull. Mar. Sc., 1988, 43 (3) [p.519, Fig. 8]. Issued from : M.R. Landry & V.L. Fagerness in Bull. Mar. Sc., 1988, 43 (3) [p.519, Fig. 8].
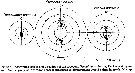
Swimming speeds and directions of the copepods Neocalanus cristatus, Euchaeta elongata (= Paraeuchaeta elongata), Calanus pacificus. See also to Tortanus discaudatus, Corycaeus anglicus, Oithona spinifera (= Oithona setigera).
Swimming speeds measured as displacement over 2-s time intervals. 0° is up.
Study of the relationships among predation rates, selection patterns, swimming speed and orientation, and morphology of prey sensory and capture appendages.
The mean relative swimming speeds (S) of the predatory copepods and their preferred prey were calculated by the equation (Gerritsen, 1980).
S = [u + v)3 - [u - v)3 / 6uv.
u and v are respectively, the mean swimming speeds (mm/s) of the prey and the predator. |
 Issued from : M.R. Landry & V.L. Fagerness in Bull. Mar. Sc., 1988, 43 (3) [p.522-523, Table 5]. Issued from : M.R. Landry & V.L. Fagerness in Bull. Mar. Sc., 1988, 43 (3) [p.522-523, Table 5].
Comparison of the predatory characteristics of seven planktonic marine copepods.
F max is the mean, maximum clearance rate measured for the predator feeding on its preferred prey. Prey are developmental stages of common species of planktonic copepods.
F = female, M = male, C5 = stage 5. |
 Issued from : M.R. Landry & V.L. Fagerness in Bull. Mar. Sc., 1988, 43 (3) [p.524, Figs.10-11]. Issued from : M.R. Landry & V.L. Fagerness in Bull. Mar. Sc., 1988, 43 (3) [p.524, Figs.10-11].
Fig. 10: Relationship between optimal prey length and length of the second maxillae (Mx2) of predatory marine copepods.
Fig 11: Relationships between maximum clearance rate (F max = liters/day) and mean predator swimming speed (S = mm/s) for predatory marine copepods. |
 Issued from : M.R. Landry & V.L. Fagerness in Bull. Mar. Sc., 1988, 43 (3) [p.525, Table 6]. Issued from : M.R. Landry & V.L. Fagerness in Bull. Mar. Sc., 1988, 43 (3) [p.525, Table 6].
Relationships between swimming speeds of predators and their preferred prey and ratios of maximum clearance rates for seven species of marine copepods. |
| | | | Loc: | | | China Seas (East China Sea), S Korea, Japan Sea, Japan (Sagami Bay), Hokkaido, off Hokkaido (SE, NE, Oyashio region, Station 'H' (41°30'N, 145°50'E), Kuroshio extension), ''Station A'' (± 45°.5N, 165°E), Station K2 (47°N, 160°E), E Kuril-Kamchatka, S Okhotsk Sea, Bering Sea, off Unimak Is., Chukchi Sea, off NW Alaska, Canada Basin, Beaufort Sea, St Lawrence Island, Bering Sea, Anadyr Strait, S Aleutian Basin, S Aleutian Is., G. of Alaska, Station "P", Cobb Seamount, British Columbia, Prince William Sound, Hecate Strait, Vancouver Is., N Pacif. (central), Oregon (off Newport), off California, W Baja California, W Costa Rica, Galapagos (in C. B. Wilson, 1950); Chile (N) | | | | N: | 154 | | | | Lg.: | | | (22) F: 10,4-8,6; M: 9,6-9; (70) F: 9,9-7,6; M: 9,1-6,7; (129) F: 9,3-8,4; M: 8,6-7,4; (131) F: 10,4-7,6; M: 9,6-6,7; (208) F: 9-7,9; M: 8,7; (1232) F: 8,6-10,4; M: 9,0-9,6; {F: 7,60-10,40; M: 6,70-9,60}
Chiba S. & al., 2015 (p.971, Table 1: Total length female (June-July) = 8.9 mm [optimal SST (°C) = 6.4].
(1259: stage 5): 8,3 (total length), 7,0 (prosome length); A1 = 9,0 mm. (total length).
| | | | Rem.: | epi-bathypelagic.
References generally as Calanus cristatus.
After Marshall & Orr (1972, p.8) the coxa of P5 is smooth on the internal margin. The head in the frontal region is produced in a crest that projects forward. There are no internal setae on the endopods of P1 to P4.
For Kosobokova & al. (2011, iTable 3) Neocalanus cristatus is an expatriate species from Pacific to the Arctic Ocean Basins, because the reproduction is not assumed in polar waters.
Occurrence in the northern Chilean waters by Hidalgo & al. (2010).
For Heinrich (1962, p.465) the species is a common herbivorous copepod in the western region of the Bering Sea.
For Beklemishev (1954 a) the adult females do not feed, and after Vyshkvartzeva (1976) the species differs from all members of the Calanidae in this atrophy of female mouthparts.
Ohtsuka & Nishida (2017, p.578) point to a unique phenomenon is the submergence of the Oyashio Current in Sagami Bay, where the Kuroshio is prevalent in the upper layer, and is characterized by the occurrence of deep populations of the cold-water pecies N. cristaus (see Omori, 1967; Oh & al., 1991). | | | Last update : 05/11/2021 | |
|
|
 Any use of this site for a publication will be mentioned with the following reference : Any use of this site for a publication will be mentioned with the following reference :
Razouls C., Desreumaux N., Kouwenberg J. and de Bovée F., 2005-2025. - Biodiversity of Marine Planktonic Copepods (morphology, geographical distribution and biological data). Sorbonne University, CNRS. Available at http://copepodes.obs-banyuls.fr/en [Accessed August 27, 2025] © copyright 2005-2025 Sorbonne University, CNRS
|
|
|
|


;)
;)
;)
;)
;)
;)
;)
;)
;)
;)
;)
;)
;)
;)
;)

;)
;)
;)
;)
;)
;)
;)
;)
;)
;)
;)
;)
;)
;)
;)
;)
;)
;)
;)
;)
;)
