|
|
 |
|
Calanoida ( Order ) |
|
|
|
Diaptomoidea ( Superfamily ) |
|
|
|
Centropagidae ( Family ) |
|
|
|
Centropages ( Genus ) |
|
|
| |
Centropages hamatus (Lilljeborg, 1853) (F,M) | |
| | | | | | | Syn.: | Ichthyophorba hamata Lilljeborg, 1853;
Ichthyophorba angustata Claus, 1863 (p.199) | | | | Ref.: | | | Brady, 1878 (p.67, figs.M); Giesbrecht, 1892 (p.304, 320, figs.F,M); Giesbrecht & Schmeil, 1898 (p.56); Wheeler, 1901 (p.174, figs.F,M, Rem.); Sars, 1902 (1903) (p.76, figs.F,M); Farran, 1908 b (p.59); Lysholm, 1913 (p.6); Pesta, 1920 (p.521); Sars, 1925 (p.206); Rose, 1929 (p.31); Gurney, 1931 a (p.89, figs.F,M, N); Wilson, 1932 a (p.89, figs.F,M); Rose, 1933 a (p.185, figs.F,M); Jespersen, 1934 (p.103); 1940 (p.49); Massuti Alzamora, 1942 (p.92, fig.F, Rem.); Sewell, 1948 (p.367); Farran, 1948 (n°11, p.3, figs.F,M); Anraku & Omori, 1963 (p.118, figs. mouth parts); Vilela, 1965 (p.8); Marques, 1966 (p.7); Faber, 1966 (p.191, fig.N); Koga, 1968 (p.17, fig.: egg); Shih & al., 1971 (p.37); Lee, 1972 (p.6, figs.F,M, spermatophore and coupling device, P6 male biometry, Text-fig.13); Fleminger, 1975 (p.397); Klein Breteler, 1982 (p.5, figs.); Schnack, 1982 (p.89, figs. Mx2, Md, Mxp); Sazhina, 1985 (p.61, figs.N); Soler & al., 1988 (p.143, Rem.); Chen & Marcus, 1997 (p.587, Rem: egg); G. Harding, 2004 (p.12, 35, figs.F, M); Conway, 2006 (p.14, 25, copepodite stages 1-6, Rem.); Vives & Shmeleva, 2007 (p.470, figs.F,M, Rem.); Michels & al., 2012 (p.1, figs.1, 2, 3, Rem.: Md structure); Laakmann & al., 2013 (p.862, figs.1, 2, 3, 5, Table 1, 2, 3, mol. Biol.) ; Prusova & al., 2019 (p.525, Table3) | 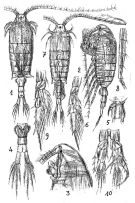 issued from : Sars G.O. in An Account of the Crustacea with short descriptions and figures of all the species. Vol. IV. Copepoda Calanoida. Publ. by The Bergen Museum, 1902 (1903). [Pl. LII]. Female: 1-2, habitus (dorsal and lateral, respectively); 3, head (lateral); 4, urosome (ventral); 5, genital segment (lateral); 6,P5. Male: 7, habitus (dorsal); 8, geniculattion of rifght A1; 9, P4; 10, P5.
|
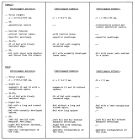 issued from : Soler Torres E., Del Rio J.G. & Vives F. in Crustaceana, 1988, 55, 2: 143. Main morphological differences between C. ponticus Karavaev, C. hamatus Lilljeborg and C. kroyeri Giesbrecht (-- no distinct differences with C. ponticus, St: terminal seta).
|
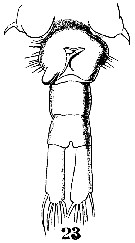 Issued from : W. Giesbrecht in Systematik und Faunistik der Pelagischen Copepoden des Golfes von Neapel und der angrenzenden Meeres-Abschnitte. Fauna Flora Golf. Neapel, 1892, 19 , Atlas von 54 Tafeln. [Taf.38, Fig.23]. Female: 23, urosome (ventral).
|
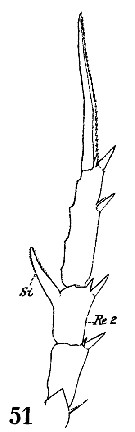 Issued from : W. Giesbrecht in Systematik und Faunistik der Pelagischen Copepoden des Golfes von Neapel und der angrenzenden Meeres-Abschnitte. Fauna Flora Golf. Neapel, 1892, 19 , Atlas von 54 Tafeln. [Taf.17, Fig.51]. Female: 51, exopod of P5.
|
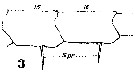 Issued from : W. Giesbrecht in Systematik und Faunistik der Pelagischen Copepoden des Golfes von Neapel und der angrenzenden Meeres-Abschnitte. Fauna Flora Golf. Neapel, 1892, 19 , Atlas von 54 Tafeln. [Taf.18, Fig.3]. Male; 3, right A1 (segments 15 and 16).
|
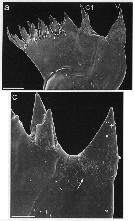 issued from : J. Michels, J. Vogt & S.N. Gorb in Scientific Reports, 2012. [p.2, Fig.1 a, c]. Scanning electron micrographs of mandibular gnathobases female (from Helgoland, North Sea): a, overview of a whole gnathobase (V = ventral tooth; C1 = central tooth); c, overview of the ventral part of the distal gnathobase structures (arrow indicates area with a large number of scratches). Scale bars: 0.020 mm (a); 0.005 mm (c). After the authors, the two larger teeth at the ventral side of the gnathobase seem to be very suitable for grabbing larger food items such a large centric diatoms and for exerting punctiform pressure when crushing and mincing their frustules. This assumption is supported by the frequent presence of numerous scratches at the diastema, which mainly consists of chitinous material. The inclusion of silica in the tips of these larger teeth very likely enhances their hardness and stiffness. When the copepods feed on nanoflagellates and chlorophytes, the smaller gnathobase teeth likely are more suitable for grabbing the food particles than the larger ones. The compliant resilin in the tips of these teeth may increase the grip of the teeth due to the formation, of a larger contact area at the same applied load. The cotact area and with it the grip of the smaller teeth is probably further increased by the presence of two relatively small tips. The present study reveals the existence of complex composite structures likely increase the efficiency of the opal teeth while simultaneously reducing the risk of mechanical damage. They are supposed to have coevolved with rthe diatom shells in the evolutionary arms race, and their development might have been the basis for the dominance of the copepods today's marine zooplankton.
|
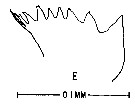 issued from : M. Anraku & M. Omori in Limnol. Oceanogr., 1963, 8. [p.122, Fig. 7, E] Centropages hamatus (from Woods Hole): Cutting edge of Md. Nota: The cutting edge is provided with 8 teeth and 1 marginal spine on its innermost border. Since there are no small processes on the teeth, the chewing parts are on the whole sharper than in Calanus.
|
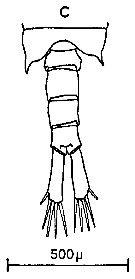
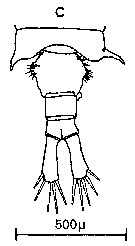 Issued from : C.M. Lee in Bull. mar. Ecol., 1972, 8. [p.4, Text-Fig. 1 c]. Dorsal view of the fifth metasome segment and the urosome of female of Centropages hamatus (from Millport, Scottish west coast)
|
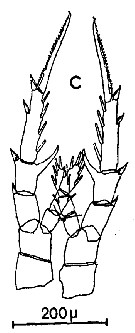 Issued from : C.M. Lee in Bull. mar. Ecol., 1972, 8. [p.5, Text-Fig. 2 c]. P5 female of Centropages hamatus.
|
 Issued from : C.M. Lee in Bull. mar. Ecol., 1972, 8. [p.4, Text-Fig. 1 c]. Dorsal view of the fifth metasome segment and the urosome of male of Centropages hamatus (from Millport, Scottish west coast)
|
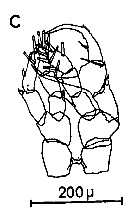 Issued from : C.M. Lee in Bull. mar. Ecol., 1972, 8. [p.5, Text-Fig. 2 c]. P5 male of Centropages hamatus.
|
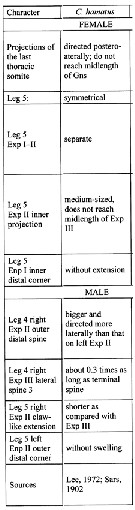 Issued from : I.Yu Prusova, E.A. Galagovets & E.V. Popova in Arthropoda Selecta, 2019, 28 (4). [p.525, Table 3]. Centropages hamatus: Characters for distinguishing between species of the hamatus group of the genus Centropages. Compare with the species C. abdominalis, C. kroyeri, C. ponticus, and C. tenuiremis.
| | | | | Compl. Ref.: | | | Gadeau de Kerville, 1894 (p.81); Mrazek, 1902 (p.515), Pearson, 1906 (p.22, Rem.); Sars, 1909 b (p.17); Rose, 1924 d (p.478); 1925 a (p.8); Wilson, 1932 (p.22); 1942 a (part., p.177); Jespersen, 1939 (p.68, Rem.); Fleury, 1950 (p.47, fig.2); Hansen K.V., 1951 (p.231, migration vs. discontinuity layer); Raymont & Gauld, 1951 (p.681, respiratory rate); Gauld & Raymont, 1953 (p.447, Table II, IV, fig.2, respiration); Grice, 1956 (p.53); Deevey, 1956 (p.127, tab. IV); Gauld, 1957 (p.510, copulation); Conover, 1959 (p.259, Table 1, 2, respiration); Deevey, 1960 (p.5, Table II, fig.7, 8, 11, 12: annual abundance, Rem.: p.22, fig.18, 19) ; 1962 a (p.181, Table II, C composition); H. Schulz, 1961 (p.57); Marshall & Orr, 1962 (tab.1, 3); Curl, 1962 (p.183, Table I, CNP composition); Grice & Hart, 1962 (p.287, 295: Rem.); Gaudy, 1962 (p.93, 99, Rem.: p.109); Lacroix & Bergeron, 1963 (p.59, Tableau III, IV); Anraku, 1964 a (p.221, grazing, predation); 1964 b (p.195, table 1: respiration vs. salinity); Martin, 1965 (p.188); Lance, 1965 (p.155, Table 2: osmotic pressure); Bodo & al., 1965 (p.219, annual cycle); Marshall & Orr, 1966 (p.513, 521, fig.I, 2, Table 2, 3, 4, 7, feeding, respiration); Faber, 1966 a (p.419, 421); Mazza, 1966 (p.71); Dawson, 1966 (p.176); Pertsova, 1967 (p.240); Matthews, 1967 (p.159, Table 1, Rem.); Maclellan D.C., 1967 (p.101, 102: occurrence); Evans, 1968 (p.12); Singarajah, 1969 (p.171, Table II, behaviour); Champalbert, 1969 a (p.620); Itoh, 1970 a (p.8: tab.2); Paulmier, 1971 (p.168); Martens, 1972 (p.22, fecal pellets); Bainbridge & Forsyth, 1972 (p.21, Table I: indictor species, Table II: correlation analysis, Text-fig.7: annual fluctuations Pl. XVI: seasonal abundance); Ibanez & Seguin, 1972 (p.81, annual cycle, multivarite analysis); Lefèvre-Lehoërff, 1972 (p.1681); Arndt & Heidecke, 1973 (p.599, 603, fig.3); Eriksson, 1973 (p.37, fig. 14-17, annual cycle); 1973 b (p.113, 117); Desgouille, 1973 (p.1, 131, Rem.: p.138, 139, 141); Pertzova, 1974 (p.1013, life cycle); Person-Le Ruyet, 1975 (p.203, rearing); Le Ruyet-Person & al., 1975 (p.283, comparative biology, metabolism activity); Hecq, 1976 (p.443, abundance annual cycle); Falconetti & Seguin, 1977 (p.188); ? Carter, 1977 (1978) (p.36); Beers & al., 1977 (p.66, Rem.: p.77, Cu pollution); McLaren, 1978 (p.1330, 1336: life history); Hernroth, 1978 (p.1, Rem.: p.5); Lefèvre-Lehoërff & Quintin, 1979 (p.71, abundance- length-temperature); Herman & Dauphinee, 1980 (p.79, Table 2, length-biovolum); Vaissière & Séguin, 1980 (p.23, tab.1); Grice & Marcus, 1981 (p.125, Dormant eggs, Rem.: p.134); Gallo, 1981 (p.847); Collins & Williams, 1981 (p.273, monthly distribution-salinity); Citarella, 1982 (p.791, 798: listing, frequency, fig.5, Tableau II, V); Kovalev & Shmeleva, 1982 (p.84); Klein Breteler & Gonzalez, 1982 (p.157, body length/food); Klein Breteler & al., 1982 (p.195, growth & development); Kiørboe & al., 1982 (p.181, ingestion rate & gut clearance); Vives, 1982 (p.293); Chojnacki & Hussein, 1983 (p.53, Table 4, length-weight); Jacoby & Youngbluth, 1983 (p.84, Table 4, Rem: mating); Hernroth, 1983 (p.835,, Rem.: p.840); Cowles, 1983 (p.53, swimming activity vs. pollution); Cowles & Remillard, 1983 (p.45, polluant effects); Tremblay & Anderson, 1984 (p.4); Baars & Fransz, 1984 (p.120, Table 1, grazing); Baars & Oosterhuis, 1984 (p.97, diurnal feeding rhythms); Fransz & al., 1984 (p.86); Brylinski, 1984 a (p.91, length/temperature); Sameoto, 1984 (p.767, vertical migration); Lefèvre-Lehoërff & al., 1984 (p.131, annual variations); Drebes, 1984 (p.619: parasite); Musayeva, 1985 (tab.1); Williams & Collins, 1985 (p.28); Conley & Turner, 1985 (p.113, omnivory nutrition); Hargrave & al., 1985 (p.221, annual abundance); Brylinski, 1986 (p.457, spatial variations); Harding & al., 1986 (p.952, Table 1, 2, 3, 4, 5, 6, fig.3, diel vertical movements); Mikhailovsky, 1986 (p.83, Table 1, ecological modelling); Quisthoudt & al., 1987 (p.995, spatial distribution); Vuorinen & Ranta, 1987 (tab.2, 4); Tiselius, 1988 (p.215, grazing); Aksnes & Magnesen, 1988 (p.57, population dynamic, production); Daan & al., 1988 (p.45, Table 4, carnivorous behaviour); Lozano Soldevilla & al., 1988 (p.59); Marcus, 1989 (p.142, benthic diapause egg); Lindley & Hunt, 1989 (p.407, gepgraphic distribution abundance); Citarella, 1989 (p.123, abundance); Tiselius, 1989 (p.49, feeding); Klein Breteler & al., 1990 (p.177, Table IV: generation vs body length); Tackx & al., 1990 (p.405, grazing); Lindley, 1990 (p.209, Table 2, 3, 4, 5, 6, eggs/sediment); Tiselius & Jonsson, 1990 (p.23, table 1-4, feeding behaviour); Lampitt & al., 1990 (p.15, faecal pellets, coprorhexy); Marrasé & al., 1990 (p.1653, feeding vs. turbulent current); Costello & al., 1990 (p.1648, Grazing vs turbulence environment); Naess, 1991 (p.266, fig.7, resting egg); Nielsen, 1991 (p.1091, egg production); Voss, 1991 (p.217, faecal pellts); Tiselius & al., 1991 (p.445, egg production); Noji & al., 1991 (p.465, fig.8, faecal pellet); Fryd & al., 1991 (p.683, development, growth, egg production); Naas & al., 1991 (p.161, natural production in mesocosm ecosystem); Huntley & Lopez, 1992 (p.201, Table A1, egg-adult weight, temperature-dependent production); Norrbin, 1992 (p.6); Viitasalo, 1992 (tab.2); Seguin & al., 1993 (p.23); Hwang & al., 1993 (p.277, swimming behavior); Hwang & Strickler, 1994 (p.117, behaviour); Vinogradov & al., 1994 (tab.1); Sautour, 1994 (p.113, grazing); Hays & al., 1994 (tab.1); Marcus & Lutz, 1994 (p.83, hatching success vs anoxia); Snell & Carmona, 1994 (p.255); Krause & al., 1995 (p.81, Rem.: p.142); Lefèvre-Lehoërff & al., 1995 (p.269, annual hydroclimatic variations); Madhupratap & al., 1996 (p.77, Table 2: resting eggs); Marcus, 1996 (p.143, resting eggs); Marcus & al., 1997 (p.291, hatching success vs. anoxia); Hays & al., 1996 (p.159, Rem.: Herring correlation); Falkenhaug & al., 1997 (p.449, spatio-temporal pattern); Ban S, Burns C. & al., 1997 (p.287, Table1, 2, feeding, reproduction); Hure & Krsinic, 1998 (p.53, 101); Tang & al., 1998 (p.1971); Mauchline, 1998 (tab.16, 21, 26, 33, 40, 45,51, 58, 61, 63, 64); Gilabert & Moreno, 1998 (tab.1, 2); Suarez-Morales & Gasca, 1998 a (p109); Titelmann & Tiselius, 1998 (343, table 1, 2, 3); Reid & Hunt, 1998 (p.310, figs.2, 3, Rem.); B.W. Hansen & al., 1999 (p.233, seasonal abundance & biomass); Harvey & al., 1999 (p.1, 49: Appendix 5, in ballast water vessel); Sautour & al., 2000 (p.531, Table II, abundance); Pepin & Maillet, 2000 (p.1, Rem.: p.101, table 2, interannual variations); Dippner 1 al., 2000 (p.23, long-term variability vs. climate); Harvey & al., 2001 (p.481); d'Elbée, 2001 (tabl. 1); Musaeva & Suntsov, 2001 (p.511, tab.1); Holmes, 2001 (p.21, Rem.); Halsband & Hirche, 2001 (p.219, annual reproduction cycle); Fransz & Gonzalez, 2001 (p.255, tab.1); Sameoto & al., 2002 (p.12); Beaugrand & al., 2002 (p.179, figs.5, 6); Halsband-Lenk & al., 2004 (p.709, figs.6,7); Gislason & Astthorsson, 2004 (p.472, tab.1); CPR, 2004 (p.52, fig.147); Vallet & Dauvin, 2004 (p.539, tab.2); Manning & Bucklin, 2005 (p.233, Table 1, fig.12); Marques & al., 2006 (p.297, tab.III); Durbin & Casas, 2006 (p.2537, Table 2a, 2b); Bonnet & al., 2007 (p.233); Sørensen & al., 2007 (p.84, Rem.: eggs); Gaudy & Thibault-Botha, 2007 (p.84, Tab.2, Rem.: metabolism); Wesche & al., 2007 (p.1309); Schulz J. & al., 2007 (p.47, vertical zonation analysis); Alcaraz & al., 2007 (p.121); Chojnacki & al., 2007 (p.46, Table 2); Head & Sameoto, 2007 (p.2686, abundance vs interdecadal variability); Durbin & Kane, 2007 (p.249, Rem.); Valdés & al., 2007 (p.104: tab.1); Goetze, 2008 (p.433: mating); Teegarden & al., 2008 (p.33, Rem.: feeding and toxicity); Gaard & al., 2008 (p.59, Table 1, N Mid-Atlantic Ridge); Harvey & Devine, 2009 (Table 5); Brylinski, 2009 (p.253: Tab.1, p.255: Rem.); Moison & al., 2009 (p.388, Rem.: p.394, behaviour); Martynova & al., 2009 (p.133, C/N contents, length, starvation experiments); Telesh & al., 2009 (p.16, fig.2.1, p.18: Table 2.1); Saage & al., 2009 (p.16, feeding experiments); Calliari & Tiselius, 2009 (p.111); Dvoretsky & Dvoretsky, 2009 a (p.11, Table 2, abundance); Ji & al., 2009 (p.187, life history, spatiotemporal distribution); Eloire & al., 2010 (p.657, Table II, temporal variability); Drira & al., 2010 (p.145, Tanl.2); Mazzocchi & Di Capua, 2010 (p.424); Dvoretsky & Dvoretsky, 2010 (p.991, Table 2); Yen & Lasley, 2010 (p.177, Rem.: p.183, mating): S.C. Marques & al., 2011 (p.59, Table 1); Martynova & al., 2011 (p.1175, seasonal abundance, feeding); Pepin & al., 2011 (p.273, Table 2, seasonal abundance); Turner & al., 2011 (p.1066, Table II, abundance 1998-2008); Dvoretsky & Dvoretsky, 2011 b (p.469, Table A, abundance, biomass); Sichlau & al., 2011 (p.665, diapause eggs in sediments); Van Ginderdeuren & al., 2012 (p.3, Table 1); Postel, 2012 (p.327, Table 1), Fig.6); Zizah & al., 2012 (p.79, Tableau I, Rem.: p.86); Sigurdardottir, 2012 (p.1, Table 2. 3); Schulz J. & al., 2012 (p.3, abundance vs. hydrography); Dvoretsky & Dvoretsky, 2012 (p.1321, Table 2, 3, 4, 5, abundance, biomass, production); Freese & al., 2012 (p.66, enzyme activity vs. temperature & pH); McGinty & al., 2012 (p.122, time series abundance); Alvarez-Fernandez & al., 2012 (p.21, Rem.: Table 1); Gusmao & al., 2013 (p.279, fig.1, sex ratio vs predators, fig.4: seasonal variation of sex ratio); Usov & al., 2013 (p.1, interannual abundance vs temperature 1961-2010); Lidvanov & al., 2013 (p.290, Table 2, % composition); Dvoretsky & Dvoretsky, 2013 a (p.205, Table 2, % abundance); Barton & al., 2013 (p.522, Table 1, metabolism, diapause, population dynamic, feeding mode, biogeo); Zaafa & al., 2014 (p.67, Table I, occurrence): Benedetti & al., 2016 (p.159, Table I, fig.1, functional characters); Ben Ltaief & al., 2017 (p.1, Table III, Summer relative abundance); Buskey & al., 2017 (p.754, amyelinate fiber vs. escape response); Baumgartner & Tarrant, 2017 (p.387, resting eggs, fig.1,Rem.); El Arraj & al., 2017 (p.272, table 2, spatial distribution); Chaouadi & Hafferssas, 2018 (p.913, Table II: occurrence); Belmonte, 2018 (p.273, Table I: Italian zones); Richirt & al., 2019 (p.3, Table 1, fig.2, 3, 4, 5, abundance changes vs years 1998-2014, table 2: diversity index ) | | | | NZ: | 11 + 1 doubtful | | |
|
Distribution map of Centropages hamatus by geographical zones
|
| | | | | | | | | | | | | | | 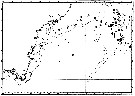 issued from : P. Jespersen, 1939 in Meddr Grønland, 1939, 119 (9). [p.69, Fig. 30]. issued from : P. Jespersen, 1939 in Meddr Grønland, 1939, 119 (9). [p.69, Fig. 30].
The occurrence of Centropages hamatus at the ''Dana'' stations in 1931-1933.
black circles: positive occurrence; x: negative occurrence. |
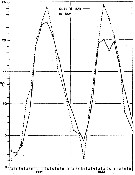
 issued from : G.B. Deevey in Bull. Bingham Oceanogr. Coll., 1960 (2). [p.24, Fig.12]. issued from : G.B. Deevey in Bull. Bingham Oceanogr. Coll., 1960 (2). [p.24, Fig.12].
Variations in length (from the top of the head to the base of the caudal rami) of Centropages hamatus females and males in the Delaware Bay (NW Atlantic Ocean).
See relation with the temperature (p.10, Fig.2) |
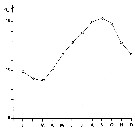
 issued from : G.B. Deevey in Bull. Bingham Oceanogr. Coll., 1960 (2). [p.10, Fig.2]. issued from : G.B. Deevey in Bull. Bingham Oceanogr. Coll., 1960 (2). [p.10, Fig.2].
Average surface temperatures at the stations in and outside Delaware Bay (NW Atlantic) from 1931 through November 1932.
The surface temperature range in the Bay varied from less than 2°C in the winter to 24° or 25°C in the summer, and more extreme than that outside the Bay, where temperatures ranged from over 2°C to approximately 22°C, but the cycles varied considerably from year to year (see p.10, figure 2). Salinity outside the Bay varied from a minimum of 30 p.1000 to a maximum of 32.88 p.1000. In the Bay it ranged from 22.8 - 32.25 p.1000. Thus the salinity was over 30 p.1000 at the stations outside the Bay while the range at the mouth of the Bay anda t the stations inside was such as to exlude ordinarily from the Bay some of the neritic species common in the outside waters. |
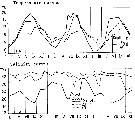
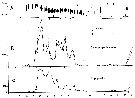 issued from : J. Le Ruyet-Person, C. Razouls & S. Razouls in Vie Milieu, 1975, XXV (2B). [p.298, Fig.3]. issued from : J. Le Ruyet-Person, C. Razouls & S. Razouls in Vie Milieu, 1975, XXV (2B). [p.298, Fig.3].
Life history of Centropages hamatus at Roscoff (western English Channel) during the year.
A: Variations of the cephalothoracic lengths; B: Number of adult females and males; C: Number of copepodites (all stages).
The number of generations (or main cohorts) is estmated to five for the year in relation to the temperature (See p.285, Fig.1) |
 issued from : J. Le Ruyet-Person, C. Razouls & S. Razouls in Vie Milieu, 1975, XXV (2B). [p.285, Fig.1]. issued from : J. Le Ruyet-Person, C. Razouls & S. Razouls in Vie Milieu, 1975, XXV (2B). [p.285, Fig.1].
Temperature variations of surface water (mean by month) during the year at Roscoff (western English Channel) |
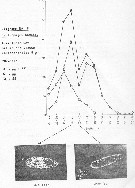
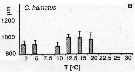
 issued from : F. Bodo, C. Razouls & A. Thiriot in Cah. Biol. Mar., VI, 1965. [p.230, Fig.7]. issued from : F. Bodo, C. Razouls & A. Thiriot in Cah. Biol. Mar., VI, 1965. [p.230, Fig.7].
Annual quantitative variations of adults for Temora longicornis and Centropages hamatus at Roscoff (English Channel) interpreted as competition between them.
n x 1000
|
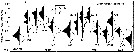
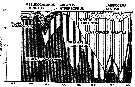
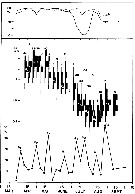
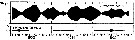
 issued from : G.C. Harding, W.P. Vass, B.T. Hargrave & S. Pearre in Can. J. Fish. Aquat. Sci., 1986, 43 (5). [p.961, Fig.6]. issued from : G.C. Harding, W.P. Vass, B.T. Hargrave & S. Pearre in Can. J. Fish. Aquat. Sci., 1986, 43 (5). [p.961, Fig.6].
Depth-frequency diagrams and trap results of Centropages hamatus females and males during the 24-h study.
Incident radiation recorded on deck is indicated in the upper panel; arrows indicate sunset and sunrise. The actual number of individuals moving up or down into the traps at 8, 14, 21 and 28 m is indicated next to each arrow.
Trap deployment and retrieval time was set to coincide with the middle of adjacent horizontal, net-tow series.
The 25 and 75 % population quartiles are connected by broken lines and the population median is indicated by a black dot.
The number located inside each depth-frequency diagram (scale lower right) is the estimated number of individuals/ m3 in the water column during this series of horizontal net tows.
Sampling for eight and four periods, respectively, between 10:30 August 19 and 09:30 August 20, 1980, at St. Georges Bay, shallow marine embayment open on the north to Northumberland Strait and the southern Gulf of St. Lawrence.
Nota: Engine and deployment of mooring traps figured in Harding & al. (1987) and Harding & al. (1986). |
 issued from : B.T. Hargrave, G.C. Harding, K.F. Drinkwater, T.C. Lambert & W.G. Harrison in Mar. Ecol. Prog. Ser., 1985, 20. [p.227, Fig.7]. issued from : B.T. Hargrave, G.C. Harding, K.F. Drinkwater, T.C. Lambert & W.G. Harrison in Mar. Ecol. Prog. Ser., 1985, 20. [p.227, Fig.7].
Major species of zooplankton present at the central station in St. Georges Bay (45°45'N, 61°45'W) during 1977.
Nota: All zooplankton collections were made after sunset. The net towed obliquely throughout the water column (± 34 m in depth). |
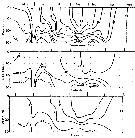 issued from : B.T. Hargrave, G.C. Harding, K.F. Drinkwater, T.C. Lambert & W.G. Harrison in Mar. Ecol. Prog. Ser., 1985, 20. [p.223, Fig.2]. issued from : B.T. Hargrave, G.C. Harding, K.F. Drinkwater, T.C. Lambert & W.G. Harrison in Mar. Ecol. Prog. Ser., 1985, 20. [p.223, Fig.2].
Seasonal profiles of water temperature and salinity in St. Georges Bay (45°45'N, 61°45'W) near the central station during 1977. |
 issued from : S. Eriksson in ZOON, 1976, 4. [p.157, Fig.2]. issued from : S. Eriksson in ZOON, 1976, 4. [p.157, Fig.2].
Seasonal distribution of neritic copepod Centropages hamatus and C. typicus off Gothenburg (Göteborg), The Skattegatt. (Monthly means for adult specimens during 1968-1973; point : inshore, depth = 10 m; x: offshore, depth > 40 m.
The main occurrence of the two congeneric species are separated in time: C. hamatus June to July and C. typicus September. The first species has a wide optimum range (3 to 19°C) and the second species a narrow one (12 to 16°C). |
 issued from : S. Eriksson in ZOON, 1976, 4. [p.158, Fig.3, c-d]. issued from : S. Eriksson in ZOON, 1976, 4. [p.158, Fig.3, c-d].
Temperature occurrence of neritic copepod Centropages hamatus and C. typicus off Gothenburg (Göteborg), The Skattegatt.
Surface salinity of the investigation area varies around 25 p.1000 and the deep water slinity around 34 p.1000. There is a temperature stratification with surface water warmer than 10°C from May to October with maximum of 20°C in August. The coldest period is January to March with surface temperatures of 1-2°C. The deep water ranges between 5 and 10°C.
The hauls were horizontal at 2, 20, and 40 m.
Limits subjectively regarded as the optimum temperature range: 3-19°C, against 12-16°C for C. typicus probably an allochtonous species. |
 issued from : S. Eriksson in ZOON, 1973, 1. [p.53, Fig.17]. issued from : S. Eriksson in ZOON, 1973, 1. [p.53, Fig.17].
Size distribution of adult females of Centropages hamatus (offshore station H6:11°30' N, 57°40'.5 E, The Kattegatt) during 1968-70 in the main series. |
 issued from : S. Eriksson in Mar. Biol., 1974, 26. [p.320, Figs. 2-3] issued from : S. Eriksson in Mar. Biol., 1974, 26. [p.320, Figs. 2-3]
Salinity and temperature curves for main series at offshore station H6 (11°30' N, 57°40'.5 E, The Kattegatt) from March 1968 to November 1970. |
 issued from : P. Martens in M.S. Inst. Meeresk. Christian-Albrechts Univ., 1972. [p.26]. issued from : P. Martens in M.S. Inst. Meeresk. Christian-Albrechts Univ., 1972. [p.26].
Numbers of fecal pellets (n) by width classes (Breite) (interval from 0.005 mm).
Nota: individuals in culture on Chaetoceros decipiens, C. socialis, Detonula cystifera, Skeletonema costatum and flagellates.
Mean size of fecal pellets: length = 130 ± 40 micrometers; width = 40 ± 10 micrometers. Volume male = 95513 µ3; female = 200642 µ3. |
 issued from : I.A. McLaren inJ. Fish. Res. Board Can., 1978, 35. [p.1336, Fig.5]. issued from : I.A. McLaren inJ. Fish. Res. Board Can., 1978, 35. [p.1336, Fig.5].
Life cycles of Centropages hamatus in Loch Striven (55°55'N, 05°10'W).
Relative abundance of C V as a percentage of all copepodids (lower panel); size and numbers per haul (including combined hauls from 60 m to 10 m and 10 to 0 m) of adult females (middle panel), and percentage of nauplii and copepodids above 10 m (from split hauls, taken from 60 to 10 m and 10 to 0 m) (upper panel).
Successive generations as infered from peaks in the C V cohorts and size changes designated as Go, G1, etc.
Data from Marshall (1949, tables VI and XIII). |
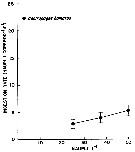 issued from : issued from : W.J. Conley & J.T. Turner in Mar. Ecol. Progr. Ser., 1985, 21. [p.117, Fig.3]. issued from : issued from : W.J. Conley & J.T. Turner in Mar. Ecol. Progr. Ser., 1985, 21. [p.117, Fig.3].
Centropages hamatus. Predation (ingestion) rates of adults (males and females combined) feeding upon copepod nauplii (number of nauplii ingested by copepod and by day) over a range of natural concentrations. Means of 14 to 19 replicates; error bars: ± standard error.
Nota: Experimental animals collected in the Westport River estuary (Massachusetts).
Nota: C. hamatus ingested more phytoplankton than animal material and consumed an average of 209 % more carbon when feeding upon natural concentration of phytoplankton (mean = 2.05 µgC per copepod and per day than when carnivorously (mean = 0.98 µgC per copepod and by day). This indicates that the species is less predaceous, when feeding on natural prey items, than when feeding on artificial prey items such as Artemia nauplii considerably larger, more sluggish, and therefore easier to capture, than Acartia spp. nauplii. Animal prey also appears unnecessary for growth and reproduction of C. hamatus, since this species has been successfully reared in the laboratory on phytoplankton cultures (see Klein Breteler, 1980).
Compare with the same experimental method in Labidocera aestiva. |
 issued from : N.R. Collins & R. Williams in Mar. Biol., 1981, 64. [p.280, Fig.19]; issued from : N.R. Collins & R. Williams in Mar. Biol., 1981, 64. [p.280, Fig.19];
Centropages hamatus. Monthly distribution and abundance in Bristol Channel and Severn Estuary from November 1973 to February 1975, together with 31 and 35 p.1000 S isohaline. |
 issued from : N.R. Collins & R. Williams in Mar. Biol., 1981, 64. [p.281, Fig.10]; issued from : N.R. Collins & R. Williams in Mar. Biol., 1981, 64. [p.281, Fig.10];
Centropages hamatus. Numerical abundance plotted against salinity for the four seasons in Bristol Channel and Severn Estuary from November 1973 to February 1975; 31 and 35 p.1000 S values are indicated.
Nota: This euryhaline species has its greatest abundance within a salinity range of 32 to 34 p.1000, although it was found in salinities as low as 27 p.1000. |
 Issued from : Jan Schulz & coll. in Progr. Oceanogr., 2012, 107; [p.8, Fig.4 [modified]); Issued from : Jan Schulz & coll. in Progr. Oceanogr., 2012, 107; [p.8, Fig.4 [modified]);
Seasonal patterns in the abundance of Acartia longiremis in the Bornholm Basin (central Baltic Sea) between March 2002 and May 2003. The scaling is normalised to one and vertical lines indicate sampling dates.
Sampling performed in stacked, 10m intervals from a few meters above the seafloor to the surface with a multinet (Hydro-bios, Kiel, 50 µm mesh size) on nine focus stations.
Compare with annual cycle in Acartia longiremis, Acartia bifilosa,Temora longicornis, Oithona similis and other forms |
 Issued from : Jan Schulz & coll. in Progr. Oceanogr., 2012, 107; [p.6, Fig.2]. Issued from : Jan Schulz & coll. in Progr. Oceanogr., 2012, 107; [p.6, Fig.2].
Vertical profiles of temperature, salinity and oxygen in the central Bornholm Basin (Baltic Sea) at position 55.3016° N, 15.7966° E. |
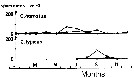
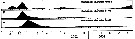
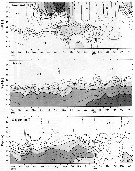
 Issued from : N. Usov, I. Kutcheva, I. Primakov & D. Martynova in Hydrobiologia, 2013, 706. [p.18, Fig.3]. Issued from : N. Usov, I. Kutcheva, I. Primakov & D. Martynova in Hydrobiologia, 2013, 706. [p.18, Fig.3].
Long^term dynamics of monthly temperature, salinity and Centropages hamatus abundance in the layer of 0-10 m in Chupa Inlet (Kandalaksha Bay, White Sea) from 1961 to 2010. Sampling from water layers (0-10, 10-25, and 25-45 m) using a standard Juday net (mesh size 200 µm). |
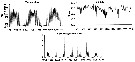
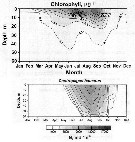 Issued from : N. Usov, I. Kutcheva, I. Primakov & D. Martynova in Hydrobiologia, 2013, 706. [p.17, Fig.2 & p.23, Fig.7]. Issued from : N. Usov, I. Kutcheva, I. Primakov & D. Martynova in Hydrobiologia, 2013, 706. [p.17, Fig.2 & p.23, Fig.7].
Long-term average of Chl a and seasonal dynamics of Centropages hamatus in Chupa Inlet (White Sea). |
 Issued from : D.M. Martynova, M. Graeve & U.V. Bathmann in Polar Biol., 2009, 32. [p.136, Table 1. Issued from : D.M. Martynova, M. Graeve & U.V. Bathmann in Polar Biol., 2009, 32. [p.136, Table 1.
Biochemical parameters of Centropages hamatus from the White Sea (66°20.2'N, 33°38.9'E) in August 2002. |
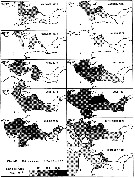
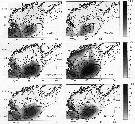 Issued from : R. Ji, C.S. Davis, C. Chen & R.C. Beardsley in Mar. Ecol. Prog. Ser., 2009, 384. [p.191, Fig.4]. Issued from : R. Ji, C.S. Davis, C. Chen & R.C. Beardsley in Mar. Ecol. Prog. Ser., 2009, 384. [p.191, Fig.4].
Centropages hamatus. Bimonthly climatology for the distribution of adult abundance (vertically averaged, no. m3) in the Gulf of Maine-Georges Bank region. |
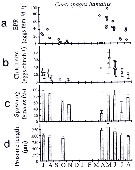 issued from : C. Halsband & H.J. Hirche in Mar. Ecol. Prog. Ser., 2001, 209. [p.223, Fig.4]. issued from : C. Halsband & H.J. Hirche in Mar. Ecol. Prog. Ser., 2001, 209. [p.223, Fig.4].
Centropages hamatus. Reproductive parameters at Helgoland Roads.
(a) Egg production rate; (b) clutch size, weekly means ± SD; egg production rate; (c) proportion of females spawning; (d) prosome length. |
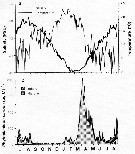 issued from : C. Halsband & H.J. Hirche in Mar. Ecol. Prog. Ser., 2001, 209. [p.221, Fig.2]. issued from : C. Halsband & H.J. Hirche in Mar. Ecol. Prog. Ser., 2001, 209. [p.221, Fig.2].
Seasonal cycles of (a) temperature and salinity at Helgoland Roads. (b) phytoplankton at Helgoland Roads. 'others' = total phytoplankton carbon - diatom carbon. Phytoplankton data smoothed by 3-point running average. |
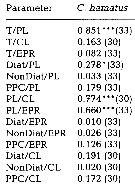 issued from : C. Halsband & H.J. Hirche in Mar. Ecol. Prog. Ser., 2001, 209. [p.224, Table 2]. issued from : C. Halsband & H.J. Hirche in Mar. Ecol. Prog. Ser., 2001, 209. [p.224, Table 2].
Correlation coefficients (r2) between temperature at collection (T), prosome length (PL), clutch size (CL), egg production rate (EPR), diatom carbon (Diat), non-diatom carbon (NonDiat), and total phytoplankton carbon (PPC) at Helgoland Roads.
Clutch size = daily egg production rate of spawning females. Sample size in parentheses. Significance levels = * p<0.01; *** p < 0.0001. |
 issued from : G.B. Deevey in Bull. Bingham Oceanogr. Coll., 1960 (2). [p.19, Fig.7]. issued from : G.B. Deevey in Bull. Bingham Oceanogr. Coll., 1960 (2). [p.19, Fig.7].
Relative percentages, by count, of the species Centropages typicus compared with Centropages hamatus at the stations in Delaware Bay (39° N, 75°25' W), from January 1930 through December 1932.
Nota: C. hamatus is a relatively euryhaline boreal and temperate species which occurs primarily in sheltered or inshore waters. On the eastern American coast its range extends from Straits of Belle Isle to the Gulf of Mexico.
A similar period of occurrence for Alligator Harbor (Florida) (Grice, 1956), where the species was found from November to April over a temperature range of 9.0°-22.3°C. For Delaware Bay the range noted was -0.65 to 23.9°C.
C. hamatus was much more abundant in the surface waters of Delaware Bay than it was outside. |
 issued from : G.B. Deevey in Bull. Bingham Oceanogr. Coll., 1960 (2). [p.20, Fig.8]. issued from : G.B. Deevey in Bull. Bingham Oceanogr. Coll., 1960 (2). [p.20, Fig.8].
Relative percentages, by count, of the species Centropages typicus compared with Centropages hamatus at the stations outside Delaware Bay (39° N, 74°40' W), from January 1930 through December 1932. |
 Issued from : G. B. Deevey in Bull. Bingham Oceanogr. Coll., 1960, 17 (2). [p.73, Table VIII]. Issued from : G. B. Deevey in Bull. Bingham Oceanogr. Coll., 1960, 17 (2). [p.73, Table VIII].
Correlation coefficients for mean cephalothorax lengths with the temperature and phytoplankton of the day of samplingt and averaged for the previous four weeks obtained with 21 pairs of data for female Centropages hamatus from Loch Striven (W Clyde estuary)).
Quantity of diatoms (data published by S.M. Marshall, 1949 .
In 1933 the extreme range temperature at 0 m was 4.5-16.4°C and at 30 m 6.37-12.98°C. |
 Issued from : G.A. Deevey in Bull. Bingham Oceanogr. Coll., 1960, 17 (2); [p.76, Table IX]. Issued from : G.A. Deevey in Bull. Bingham Oceanogr. Coll., 1960, 17 (2); [p.76, Table IX].
Correlation coefficients for mean cephalothorax lengths for Centropages hamatus females with the temperature at sampled from the Block Island Sound, Rhode Island (data from Deevey, 1952) |
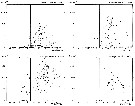
 Issued from : J.H. Costello, J.R. Strickler, C. Marrasé, G. Trager, R. Zeller & A.J. Freise in Proc. Natl. Acad. Sci., USA, 1990,
87. [p.1652, Fig.4]. Issued from : J.H. Costello, J.R. Strickler, C. Marrasé, G. Trager, R. Zeller & A.J. Freise in Proc. Natl. Acad. Sci., USA, 1990,
87. [p.1652, Fig.4].
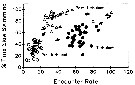
Effect of motivation on the relationship between encounter rate (encounters per 1000 video frames) and the percentage of time spent slow swimming for the low food concentration treatment .
The axes of this figure are analogous to food concentration (x axis) typical of functional response curves.
Open circle: Proturbulence; black circle: turbulence; triangle: posturbulence.
Nota (p.1648, 1652): These observations do not support the ''automatic'' response to food concentration as implied in the functional response paradigm (see in Gerritsen & Strickler, 1977). Zooplankton populations will respond to prey concentration in a species-specific pattern depending on temporal and spatial prey distributions, the intensity spectrum of turbulent eddies, and feeding history.
The hypothesis that small-scale turbulence in aquatic systems (see Royhschild & Osborn, 1988) increases the perceived abubdance of prey to predators is tested by exposing centropages hamatus, from Buzzards Bay, Maine, to turbulent and nonturbulent environments at different prey concentrations.
The results fell into two main categories: 1st, the response to turbulence was characterized by an initial period having a high number of escape reactions. This period was followed by one of increased foraging. The species responded to the higher encounter rates due to turbulence as if it were experiencing altered prey concentrations. 2d, the termination of turbulence resulted in an increased foraging response, which was not directly related to the encounter rate.
Functional response curves do not adequately explain this foraging response because the time course of the foraging response depends on prior encounter experience and foraging motivation. |
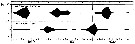
 Issued from : C. Halsband-Lenk, H.-J. Hirche & F. Carlotti in J. Exp. Mar. Biol. Ecol., 2002, 271. [p.124, Fig.1, a]. Issued from : C. Halsband-Lenk, H.-J. Hirche & F. Carlotti in J. Exp. Mar. Biol. Ecol., 2002, 271. [p.124, Fig.1, a].
Habit (after Rose, 1957; modified), range of prosome length in situ (Halsband-Lenk, partly unpublished) and geographical distribution in the Atlantic and adjacent seas of Centropages typicus and Centropages hamatus (a).
The target is the temperature impact on reproduction and development of two congener copepod pairs inhabiting different biogeographic regions to their geographic distribution patterns (from two stations in the North Sea, Helgoland Island and the Mediterranean Sea, Villefrance -sur-Mer).
See Centropages typicus in commentaries by the same authors (p.124, Fig. 1) and Temora longicornis for the conclusion. |
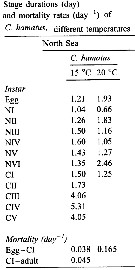 Issued from : C. Halsband-Lenk, H.-J. Hirche & F. Carlotti in J. Exp. Mar. Biol. Ecol., 2002, 271. [p.139, Table 3]. Issued from : C. Halsband-Lenk, H.-J. Hirche & F. Carlotti in J. Exp. Mar. Biol. Ecol., 2002, 271. [p.139, Table 3].
Stage durations and mortality rates (day-1) of C. hamatus at different temperatures; individuals collected from the North Sea (Helgoland Island).
Compare with Centropages typicus collected in the same site. |
 Issued from : C. Halsband-Lenk, H.-J. Hirche & F. Carlotti in J. Exp. Mar. Biol. Ecol., 2002, 271. [p.140, Table 4]. Issued from : C. Halsband-Lenk, H.-J. Hirche & F. Carlotti in J. Exp. Mar. Biol. Ecol., 2002, 271. [p.140, Table 4].
Egg production rates (EPR) and development times of Centropages hamatus.
NS = North Sea; M = Mediterranean; A = Atlantic.
I.g. = Isochrysis galbana; H.e.= Hymenomonas elongata; T.s. = Tetraselmis suecica; D.t. = Dunalliella tertiolecta; T.w. = Thalassiosira weissflogii; T.r. = Thalassiosira rotula; R.b. = Rhodomonas baltica; R.sp. = Rhodomonas sp.; O.m. = Oxyrrhis marina. |
 Issued from : C. Halsband-Lenk, H.-J. Hirche & F. Carlotti in J. Exp. Mar. Biol. Ecol., 2002, 271. [p.144, Table 6]. Issued from : C. Halsband-Lenk, H.-J. Hirche & F. Carlotti in J. Exp. Mar. Biol. Ecol., 2002, 271. [p.144, Table 6].
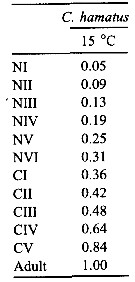
Proportion of total development time (egg-laying to adult) spent in each stage (cumulative median development time/generation time in Centropages hamatus.
NS = North Sea (Helgoland Island); Med = Mediterranean Sea (Villefranche-sur-Mer) |
 Issued from : C. Halsband-Lenk, H.-J. Hirche & F. Carlotti in J. Exp. Mar. Biol. Ecol., 2002, 271. [p.143, Table 5]. Issued from : C. Halsband-Lenk, H.-J. Hirche & F. Carlotti in J. Exp. Mar. Biol. Ecol., 2002, 271. [p.143, Table 5].
Centropages hamatus (from the North Sea, Helgoland Island) and Centropages typicus: Synthesis of results from incubation in a temperature gradient from 0 to 35°C.
FTT = female thermal tolerance. RTR = reproductive thermal response. ETR = embryonic thermal response.
See commentary on Centropages typicus by the authors. |
 Issued from : C. Halsband-Lenk, H.-J. Hirche & F. Carlotti in J. Exp. Mar. Biol. Ecol., 2002, 271. [p.132, Fig.8, B]. Issued from : C. Halsband-Lenk, H.-J. Hirche & F. Carlotti in J. Exp. Mar. Biol. Ecol., 2002, 271. [p.132, Fig.8, B].
Centropages hamatus (from the North Sea, Helgoland Island): Prosome length of females incubated in experiments. Vertical bars indicate standard deviation.
Compare with Centropages typicus from the North Sea (fig.8, A) from the same authors. |
 Issued from : S. Ban, C. Burns, J. Castel, Y. Chaudron & al. in Mar. Ecol. Prog. Ser., 1997, 157. [p.289, Table 1]. Issued from : S. Ban, C. Burns, J. Castel, Y. Chaudron & al. in Mar. Ecol. Prog. Ser., 1997, 157. [p.289, Table 1].
Synopsis of feeding/reproduction experiments. A total of 17 diatom and 16 copepod species, representative of a variety of worldwide temperate and subarctic environments (E: estuarine, C: coastal ocean), were screened.
Data for fecundity and hatching success are average values measured at the start and end of the inciubations in a minimum of 3 replicate batches, showing the variation in time of the effects of diatoms on copepod reproduction.
Level of significance of the diatom effect between treatments and controls (e.g. non-diatom diets) in categories I to III was p < 0.01. No.. rank (for comparison with Table 2, p.290).
For the signification of the categories I to IV (fecundity vs. Hatching success vs. Duration of experiment days-1): See Calanus finmarchicus.
List of the 12 marine or estuarine species studied (fresh water excluded. CR): Acartia clausi, A. grani, A. steueri, A. tonsa, Calanus finmarchicus, C. helgolandicus, C. pacificus, Centropages hamatus, C. typicus, Eurytemora affinis, Temora longicornis, T. stylifera. |
 Issued from : S. Ban, C. Burns, J. Castel, Y. Chaudron & al. in Mar. Ecol. Prog. Ser., 1997, 157. [p.290, Table 2]. Issued from : S. Ban, C. Burns, J. Castel, Y. Chaudron & al. in Mar. Ecol. Prog. Ser., 1997, 157. [p.290, Table 2].
Combinations of copepod and non-diatom diets in controls in concentrations ranging from 104 to 105 cells ml-1. Data for fecundity and hatching success are average values measured at the start and end of incubation in a minimum of 3 replicate batches.
N.A: natural assemblages of phytoplankton at time of incubation were for for No 10 >50% diatoms.
: No10: In Category I. |
| | | | Loc: | | | Congo, Canary Is., Morocco-Mauritania, Caribbeans, G. of Mexico, Louisiana (off Grand Isle, Turkey Point), Florida, Turkey Point, Portugal, Bay of Biscay, La Pallice roadstead, Belon estuary, Chesapeake Bay, Delaware Bay, Narragansett Bay, Buzzards Bay, Long Island Sound, Vineyard Sound, off Woods Hole, G of Maine, Frenchman Bay (Maine), Georges Bank, off SE Nova Scotia, St. Georges Bay, Shédiac Bay, Northumberland Strait, G. of St. Lawrence, Shediac Valley, Bradelle Bank, James Bay, Godthaab Fjord (W Greenland), Roadstead of Brest, English Channel, Morlaix estuary, Granville, Pas de Calais, Norway (Bergen, Oslo fjord, Malangen fjord, Raunefjorden, Svartatjønn basin, Hakøybotn, Kosterfjorden), NE Scotland (Buchan area), North Sea, Oosterschelde (Netherlands), Gullmar Fjord, Kattegat, Kiel fjord, Skagerrak, Gullmar Fjord, Elbe (estuary), Kiel Bight, Bay of Lübeck, Gulf of Mecklenburger, Baltic Sea, Bornholm Basdin, Strait of Belle Isle, Greenland (W & E), Newfoundland, Iceland, Ireland, Galway Bay, Fairlie Channel (SW Scotland), Bristol Channel, Faroe, Svalbard, Norway Sea, Barents Sea, Pechora Sea, White Sea, Chupa Inlet, Kara Sea, Yamal (W coast), Baidara Bay, Abidjan (in Ibanez & Seguin, 1972); Mauritania-Morocco, off Azores, Portugal, Mondego estuary, off W Tangier, Medit. (Alboran Sea, Habibas Is., Sidi fredj coast, Baleares, G. of Lion (rare), Marseille, Toulon harbour, Monaco, Ligurian Sea, Tyrrhenian Sea, N Adriatic Sea (Bay of Trieste), G. of Gabès (rare), Malta: Grand Harbour, Black Sea), Indian (Natal) (in Carter, 1977 (1978), China Seas (Yellow Sea, East China Sea), [Pacif.: Is. Fidji, off Californie W , Pacif. S (in C. B. Wilson, 1942 a, p.68, 142; 1950, p.187); N Japan (in Marukawa, 1921)] | | | | N: | 254 (Arct.: 17; S Atlant.: 2; N Atlant.: 141; North Sea: 35, Baltic: 15, Medit.: 25; Indian: 1 ?; Pacif.: 1 ?) | | | | Lg.: | | | (45) F: 1,35-1; M: 1,2-0,9; (47) F: 1,42-1,3; M: 1,3-1,15; (65) F: 1,35; M: 1,3; (167) F: 1,2-1,1; M: 1,14-1; (373) F: 1,27; M: 1,26-1,17; (449) F: 1,42-1,3; M: 1,3-1,15; (796) F: 1,33-0,94; M: 1,17-0,94; {F: 0,94-1,42; M: 0,90-1,30}
The mean female size is 1.248 mm (n : 12; SD = 0.1576), and the mean male size is 1.152 mm (n = 13; SD = 0.1329). The size ratio (male : female) is 0.93 (n = 7; SD = 0278). | | | | Rem.: | epipelagic. Neritic. After Pearson (1906, p.22) : vertical range down to 400 m.
The occurrence of this species is confirmed by Zhang & al., 2010 (comm. pers.).
In the Gulf of Marseille NW Mediterranean Sea) during the period from 28 September 1960 to 11 October 1961, Gaudy (1962) points to this rare species over the year and mainly at the end in summer and autumn (after p.99. C.R). The occurrence of this species in the Abidjan waters (Ivory coast) seems exceptional.
After Norrbin (1992, p.6) this species is uncommon so far north at Hakøybotn, Norway (69°30'N), found mainly during summer and disappears during winter.
Nota: Two types of resting eggs are recognised: 1- Quiescent (retarded) eggs which hatch soon after environmental conditions become favourable (e.g. hatch when incubated in the laboratory under appropriate temperatures), and 2 - diapause (arrested) eggs which will not hatch until they complete and obligatory refractory period (Grice & Marcus, 1981.
Resting eggs of those calanoids which oterwise hatch within the egg sac are also released and sink to the bottom (e.g. Eurytemora affinis).
Madhupratap & al. (1996) collected from the Kiel Bay and adjacent waters in the southwestern Baltic Sea during April-May (1994), resting eggs of four species of calanoid copepods and three species of cladocerans form sediments up to 5 cm depth. In the Kiel Bay, egg abundances varied from 1.8 x 10⁵ to 7.4 x 10⁵ m-2. Hatching success of copepod eggs collecterd from all depths was high (49 to 94%), but was 0 to 79% for cladoceran eggs. Darkness did not seem to affect hatching. Eggs found in the 4 to 5 cm layer of sediment were estimated to be about 15 yr old, showing the presence of an ''egg bank'' in the Baltic. Formation of resting eggs may be a genetic trait acquired during the ice ages.
After Barton & al., 2013 (p.530, Table b1) the feeding mode a mixing 'ambush' and 'cruising' (see definition in Centropages typicus). | | | Last update : 25/10/2022 | |
|
|
 Any use of this site for a publication will be mentioned with the following reference : Any use of this site for a publication will be mentioned with the following reference :
Razouls C., Desreumaux N., Kouwenberg J. and de Bovée F., 2005-2026. - Biodiversity of Marine Planktonic Copepods (morphology, geographical distribution and biological data). Sorbonne University, CNRS. Available at http://copepodes.obs-banyuls.fr/en [Accessed March 04, 2026] © copyright 2005-2026 Sorbonne University, CNRS
|
|
|
|


;)
;)
;)
;)
;)
;)
;)
;)
;)
;)
;)
;)

;)
;)
;)
;)
;)
;)
;)
;)
;)
;)
;)
;)
;)
;)
;)
;)
;)
;)
;)
;)
;)
;)
;)
;)
;)
;)
