|
|
 |
|
Calanoida ( Order ) |
|
|
|
Diaptomoidea ( Superfamily ) |
|
|
|
Centropagidae ( Family ) |
|
|
|
Centropages ( Genus ) |
|
|
| |
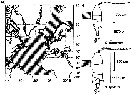
Centropages typicus Kröyer, 1849 (F,M) | |
| | | | | | | Syn.: | Ichthyophorba denticornis Claus,1863 (p.199);
no Centropages typicus : Cleve, 1904 a (p.181, 182, 187); ? Carola, 1994 (p.233); Tanaka, 1960 (p.46);
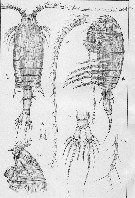
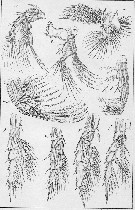
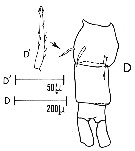
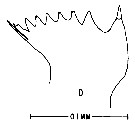
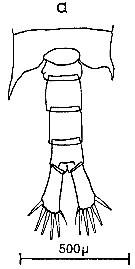
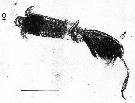
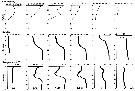
Centropages. aucklandicus : Pesta, 1920 (p.520, Rem.); Mazza, 1966 (p.71); 1967 (p.326) Razouls, 1972 (p.94, Annexe: p.59, figs.F); Razouls & Durand, 1991 (p.74); Hure & Krsinic, 1998 (p.53, 101); ? Rossi, 2008 (p.90: Tableau XII); | | | | Ref.: | | | Kröyer, 1849 (in Damkaer & Damkaer, 1979, p.43); Brady, 1878 (p.65, figs.F,M); Bourne, 1889 (p.148); Giesbrecht, 1892 (p.303, 319, figs.F,M); Thompson, 1888 d (p.142); Giesbrecht & Schmeil, 1898 (p.54); Wheeler, 1901 (p.173, figs.F,M, Rem.); Sars, 1902 (1903) (p.75, figs.F,M); Thompson & Scott, 1903 (p.234, 246); Farran, 1908 b (p.58); Lysholm, 1913 (p.6); Pesta, 1920 (p.522); Lysholm & Nordgaard, 1921 (p.22); Sars, 1925 (p.205); Farran, 1926 (p.269); Rose, 1929 (p.30); Heberer, 1932 a (p.250, p. 347: male genital apparatus; Wilson, 1932 a (p.87, figs.F,M); Rose, 1933 a (p.185, figs.F,M); Jespersen, 1940 (p.48); Massuti Alzamora, 1942 (p.92); Lysholm & al., 1945 (p.32); Farran, 1948 (n°11, p.3, figs.F,M); Crisafi, 1960 (p.475, figs.F,M, juv.); Anraku & Omori, 1963 (p.118, figs. mouth parts); Marques, 1966 (p.7); Lawson & Grice, 1970 (p.187, figs. O, N, juv.,F,M); Shih & al., 1971 (p.38); Gaudy, 1971 a (p.363, Rem.: A1); Lee, 1972 (p.3, figs.F,M, spermatophore & coupling device, P6 male biometry, Text-fig.13, Rem.); Razouls, 1972 (p.94, Annexe: p.61, figs.F); Razouls & Guinness, 1973 a (p.413); Fleminger, 1975 (p.397); Razouls S., 1975 (p.297, genital system); Blades, 1977 (p.57, figs.M,F, mating); Arnaud & al., 1980 (p.213, gut structure); 1982 (p.537, ultrastructure, ovogenese); McAden & al., 1987 (p.290); Huys & Boxshall, 1991 (p.50, 80, figs.F); Karlson & Bamstedt, 1994 (p.79, fig.2: Md); Barthélémy & al., 1998 (p.721, genital area); Bradford-Grieve & al., 1999 (p.884, 951, figs.F,M); Barthélémy, 1999 a (p.9, Fig.9, D); Buttino & al., 2003 (p.459, fig. egg); G. Harding, 2004 (p.12, 34, figs.F, M); Boxshall & Halsey, 2004 (p.87: figs.F,M); Conway, 2006 (p.15, copepodides 1-6, Rem.); Ferrari & Dahms, 2007 (p.33, Rem. N); Avancini & al., 2006 (p.96, Pl. 65, figs.F,M, Rem.); Vives & Shmeleva, 2007 (p.475, figs.F,M, Rem.); Castellani & al., 2012 (p.99, morphological & genetic variation); Laakmann & al., 2013 (p.862, figs.1, 2, 3, 4, 5, Table 1, 2, 3, molecular biology); Andronov, 2014 (p.29, fig.4, 4); Andronov, 2014 (p.36, fig.: A2); Blanco-Bercial & al., 2014 (p.6: Rem.: problematical for barcoding); Blanco-Bercial & Bucklin, 2016 (p.1566, population genetic vs geographic distribution). | 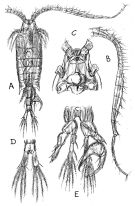 issued from : Sars G.O. in An Account of the Crustacea of Norway. Vol. IV. Copepoda Calanoida. Published by the Bergen Museum. 1902 (1903). [Pl. LI]. Male: A, habitus (dorsal view); B, right A1; C, cephalosome (ventral view); D, anal segment and furca; E, P5.
|
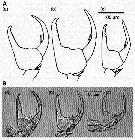
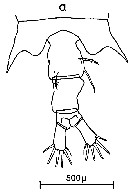
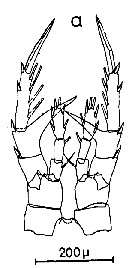
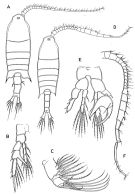 issued from : Boxshall G.A. & Hasley S.H. in The Ray Society, London, 2004. [Figure 13, p.87]. Female: A, habitus (dorsal view); B, P5; C, maxilla (Mx2). Male: D, habitus (dorsal view); E, P5; F, A1 (right).
|
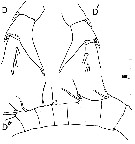 issued from : C. Razouls in Th. Doc. Etat Fac. Sc. Paris VI, 1972, Annexe. [Fig.47, D-D', D'']. As Centropages aucklandicus. Female (from Banyuls, G. of Lion): D, exopodal segment 2 of right P5; D', exopodal segment 2 of left P5; D'', basal segments of A1.
|
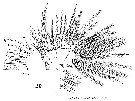
 issued from : Sars G.O. in An Account of the Crustacea of Norway, with short descriptions and figures of all species. Vol. IV. Copepoda Calanoida. Publ. by The Bergen Museum. 1903. [Pl. XLIV]. Female. R = rostrum; C = head (lateral); Ur = anal segment and caudal rami (dorsal).
|
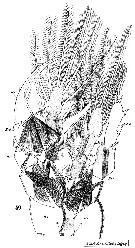
 issued from : Sars G.O. in An Account of the Crustacea of Norway, with short descriptions and figures of all species. Vol. IV. Copepoda Calanoida. Publ. by The Bergen Museum. 1903. [Pl. L]. Female. M = Md; m = Mx1; mp1 = Mx2; mp2 = Mxp.
|
 issued from : R. Huys & G.A. Boxshall in Copepod Evolution. The Ray Society, 1991, 159. [p.80, Fig.2.2.27, B-E]. Female (from Shetland; Norman coll.): B, genital double somite (lateral view); C, same (dorsal view); D, same (ventral view); E, detail of digitiform process on left side.
|
 issued from : C. Razouls in Th. Doc. Etat Fac. Sc. Paris VI, 1972, Annexe. [Fig.48, D, D']. Female (from Banyuls): urosome (dorsal); D' process on genital segment.
|
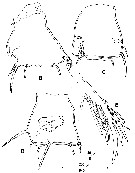
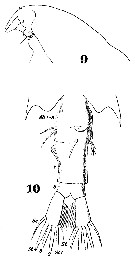 Issued from : W. Giesbrecht in Systematik und Faunistik der Pelagischen Copepoden des Golfes von Neapel und der angrenzenden Meeres-Abschnitte. Fauna Flora Golf. Neapel, 1892, 19 , Atlas von 54 Tafeln. [Taf.38, Figs.9, 10]. Female: 9, head (lateral); 10, last thoracic segment and urosome (ventral view).
|
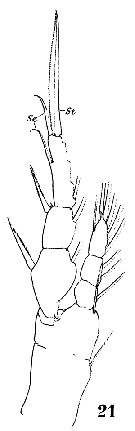
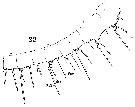 Issued from : W. Giesbrecht in Systematik und Faunistik der Pelagischen Copepoden des Golfes von Neapel und der angrenzenden Meeres-Abschnitte. Fauna Flora Golf. Neapel, 1892, 19 , Atlas von 54 Tafeln. [Taf.18, Fig.22]. Female: 22, proximal segments 1 to 8 (ventral view). Aes = aesthetasc; Spr = proximal seta; Sdi : distal seta.
|
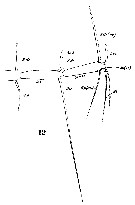 Issued from : W. Giesbrecht in Systematik und Faunistik der Pelagischen Copepoden des Golfes von Neapel und der angrenzenden Meeres-Abschnitte. Fauna Flora Golf. Neapel, 1892, 19 , Atlas von 54 Tafeln. [Taf.18, Fig.12]. Female: 12, distal segments 23 to 24-25 (ventral view).
|
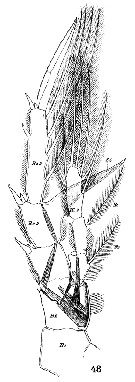
 Issued from : W. Giesbrecht in Systematik und Faunistik der Pelagischen Copepoden des Golfes von Neapel und der angrenzenden Meeres-Abschnitte. Fauna Flora Golf. Neapel, 1892, 19 , Atlas von 54 Tafeln. [Taf.18, Fig.18]. Female: 18, Mx2 (posterior view). L = lobe; B1 = basipodite 1 (= Praecoxa + Coxa); B2 = Basis; R1 = endopdite.
|
 Issued from : W. Giesbrecht in Systematik und Faunistik der Pelagischen Copepoden des Golfes von Neapel und der angrenzenden Meeres-Abschnitte. Fauna Flora Golf. Neapel, 1892, 19 , Atlas von 54 Tafeln. [Taf.18, Fig.16]. Female: 16, Mxp (posterior view).
|
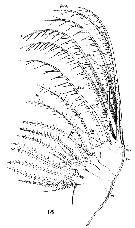
 Issued from : W. Giesbrecht in Systematik und Faunistik der Pelagischen Copepoden des Golfes von Neapel und der angrenzenden Meeres-Abschnitte. Fauna Flora Golf. Neapel, 1892, 19 , Atlas von 54 Tafeln. [Taf.18, Fig.21]. Female: 21, P1 (anterior view).
|
 Issued from : W. Giesbrecht in Systematik und Faunistik der Pelagischen Copepoden des Golfes von Neapel und der angrenzenden Meeres-Abschnitte. Fauna Flora Golf. Neapel, 1892, 19 , Atlas von 54 Tafeln. [Taf.17, Fig.48]. Female: 48, P5 (anterior view). Nota: B1: basipodite 1 (= Coxa); B2: basipodite 2 (= Basis); Re = exopod; Ri = endopod.
|
Issued from : W. Giesbrecht in Systematik und Faunistik der Pelagischen Copepoden des Golfes von Neapel und der angrenzenden Meeres-Abschnitte. Fauna Flora Golf. Neapel, 1892, 19 , Atlas von 54 Tafeln. [Taf.38, Fiigs.9, 10]. Male: 9, head (lateral); 10, corners of last thoracic segment and urosome (ventral).
|
 Issued from : W. Giesbrecht in Systematik und Faunistik der Pelagischen Copepoden des Golfes von Neapel und der angrenzenden Meeres-Abschnitte. Fauna Flora Golf. Neapel, 1892, 19 , Atlas von 54 Tafeln. [Taf.18, Fiig.4]. Male: 4, right A1 (ventral view).
|
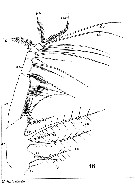
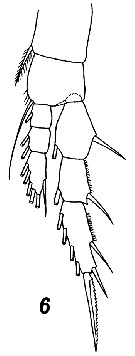
 Issued from : W. Giesbrecht in Systematik und Faunistik der Pelagischen Copepoden des Golfes von Neapel und der angrenzenden Meeres-Abschnitte. Fauna Flora Golf. Neapel, 1892, 19 , Atlas von 54 Tafeln. [Taf.18, Fiig.6]. Male: 6, A2 (anterior view).
|
 Issued from : W. Giesbrecht in Systematik und Faunistik der Pelagischen Copepoden des Golfes von Neapel und der angrenzenden Meeres-Abschnitte. Fauna Flora Golf. Neapel, 1892, 19 , Atlas von 54 Tafeln. [Taf.18, Fiig.19]. Male: 19, Md (anterior view).
|
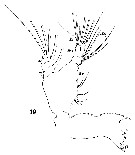
 Issued from : W. Giesbrecht in Systematik und Faunistik der Pelagischen Copepoden des Golfes von Neapel und der angrenzenden Meeres-Abschnitte. Fauna Flora Golf. Neapel, 1892, 19 , Atlas von 54 Tafeln. [Taf.18, Fiig.20]. Male: Mx1 (anterior view).
|
 Issued from : W. Giesbrecht in Systematik und Faunistik der Pelagischen Copepoden des Golfes von Neapel und der angrenzenden Meeres-Abschnitte. Fauna Flora Golf. Neapel, 1892, 19 , Atlas von 54 Tafeln. [Taf.17, Fiig.49]. Male: 49, P5 (anteruior view). Pd = right leg; Ps = left leg.
|
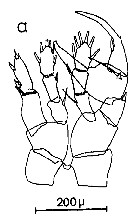
 issued from : P.I. Blades in Mar. Biol., 1977, 40. [p.59, Fig.2, B]. Centropages typicus, right geniculate A1 of male (segments 17, 18 and 19 illustrating serrated edges, hinge and sensory setae (sse). Scale = 0.200 mm.
|
 issued from : P.I. Blades in Mar. Biol., 1977, 40. [p.60, Fig.5]. Centropages typicus, P5 male. Diagramatic illustration of exopodal spines gripping spermatophore neck. (composite from photographs, not drawn to scale). ex: exopod; en: endopod; sn: spermatophore neck.
|
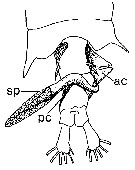 issued from : P.I. Blades in Mar. Biol., 1977, 40. [p.62,Fig. 7]. Centropages typicus, dorsal view of 5th metasome segment and urosome female carrying properly positioned, partially discherged spermatophore apparatus (modified from photographs). ac: anterior coupler; pc: posterior coupler; sp: spermatophore proper.
|
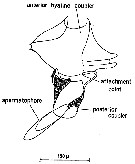
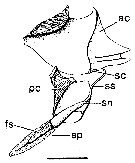 issued from : P.I. Blades in Mar. Biol., 1977, 40. [p.59, Fig.3]. Centropages typicus. Diagram of spermatophore complex, showing partially discharged spermatophore proper (modified from Lee, 1972, and photographs). ac: anterior coupler; pc: posterior coupler; sc: stalk-cup; ss: spermatophore stalk; sn: spermatophore neck; sp: spermatophore proper; fs: functional spermatozoa. Scale bar: 0.100 mm.
|
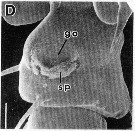 issued from : R.-M. Barthélémy in Thèse Doct. Univ. Provence (Aix-Marseille I), 1999. [Fig.9, D]. Female (from Gulf of Marseille, NW Mediterranean Sea): D, external ventral view genital double-somite. go = genital operculum; sp = seminal products (note: female fretilizated). Scale bar: 0.025 mm.
|
 issued from : R.-M. Barthélémy, C. Cuoc, D. Defaye, M. Brunet & J. Mazza in Phil. Trans. R. Soc. Lond., B, 1998, 353. [p.733, Fig.63]. Schematic representation of external genital area in the species studied; Dashed line, limit of the anterior pad and lateral thickenings; shading, posterior pad; dots, genital operculum.
|
 issued from : M. Anraku & M. Omori in Limnol. Oceanogr., 1963, 8. [p.122, Fig. 7, D] Centropages typicus (from Woods Hole): Cutting edge of Md. Nota: The cutting edge is provided with 8 teeth and 1 marginal spine on its innermost border. 6 teeth on the inner side diverge at the tip.Since there are no small processes on the teeth, the chewing parts are on the whole sharper than in Calanus.
|
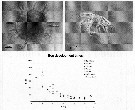
 Issued from : C. Castellani, A.J. Lindley, M. Wootton, C.M. Lee & R.R. Kirby in J. Mar. Biol. Ass. U.K., 2012, 92 (1). [p.101, Fig.2]. The chelae of male P5 of Centropages typicus from (a) eastern North Atlantic, (b) western North Atlantic and (c) Mediterranean. Above, A, drawings after Lee (1971) and below, B, the digitized images from specimens sampled in the same areas in 2005. Nota: The chela of the male P5 plays a key role in its reproduction, during transfer of the spermatophore. Chela morphology may be central to reproductive isolation between species since pheromonal cues do not appear sufficient to prevent heterospecific encounters between males and females (See Goetze, 2008). Therefore, morphological differences of this appendage may prevent breeding between individuals belonging to different populations and species (see Goetze, 2008). Lee (1971) suggested that morphological variation among the chela of the male P5 could be used as an indicator to reflect differentiation among specimens from overwintering centres in the eastern and western North Atlantic and the mediterranean Sea. The present study compares the morphology of the chela from samples collected in 2005, with similar measurements made by Lee in 1961 to determine if population differentiation observed by Lee (1971) has been maintened. In addition, complement morphological analyses with genetic variation to determine whether the morphological variations might represent genetically differentiated populations. It is tempting to speculate whether this morphological variation may reflect incipient speciation in C. typicus.
|
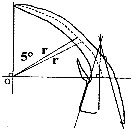 Issued from : C. Castellani, A.J. Lindley, M. Wootton, C.M. Lee & R.R. Kirby in J. Mar. Biol. Ass. U.K., 2012, 92 (1). [p.101, Fig.3]. The construction used to analyse the shape of the 3rd exopodite segment of the male P5 of Centropages typicus showing the radial length (r) and origin (O). Diagram modified from Lee (1971).
|
 Issued from : V.N. Andronov in Russian Acad. Sci. P.P. Shirshov Inst. Oceanol. Atlantic Branch, Kaliningrad, 2014. [p.29, Fig.4, 4]. Geniculate A1 of male Centropages typicus (original figure; position of ''joint'', site of antennule bents is indicated by arrow).
|
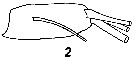 Issued from : V.N. Andronov in Russian Acad. Sci. P.P. Shirshov Inst. Oceanol. Atlantic Branch, Kaliningrad, 2014. [p.36, Fig.9, 2]. Centropages typicus after Lawson & Grice, 1970. 2, distal segment of exopod of A2.
|
 Issued from : V.N. Andronov in Russian Acad. Sci. P.P. Shirshov Inst. Oceanol. Atlantic Branch, Kaliningrad, 2014. [p.45, Fig.13, 6]. Centropages typicus after Sars, 1903. Female P1.
|
 Issued from : C.M. Lee in Bull. mar. Ecol., 1972, 8. [p.4, Text-Fig. 1 a]. Dorsal view of the fifth metasome segment and the urosome of females of Centropages typicus.
|
 Issued from : C.M. Lee in Bull. mar. Ecol., 1972, 8. [p.5, Text-Fig. 2 a]. P5 female of Centropages typicus.
|
 Issued from : C.M. Lee in Bull. mar. Ecol., 1972, 8. [p.4, Text-Fig. 1 a]. Dorsal view of the fifth metasome segment and the urosome of males of Centropages typicus.
|
 Issued from : C.M. Lee in Bull. mar. Ecol., 1972, 8. [p.5, Text-Fig. 2 a]. P5 male of Centropages typicus.
|
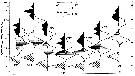
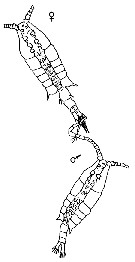
 Issued from : C.M. Lee in Bull. mar. Ecol., 1972, 8. [p.17, Text-Fig.14]. Centropages typicus: a diagram showing the deducede relative positions of the male (above) and female (below) during mating.
|
 Issued from : C.M. Lee in Bull. mar. Ecol., 1972, 8. [p.6, Text-Fig.3]. Centropages typicus: diagram of the spermatophore and two-part coupling devices. Dorsal view. Nota: The ripe male contains the spermatophore and its coupling device in the metasome where it lies in the spermatophore sac. The latter terminates in a short ductus ejaculatorius opening on the left side of the genital segment. The spermatophore sac forms the spermatophore while the couplers are produced by complex masses of cells called formers (Heberer, 1932). The testis is normally S-shaped and lies anterior to the formers and the couplers connecting with the spermatophore stalk via the vas deferenns. The club-shaped spermatophore contains two distinct regions. The proximal region contains the spermatozoa which are separated from the distal region by a thin membrane. The distal region contains cells whose secretion promotes swelling which voids the spermatozoa by expansion in the manner of a hypodermic syringe (Marshall & Orr, 1955). The coupling device is composed of the pale-brown posterior coupler which holds the posterior arm of the spermatophore stalk in a right lateral groove and the hyaline, lozenge-shaped, anterior coupler which holds the anterior arm of the spermatophore stalk. The anterior coupler is composed of a single plate with indentations at the tips of the lateral extensions while the posterior coupler is composed of two plates which fuse ventro-laterally on the left side. The two couplers are completely separate from each other. When attached, the spermatophore lies doesally and runs from left to right across the urosome of the female. It was discovered that the posterior coupler is cemented to the ventral and right lateral surfaces of the decond urosome segment by cement produced from subcuticular glands. The attacment point for the spermatophore stalk is at the tip of the right lateral protrusion of the segment. The spermatozoa enter the body of the female at this point. This is an unusual feature since the second urosome segment has not been considered as part of the genital complex. Using the notation of Giesbrecht (1892), the first female urosome segment, usually referred to as the genital segment, contains abdominal segments one to three. Thus the spermatophore stalk attaches to abdominal segment four. This raises the question of whether segment 4 should be considered part of the genital complex and referred to as the ''sub-genital segment'' or ''ancillary genital segment'' or even whether it is composed of abdominal segments three and four. Fleminger (1967) notes the occurrence of different spermatophore ''placements'' in Labidocera. Two types of ''placement'' were often found: Type 1 position showed the neck of the spermatophore in close proximity to the genital pore; Type 2 was usually attached to the left hand corner of the fifth thoracic segment. In general, type 2 only occurred if a spematophore was already placed in the type 1 position. Fleminger points out that a spermatophore in type 2 position is probably not functional. Clearly this is a different situation from that in Centropages typicus. The anterior hyaline coupler brings the tip of the spermatophore to bear on the attacment point by closing round the genital segment in a manner which is controlled by the spines of that segment. The anterior hyaline coupler is not physically attached to the urosome by cement. Following fertilization, the anterior hyaline coupler and the empty spermatophore are detached, leaving the posterior coupler cemented to the second urosome segment.
|
 Issued from : C.M. Lee in Bull. mar. Ecol., 1972, 8. [p.16, Text-Fig.13]. A plot of the vectors 1 and 2 generated in the principal components analysis, showing that the character data give a clear separation of the three species despite the high correlation and inferred functions of the various segments of P5 male of C. typicus, C. hamatus and C. chierchiae.
| | | | | Compl. Ref.: | | | Pearson, 1906 (p.21, Rem.); Carazzi & Grandori, 1912 (p.10, 38); Chatton, 1920 (p.17); Rose, 1924 d (p.478, Rem.); 1925 (p.152); Gurney, 1927 (p.150); Wilson, 1932 (p.23); 1942 a (p.177); Massuti Alzamora, 1942 (p.92); Oliveira, 1945 (p.191); Fleury, 1950 (p.47, fig.2); Raymont & Gauld, 1951 (p.681, respiratory rate); Gundersen, 1953 (p.1, 26, seasonal abundance); Østvedt, 1955 (p.15: Table 3, p.76); Duran, 1955 (p.52); Deevey, 1956 (p.127, tab.I V); 1960 (p.5, Table II, fig.7, 8, 9, 10: annual abundance, Rem.: p.19, fig.18, 19) ; Wickstead, 1962 (p.546, food & feeding); Marshall & Orr, 1962 (tab. 3); Curl, 1962 (p.183, Table I, CNP composition); 1962 a (p.181, Table II, C composition); Grice & Hart, 1962 (p.287, table 4: abundance); Gaudy, 1962 (p.93, 99, Rem.: p.109, Tableau 9: development, Tableau 9: development); Duran, 1963 (p.21, Rem.); Giron-Reguer, 1963 (p.49); V.N. Greze, 1963 a (tabl.2); Shmeleva, 1963 (p.141); Grice, 1963 a (p.496); Bary, 1963 a (p.1519, Table 1); Mazza, 1964 (p.293, weight); Anraku, 1964 (p.221, feeding, animal diet); Bary, 1964 (p.183, T-diagram-occurrences); Martin, 1965 (p.188); Grice & Hulsemann, 1965 (p.224); Bodo & al., 1965 (p.219, annual cycle); Shmeleva, 1965 b (p.1350, lengths-volume -weight relation); Pavlova, 1966 (p.44); Chakroun, 1966 (p.67, Tableau); Mazza, 1966 (p.71); 1967 (p.353: Rem., p. 377, 399, fig.76); Bascheri & Mazza, 1966 (p.413, Tableau II, chemical composition); Ehrhardt, 1967 (p.740, fig.15, geographic distribution, Rem.); Matthews, 1967 (p.159, Table 1, Rem.); Séguin, 1968 (p.488); Evans, 1968 (p.12); Singarajah, 1969 (p.171, Table II, behaviour); Moraitou-Apostolopoulou, 1969 (p.2); Champalbert, 1969 a (p.616); Lawson & Grice, 1970 (p.187, development); Carli, 1971 (p.372, tab.1); Gaudy, 1971 (p.65, Tabl. 1, fig.1, egg production); Paulmier, 1971 (p.168); Gamulin, 1971 (p.381, tab.2); Salah, 1971 (p.319); Razouls S., 1972 b (p.2, respiration); Champalbert & Gaudy, 1972 (p.159, respiration vs temperature); Gaudy, 1972 (p.175, 180, figs.1-6, annual cycle); Lefèvre-Lehoërff, 1972 (p.1681); Della Croce & al., 1972 (p.1, fig.2, Rem.); Bainbridge & Forsyth, 1972 (p.21, Table I: indictor species, Table II: correlation, annual fluctuations Pl.XIV: seasonal abundance); Apostolopoulou, 1972 (p.328, 356); S. Razouls, 1972 (p.95, metabolism); 1972 a (p.145, respiration); Nival & al., 1972 (p.63, respiration); Valentin, 1972 (p.349, figs.9, 10, 11, 25, egg production); Boucher & Thiriot, 1972 (p.47, Tableau 4); Eriksson, 1973 b (p.113, 118); C. Razouls & Guinness, 1973 (p.413, size dimensions & temperature/phytoplankton cells); P. Nival & S. Nival, 1973 (p.135, mouth parts, grazing); Desgouille, 1973 (p.1, 131, Rem.: p.138); Guglielmo, 1973 (p.399); Champalbert & al., 1973 (p.529, CHN composition); Gaudy, 1973 (p.267, Table I, II, fig.1,5, respiration); C. Razouls, 1973 a (p.361, annual abundance); 1974 (p.51, life history); S. Razouls, 1974 (147, oxygen rate); de Bovée, 1974 (p.109, 124); Nival & al., 1974 (p.231, respiration & excration); Le Ruyet-Person, 1975 (p.203, rearing); Le Ruyet-Person & al., 1975 (p.283, comparative biology, metabolism activity); S. Razouls, 1975 (p.297, egg production); Vives & al., 1975 (p.47, tab.II, III, IV, p.48: Rem.); Mackas & Bohrer, 1976 (p.77, fig.3, gut contents); Boucher & al., 1976 (p.61, elementary composition); Gaudy, 1976 (p.77, fig.5, Table I, II, III, production); C. Razouls & S. Razouls, 1976 (p.281, caloricity, growth); S. Razouls, 1977 (p.265, caloricity); Sameoto, 1977 (p.1, fig.12, abundance); Beers & al., 1977 (p.66, Rem.: p.77, Cu pollution); Blades, 1977 (p.57, , mating); Colebrook, 1978 (tab.1); Knatz, 1978 (p.68, Table 1, abundance, %); Comaschi Scaramuzza, 1978 (p.17); Dagg, 1978 (p.183, egg production); Conover, 1978 (p.66, 75, feeding); Razouls S. & Apostolopoulou, 1978 (p.13, metabolism); Fernandez, 1978 (p.97, metabolism/food, Rem.: Table 19); Tomasini & Mazza, 1978 (p.154, feeding); Dagg & Grill, 1980 (p.597, feeding on natural seawater); Pipe & Coombs, 1980 (p.223, Table II, vertical occurrence); Vaissière & Séguin, 1980 (p.23, tab.2); Gallo, 1981 (p.847); Castel & Courties, 1982 (p.417, Table II, spatial distribution); Vidal & Whitledge, 1982 (p.77, respiration v.s. latitude); Kovalev & Shmeleva, 1982 (p.84); Vives, 1982 (p.292); Turner & Dagg, 1983 (p.11, fig.12, 18, vertical distribution); Dagg, 1983 (p.63, feeding behavior); Jacoby & Youngbluth, 1983 (p.84, Table 4, Rem: mating); Cowles & Strickler, 1983 (p.106, feeding behaviour-cinematography); Rivière, 1983 (p.19, enzymes); Rivière & Kerambrun, 1983 (p.25, enzymes); Tremblay & Anderson, 1984 (p.4); Baars & Fransz, 1984 (p.120, Table 1, grazing); Baars & Oosterhuis, 1984 (p.97, diurnal feeding rhythms); Fransz & al., 1984 (p.86); Strickler, 1984 (p.187, feeding behavior); Head & al., 1984 (p.543, feeding rhythms/enzyme activity); Boucher, 1984 (p.469, spatial distribution/hydrological front); Sameoto, 1984 (p.767, vertical migration); Miller & al., 1984 (p.1274, Rem.: p.1278, moltin rates); Scotto di Carlo & al., 1984 (1042); Gaudy, 1984 a (p.200, life history, Rem. p.210: A1); Regner, 1985 (p.11, Rem.: p.32); Jansa, 1985 (p.108, Tabl.I, , II, III, IV, V); Colebrook, 1985 (p.261, tab.1); Turner & al., 1985 (p.1, feeding); Williams & Collins, 1985 (p.28); Smith & Lane, 1985 (p.153, egg production, development rates); Gaudy, 1985 (p.279, Tab.3); Moraitou-Apostolopoulou, 1985 (p.303, occurrence/abundance in E Mediterranean Sea, Rem.: p.315); Légier-Visser & al., 1986 (p.529, mechanoreception); Robinson & Hunt, 1986 (p.791, Table 1, 2, fig.2); Brylinski, 1986 (p.457, spatial variations); Robinson & al., 1986 (p.201, seasonal distribution); Ibanez & Boucher, 1987 (p.205, Tableau, fig.4, 6, 7, hydrological fronts); Boucher & al., 1987 (p.133, spatial distribution/physical structure); Smith & Lane, 1987 (p.305, life history vs diatom bloom); Quisthoudt & al., 1987 (p.995, spatial distribution); Comaschi Scaramuzza, 1987 (tab.1); Tiselius, 1988 (p.215, grazing); Gorsky & al., 1988 (p.133, Table I, C-N composition); Ianora & Scotto di Carlo, 1988 (p.247, egg production); Wiadnyana & Rassoulzadegan, 1989 (p.37, feeding); McLaren & al., 1989 (p.560, life history, annual production); S. Nival & al., 1990 (p.535, spawning rate); Saiz & Alcaraz, 1990 (p.665, feeding); Sciandra & al., 1990 (p.549, reproduction); Ianora, 1990 (p.885, egg production); Ianora & Buttino, 1990 (p.473, seasonal cycle & egg production); Stoecker & McDowell Capuzzo, 1990 (p.891, feeding); Tiselius & Jonsson, 1990 (p.23, table 1-4, feeding behaviour); Kouwenberg & Razouls, 1990 (p.23, climatic change); Krsinic, 1990 (p.337, Table I, vertical distribution); Meise-Munns & al., 1990 (p.225, long-term change abundance); Tester & Turner, 1990 (p.169, egg production); Fransz & al., 1991 (p.6 & suiv.); Morales C.E. & al., 1991 (p.455, Table I, grazing); Nielsen, 1991 (p.1091, egg production); Gifford, 1991 (p.8, Table 2, diet); Hay & al., 1991 (p.1453, Table 2, 5); W.T. Peterson & al., 1991 (p.131, egg production, growth rates, secondary production); Fryd & al., 1991 (p.683, development, growth, egg production); C. Razouls & S. Razouls, 1992 (p.259, life history); Norrbin, 1992 (p.6); Huntley & Lopez, 1992 (p.201, Table B1, growth rate, temperature-dependent production); Ianora & al., 1992 (p.1483, seasonal fecundity, hatching success); Bautista & Harris, 1992 (p.41, ingestion rate, gut contents); Saiz & al., 1992 (p.49, feeding); Carlotti & S. Nival, 1992 (p.235, development & mortality); Seguin & al., 1993 (p.23); Guerin-Ancey & David, 1993 (p.119, table 1, biovolume, vertical distribution); Kouwenberg, 1993 (p.215, fig.3, seasonal abundance); 1993 a (p.281, fig.3, 4, sex ratio); Fromentin & al., 1993 (p.285, Ligurian transect abundance); Hays & al., 1994 (tab.1); Munk & Nielsen, 1994 (p.1225, fig.4, predation); Kouwenberg, 1994 (tab.1); Hansen & al., 1994 (p.395, Table 1, selectivity); Krause & al., 1995 (p.81, Rem.: p.139); Hajderi, 1995 (p.542); Southward & al., 1995 (p.127, fig. 2); Madhupratap & al., 1996 (p.77, Table 2: resting eggs); Marcus, 1996 (p.143); Miralto & al., 1996 (p.1033, egg production); Fernandez de Puelles & al., 1996 (p.97, occurrence: p.101); Hays & al., 1996 (p.159, Rem.: Herring correlation); Ban S, Burns C. & al., 1997 (p.287, Table 1, 2, feeding, reproduction); Carlotti & al., 1997 (p.1143, egg production, fecal pellet production); Falkenhaug & al., 1997 (p.449, spatio-temporal pattern); Mauchline, 1998 (p.508: Rem., tab.15, 17, 20, 21, 26, 27, 29, 30, 33, 40, 45, 46, 47, 48, 51, 53, 56, 58, 61, 63, 64, 78); Hure & Krsinic, 1998 (p.101); Kouwenberg, 1998 (p.203, seasonal variation, fig.3: global change); Gilabert & Moreno, 1998 (tab.1, 2); Suarez-Morales & Gasca, 1998 a (p109); Reid & Hunt, 1998 (p.310, figs.2, 3, Rem.); Sameoto & al., 1998 (p.1, 7, figs.11, spatial distribution); Capparoy & al., 1998 (p.109, feeding behavior vs. sea water agitation); Siokou-Frangou, 1999 (p.476); Halvorsen & Tande, 1999 (p.279, tab.2, 3, Rem.: p.282); Harvey & al., 1999 (p.1, 49: Appendix 5, in ballast water vessel); Seridji & Hafferssas, 2000 (tab.1); Sautour & al., 2000 (p.531, Table II, abundance); El-Sherif & Aboul Ezz, 2000 (p.61, Table 3: occurrence); Plounevez & Champalbert, 2000 (p.175, Table III, IV, V, abundance vs fish, Rem.: p.185); d'Elbée, 2001 (tabl.1); Bonnet & Carlotti, 2001 (p.133, development, egg production vs. food types); Calbet & al., 2001 (p.319, Fig.7); Halsband-Linke & al., 2001 (p.597, seasonal cycle, egg production); Halsband & Hirche, 2001 (p.219, annual reproduction cycle); Holmes, 2001 (p.22, Rem.); Fransz & Gonzalez, 2001 (p.255, tab.1); Weikert & al., 2001 (p.227, tab.4, Rem.); Bressan & Moro, 2002 (tab.2); Sameoto & al., 2002 (p.12); Beaugrand & al., 2002 (p.1692); Zerouali & Melhaoui, 2002 (p.91, Tableau I, fig.5); Beaugrand & al., 2002 (p.179, figs.5, 6); Cohen & Forward, 2002 (p.307); Lindley & Reid, 2002 (p.153, abundance veriation); Halsband-Lenk & al., 2002 (p.121, t°C vs. development, comparison with congeners ); Gaudy & al., 2003 (p.357, tab.1); Vukanic, 2003 (139, tab.1); Titelman & Kiørboe, 2003 a (p.137, nauplius behaviour); Fernandez de Puelles & al., 2003 (p.123, fig.5); Bode & al., 2003 (p.85, Table 1, abundance); Daly Yahia & al., 2004 (p.366, fig.4, tab.1); Di Capua & Mazzocchi, 2004 (p.632); Bonnet & Frid, 2004 (p.485, fig.5); Fernandez de Puelles & al., 2004 (p.654, fig.7); Halsband-Lenk & al., 2004 (p.709, figs.6,7); CPR, 2004 (p.52, fig.148); Vukanic & Vukanic, 2004 (p.9, tab.3); Fernandez & al., 2004 (p.501, tab.5); Vallet & Dauvin, 2004 (p.539, tab.2); Lopez-Urrutia & al., 2004 (p.303, clearance rate, predation); Molinero & al., 2005 (p.156); Uriarte & Villate, 2005 (p.863, tab.I); Benzid & al., 2005 (p.71, Rem.: serotonin in nervous system Manning & Bucklin, 2005 (p.233, Table 1, figs.5, 12); Rawlinson & al., 2005 (p.205, tidal exchange); Waggett, 2005 (p.17, Table 3.3, behaviour); Molinero & al;, 2005 (p.640, climate forcing); Bagøien & Kiorboe, 2005 (p.105, mate-behaviour, pheromone signal); Isari & al., 2006 (p.241, tab.II); Marques & al., 2006 (p.297, tab.III); Zervoudaki & al., 2006 (p.149, Table I); Knotz & al., 2006 (p.406, enzymology); De Olazabal & al., 2006 (p.966); Durbin & Casas, 2006 (p.2537, Table 2a, 2b); Bonnet & al., 2007 (p.233, Rem: seasonal dynamics); Mazzocchi & al., 2007 (p.214, temporal variability); Fernandez de Puelles & al., 2007 (p.338, fig.7); Gaudy & Thibault-Botha, 2007 (p.84, Tab.1, Rem.: metabolism); Carlotti & al., 2007 (p.164); Ianora & al., 2007 (p.195); Wesche & al., 2007 (p.1309); Alcaraz & al., 2007 (p.121); Beaugrand & al., 2007 (p.259); Valdés & al., 2007 (p.104: tab.1); Head & Sameoto, 2007 (p.2686, abundance vs interdecadal variability); Titelman & al., 2007 (p.1023, Table I, Rem: mating); Durbin & Kane, 2007 (p.249, Rem.); Busatto, 2007 (p.26, Tab.2); Khelifi-Touhami & al., 2007 (p.327, Table 1); Olivotto & al., 2008 (p.211, aquaculture); Cabal & al., 2008 (289, Table 1); Goetze, 2008 (p.433: mating); Raybaud & al., 2008 (p.1765, Table A1); Waggett & Buskey, 2008 (p.111, fig.3, Table 1); Gugliandolo & al., 2008 (p.580, bacteria assiociated); Rossi, 2008 (p.90: Tableau XII); Schmitt & al., 2008 (p.407, long-term time series); Molinero & al., 2009 (p.44: Table 1, p.49: Table 2, p.50: Table 3); Labat & al., 2009 (p.1747, Table 2); DFO, 2009 (p.1, Rem. p.11, fig. 13, seasonal variability); Telesh & al., 2009 (p.18: Table 2.1); Calliari & Tiselius, 2009 (p.111); Brylinski, 2009 (p.253: table 1, p.255: Rem.); Ji & al., 2009 (p.187, life history, spatiotemporal distribution); Brugnano & al., 2010 (p.312, Table 2, 3, fig.8); Eloire & al., 2010 (p.657, Table II, temporal variability); Drira & al., 2010 (p.145, Tanl.2); Pershing & al., 2010 (p.1661, interannual variability).; Hidalgo & al., 2010 (p.2089, Table 2); Mazzocchi & Di Capua, 2010 (p.424); Dvoretsky & Dvoretsky, 2010 (p.991, Table 2); Yen & Lasley, 2010 (p.177, Rem.: p.183, mating): Hafferssas & al., 2010 (p.1281, Table III, abundance vs spatial distribution); Nowaczyk & al; 2011 (p.2159, Table 2); Pepin & al., 2011 (p.273, Table 2, seasonal abundance); Selifonova, 2011 a (p.77, Table 1, alien species in Black Sea); S.C. Marques & al., 2011 (p.59, Table 1); Fileman & al., 2011 (p.403, abundance vs bloom condition); Mazzocchi & al., 2011 (p.1163, Table I, II, fig.6, long-term time-series 1984-2006); Zervoudaki & al., 2011 (p.45, fig.3, 5, Table 3, abundance: Turkish Straits); Isari & al., 2011 (p.51, Table 2, abundance vs distribution); Turner & al., 2011 (p.1066, Table II, abundance 1998-2008); Van Ginderdeuren & al., 2012 (p.3, Table 1); Delpy & al., 2012 (p.1921, Table 2); Shiganova & al., 2012 (p.61, Table 4); Zizah & al., 2012 (p.79, Tableau I, Rem.p.86, 89); Brugnano & al., 2012 (p.207, Table 3); Sigurdardottir, 2012 (p.1, Table 2.3); Alvarez-Fernandez & al., 2012 (p.21, Rem.: Table 1); Miloslavic & al., 2012 (p.165, Table 2, transect distribution); Vidjak & al., 2012 (p.243, Rem.: p.254); Johnson C & al., 2012 (p.1, 15, fig. 24a, 24b, interannual variarions); Aubry & al., 2012 (p.125, fig.6, 8 b, interannual variation); Dvoretsky & Dvoretsky, 2012 (p.1321, Table 2, 3, 5, abundance, biomass, production); McGinty & al., 2012 (p.122, time series abundance); Drillet & al., 2012 (p.155, Table 1, culture); Buttino & al., 2012 (p.247, culture); Krsinic & Grbec, 2012 (p.57, 61: abundance); Salah S. & al., 2012 (p.155, Tableau 1); Mazzocchi & al., 2012 (p.135, annual abundance 1984-2006); Oechsler-Christensen & al., 2012 (p.161, grazing vs phytoplankton pigments); Rekik & al., 2012 (p.336, Table 1, abundance); Stegert & al., 2012 (p.18, abundance vs temperature, life-history: modeling study); Gusmao & al., 2013 (p.279, Table 4, sex ratio); Belmonte & al., 2013 (p.222, Table 2, abundance vs stations); McConville & al., 2013 (p.428, egg production vs Co2 effects); Cole & al., 2013 (p.6646, microplastic ingestion); Kürten & al., 2013 (p.167, Table 1, C:N, fatty acid); Kiørboe & Jiang, 2013 (p.3, fig.2, feeding behaviour, fluid flow); Lidvanov & al., 2013 (p.290, Table 2, % composition); Terbiyik Kurt & Polat, 2013 (p.1163, Rem.: p.1172); Barton & al., 2013 (p.522, Table 1: metabolism, diapause, population dynamic, feeding mode, biogeo); Siokou & al., 2013 (p.1313, fig.4, 8, biomass, vertical distribution); Pansera & al., 2014 (p.221, Table 2, abundance); Fernandez de Puelles & al., 2014 (p.82, Table 3, seasonal abundance); Mazzocchi & al., 2014 (p.64, Table 3, 4, 5, spatial & seasonal composition %); Zaafa & al., 2014 (p.67, Table I, occurrence): Benedetti & al., 2016 (p.159, Table I, fig.1, functional characters); Ben Ltaief & al., 2017 (p.1, Table III, Summer relative abundance) ; Marques-Rojas & Zoppi de Roa, 2017 (p.495, Table 1); Hansen B.W. & al., 2017 (p.984, pH effects); El Arraj & al., 2017 (p.272, table 1, 2, spatial distribution); Benedetti & al., 2018 (p.1, Fig.2: ecological functional group); Chaouadi & Hafferssas, 2018 (p.913, Table II, III, fig.4, 5: occurrence, abundance, seasonal variation); Belmonte, 2018 (p.273, Table I: Italian zones) ; Richirt & al., 2019 (p.3, Table 1, fig.2, 3, 4, 5, abundance changes vs years 1998-2014, table 2: diversity index) | | | | NZ: | 9 + 1 doubtful | | |
|
Distribution map of Centropages typicus by geographical zones
|
| | | | | | | | |  Chart of 1996 Chart of 1996 | |
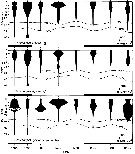
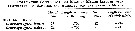
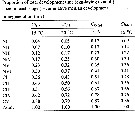
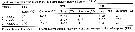
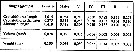 issued from : A.A. Shmeleva in Bull. Inst. Oceanogr., Monaco, 1965, 65 (n°1351). [Table 6: 27 ]. Centropages typicus (from South Adriatic). issued from : A.A. Shmeleva in Bull. Inst. Oceanogr., Monaco, 1965, 65 (n°1351). [Table 6: 27 ]. Centropages typicus (from South Adriatic).
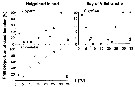
Dimensions, volume and Weight wet. Means for 50-60 specimens. Volume and weight calculated by geometrical method. Assumed that the specific gravity of the Copepod body is equal to 1, then the volume will correspond to the weight. |
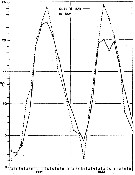
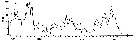
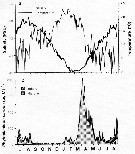
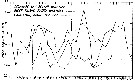
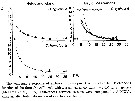
 issued from : G.B. Deevey in Bull. Bingham Oceanogr. Coll., 1960 (2). [p.22, Fig.10]. issued from : G.B. Deevey in Bull. Bingham Oceanogr. Coll., 1960 (2). [p.22, Fig.10].
Variations in length (from the top of the head to the base of the caudal rami) of Centropages typicus females (black color), males (white color) and copepodid stages V and IV (hatching) in the Delaware Bay (NW Atlantic Ocean).
Compare the length variations with the temperature variations during 1931 and 1932 (p. 10, Fig.2)
Nota: Deevey (p.21) estimates the succession of at least five or six generations produced by year. There were several rapidly developing generations during the warmer months. |
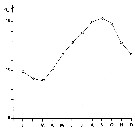
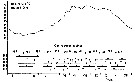
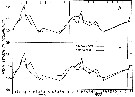
 issued from : G.B. Deevey in Bull. Bingham Oceanogr. Coll., 1960 (2). [p.10, Fig.2]. issued from : G.B. Deevey in Bull. Bingham Oceanogr. Coll., 1960 (2). [p.10, Fig.2].
Average surface temperatures at the stations in and outside Delaware Bay (NW Atlantic) from 1931 through November 1932.
The surface temperature range in the Bay varied from less than 2°C in the winter to 24° or 25°C in the summer, and more extreme than that outside the Bay, where temperatures ranged from over 2°C to approximately 22°C, but the cycles varied considerably from year to year (see p.10, figure 2). Salinity outside the Bay varied from a minimum of 30 p.1000 to a maximum of 32.88 p.1000. In the Bay it ranged from 22.8 - 32.25 p.1000. Thus the salinity was over 30 p.1000 at the stations outside the Bay while the range at the mouth of the Bay anda t the stations inside was such as to exlude ordinarily from the Bay some of the neritic species common in the outside waters. |
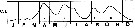
 issued from : P.S.B. Digby in J. mar. biol. Ass. U.K., 1950, 29. [p.401, Fig.4]. issued from : P.S.B. Digby in J. mar. biol. Ass. U.K., 1950, 29. [p.401, Fig.4].
Life history Centropages typicus at station L4 off 5 miles from Plymouth, (English Channel).
A: abundance of stages; B: size-groups of adult females; C: suggested interpretation.
After Digby, the data are not sufficient to separate all generations, but the general similarity between the fragmentary picture obtained suggest the occurrence and course of generations to be somewhat similar to Temora longicornis and Acartia clausi.
See Temperature variations at station L4 during the same period (January 1947 to February 1948 (p.397, Fig.1) |
 issued from : P.S.B. Digby in J. mar. biol. Ass. U.K., 1950, 29. [p.397, Fig.1]. issued from : P.S.B. Digby in J. mar. biol. Ass. U.K., 1950, 29. [p.397, Fig.1].
Temperature of the water at 1 and 30 m depth at L4 (5 miles from Plymouth, English Channel) during 1947. x: surface readings from closer in-shore. |
 issued from : J. Le Ruyet-Person, C. Razouls & S. Razouls in Vie Milieu, 1975, XXV (2B). [p.301, Fig.4]. issued from : J. Le Ruyet-Person, C. Razouls & S. Razouls in Vie Milieu, 1975, XXV (2B). [p.301, Fig.4].
Life history of Centropages typicus at Roscoff (English Channel) during the year.
Quantitative variations of number of females and males during the year. Number of generations (or main cohorts) is estmated to five for the year in relation to the temperature (See p.285, Fig.1), but this species is less abundant than C. hamatus and shows probably five geherations. |
 issued from : J. Le Ruyet-Person, C. Razouls & S. Razouls inVie Milieu, 1975, XXV (2B). [p.285, Fig.1]. issued from : J. Le Ruyet-Person, C. Razouls & S. Razouls inVie Milieu, 1975, XXV (2B). [p.285, Fig.1].
Temperature variations of surface water (mean by month) during the year at Roscoff (Western English Channel) |
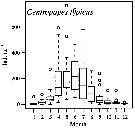
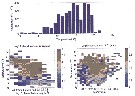
 issued from : R. Gaudy in Rec. Trav. St. Mar. End., 1962, 27 (42). [p.140, Fig.3]. issued from : R. Gaudy in Rec. Trav. St. Mar. End., 1962, 27 (42). [p.140, Fig.3].
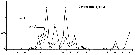
Life history of Centropages typicus in the Gulf of Marseille (43°15'30''N, 5°17'02''E) during 1960-1961.
A: Histogramm of size classes (cephalothoracic length of females from 1 to 9); B: Number of adults (males and females) and nauplii by haul; C: Percentage of the different stages (N: naulii, 1-5: copepodites, 6: adults); D: Interpretation of successive generations.
Class of sizes (in mm): 1 = 0.900-0.949; 2 = 0.950-0.999; 3: 1.000-1.049; 4 = 1.050-1.099; 5: 1.100-1.149; 6 = 1.150-1.199; 7 = 1.200-1.249; 8 = 1.250-1.299; 9 = 1.300-1.352.
Gaudy (p.138) points to 5 generations by year in the Gulf of Marseille (NW Mediterranean Sea). |
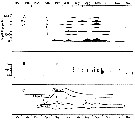
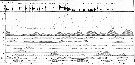
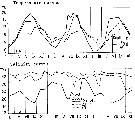
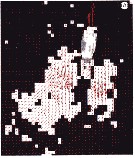
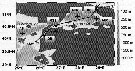
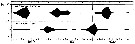
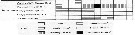
 issued from : J.T. Turner & M.J. Dagg in Biol. Oceanogr., 1983, 3 (1). [p.12, Fig.5]. issued from : J.T. Turner & M.J. Dagg in Biol. Oceanogr., 1983, 3 (1). [p.12, Fig.5].
vertical and inshore-offshore distributions of Centropages typicus in relation to the 15°C isotherm at pump stations on the Long Island (NW Atlantic) transect (40°31.8'-39°53.2' N, 72°23.6'-72°59.4' W; October 1978).
Station numbers are given on the top axis, and dark horizontal bars identify stations sampled at night.
Nota: This species was collected largely from depths above the thermocline, and no consistent patterns indicative of vertical migration were apparent.. The species were most abundant at station 1 (± 37 km from shore), and they progressively declined in abundance in a seaward direction. |
 issued from : J.T. Turner & M.J. Dagg in Biol. Oceanogr., 1983, 3 (1). [p.7, Fig.2]. issued from : J.T. Turner & M.J. Dagg in Biol. Oceanogr., 1983, 3 (1). [p.7, Fig.2].
Vertical temperature structure during the Long Island (NW Atlantic) transect (40°31.8'-39°53.2' N, 72°23.6'-72°59.4' W; Oxtober 1978). |
 issued from : J.T. Turner & M.J. Dagg in Biol. Oceanogr., 1983, 3 (1). [p.25, Fig.12]. issued from : J.T. Turner & M.J. Dagg in Biol. Oceanogr., 1983, 3 (1). [p.25, Fig.12].
Vertical distribution of Centropages typicus in relation to positions of the 15°C and 10°C water at the time of sampling during the Long Island time series (40°26'N, 72°18'W; October 1978).
Sampling times are given on the bottom axis, and dark horizontal bars identify periods of darkness. |
 issued from : A. Ianora & I. Buttino in J. Plankton Res., 1990, 123 (3). [p.475, Fig.1, B]. issued from : A. Ianora & I. Buttino in J. Plankton Res., 1990, 123 (3). [p.475, Fig.1, B].
Centropages typicus females from Gulf of Naples: Seasonal fluctuations in egg production rates after 24 h. Mean values obtained by averaging egg data for all females (continuous line), including those that had not laid eggs, and only in cases where egg deposition had occurred (dashed line). |
 issued from : C. Razouls in Cah. Biol. Mar., 1974, 15. [p74, Fig.7] issued from : C. Razouls in Cah. Biol. Mar., 1974, 15. [p74, Fig.7]
Life history pattern of Centropages typicus at Banyuls-sur-Mer (western Gulf of Lion, Mediterranean Sea) from 1965 to 1969 in relation to the mean temperature (depth 50 m). Arrowhead denote the maximum of adults; J in days
Nota: The number of generations is etimated betwenn 6 or 7 according to the years. A partir from the variations of copepodites (Ci to C5) and adults, the class sizes and the development times. |
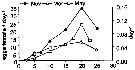
 issued from : C. Razouls & C. Guiness in Cah. Biol. Mar., 1973, 14. [p.422, Fig.6]. issued from : C. Razouls & C. Guiness in Cah. Biol. Mar., 1973, 14. [p.422, Fig.6].
Cephalothoracic length variations (in micrometers) during 20 months in relation with the temperature (mean 0-30 m; depth 50 m) and quantitative variations of phytoplancton at Banyuls-sur-Mer (western Gulf of Lion, Mediterranean Sea).
A: number of cells per liter of peridinians and diatomacae; B: number of cells of nannoplankton forms.
Nota: Using total and partial correlation, the relation between length cephalothoracic and temperature is very high (probability 95-99 %) whereas the correlations with the phytoplankton is not significant. The temperaure preponderance masks the effects of trophic factor, and probaly the omnivorous mode of food of Centropages typicus. |
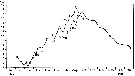
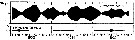
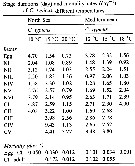
 issued from : R. Gaudy in Tethys, 1972, 4 (1). [p.237, Fig.36]. issued from : R. Gaudy in Tethys, 1972, 4 (1). [p.237, Fig.36].
Schematic quantitative abundance of Centropages typicus in the Gulf of Marseille (Mediterranean Sea) established from samples during the period between ending 1964 to ending 1967.
Gaudy (p.188) points to 5 generations per year. |
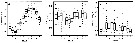
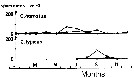 issued from : S. Eriksson in ZOON, 1976, 4. [p.157, Fig.2]. issued from : S. Eriksson in ZOON, 1976, 4. [p.157, Fig.2].
Seasonal distribution of neritic copepod Centropages hamatus and C. typicus off Gothenburg (Göteborg), The Skattegatt. (Monthly means for adult specimens during 1968-1973; point : inshore, depth = 10 m; x: offshore, depth > 40 m.
The main occurrence of the two congeneric species are separated in time: C. hamatus June to July and C. typicus September. The first species has a wide optimum range (3 to 19°C) and the second species a narrow one (12 to 16°C). |
 issued from : S. Eriksson in ZOON, 1976, 4. [p.158, Fig.3, c-d]. issued from : S. Eriksson in ZOON, 1976, 4. [p.158, Fig.3, c-d].
Seasonal distribution of neritic copepods Centropages typicus and C. hamatus off Gothenburg, The Skattegatt.
Surface salinity of the investigation area varies around 25 p.1000 and the deep water slinity around 34 p.1000. There is a temperature stratification with surface water warmer than 10°C from May to October with maximum of 20°C in August. The coldest period is January to March with surface temperatures of 1-2°C. The deep water ranges between 5 and 10°C.
The hauls were horizontal at 2, 20, and 40 m.
Limits subjectively regarded as the optimum temperature range: 12-16°C for C. typicus probably allochtonous, and 3-19°C for C. hamatus. |
 issued from : S. Eriksson in Mar. Biol., 1974, 26. [p.320, Figs. 2-3] issued from : S. Eriksson in Mar. Biol., 1974, 26. [p.320, Figs. 2-3]
Salinity and temperature curves for main series at offshore station H6 (11°30' N, 57°40'.5 E, The Kattegatt) from March 1968 to November 1970. |
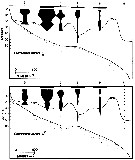
 issued from : I.A. McLaren, M.J. Tremblay, C.J. Corkett & J.C. Roff in Can. J. Fish. Aquat. Sci., 1989, 46. [p.569, Fig.8]. issued from : I.A. McLaren, M.J. Tremblay, C.J. Corkett & J.C. Roff in Can. J. Fish. Aquat. Sci., 1989, 46. [p.569, Fig.8].
Annual cycle of Centropages typicus on Emerald Bank (43°30'N, 63°00'W), 1979-80.
Successive generations labelled Go, etc. For convenience, Nov. 1979 sample placed at end (after 1980). Upper panel: abundances as proportions of stages (AD: adults; males clear section of adult bar). Lower panel: size-frequencies of adult females as proportions.
The samples were obtained by vertical hauls from near bottom (usually 25 m) by Hensen-type nets (one of 0.250 mm mesh and the other of 0.064 mm mesh). |
 issued from : I.A. McLaren, M.J. Tremblay, C.J. Corkett & J.C. Roff in Can. J. Fish. Aquat. Sci., 1989, 46. [p.569, Fig.9]. issued from : I.A. McLaren, M.J. Tremblay, C.J. Corkett & J.C. Roff in Can. J. Fish. Aquat. Sci., 1989, 46. [p.569, Fig.9].
Proportions of stages of Centropages typicus on Browns Bank (42°35'N, 65°50'W), 1979.
Adult males are clear portion of bar.
The samples wereo btained by vertical hauls from near bottom (usually 70-80 m) by Hensen-type nets (one of 0.202 mm mesh and the other of 0.064 mm mesh). |
 issued from : P.I. Blades in Mar. Biol., 1977, 40. [p.60, Fig.4]. issued from : P.I. Blades in Mar. Biol., 1977, 40. [p.60, Fig.4].
Centropages typicus. Precopulation. Right A1 male grip on female caudal setae (ventral view). |
 issued from : P.I. Blades in Mar. Biol., 1977, 40. [p.61, Fig.6, C]. issued from : P.I. Blades in Mar. Biol., 1977, 40. [p.61, Fig.6, C].
Centropages typicus. Copulatory position. ventral view of female, right lateral view of male.
Scale bar = 1 mm. |
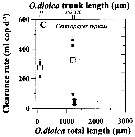 Issued from : A. Lopez-Urrutia, R.P. Harris & T. Smith in Limnol. Oceanogr., 2004, 49 (1). [p.305, Fig.3]. Issued from : A. Lopez-Urrutia, R.P. Harris & T. Smith in Limnol. Oceanogr., 2004, 49 (1). [p.305, Fig.3].
Clearance rate of (C) Centropages typicus from off Plymouth (English Channel), in relation to the size of Oikopleura dioica (Appendicularians).
The first x-axis data points represent the diameter of O. dioica eggs. Solid symbols represent the measured clearance rates and open symbols represent their mean. Vertical and horizontal error bars are the standard deviation of clearance rates and O. dioica size, respectively.
O. dioica cultures were maintened and experiments conducted in a constant temperature room at 15°C with a simulated 12:12 day: night cycle. Cohorts of cultured O. dioica , maintened according to Fenaux and Gorsky, 1985, were used to obtain eggs and juvenile appendicularians. |
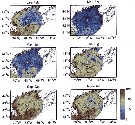
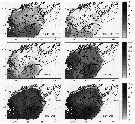 Issued from : R. Ji, C.S. Davis, C. Chen & R.C. Beardsley in Mar. Ecol. Prog. Ser., 2009, 384. [p.190, Fig.3]. Issued from : R. Ji, C.S. Davis, C. Chen & R.C. Beardsley in Mar. Ecol. Prog. Ser., 2009, 384. [p.190, Fig.3].
Centropages typicus. Bimonthly climatology for the distribution of adult abundance (vertically averaged, no. m3) in the Gulf of Maine-Georges Bank region. |
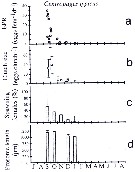 issued from : C. Halsband & H.J. Hirche in Mar. Ecol. Prog. Ser., 2001, 209. [p.223, Fig.4]. issued from : C. Halsband & H.J. Hirche in Mar. Ecol. Prog. Ser., 2001, 209. [p.223, Fig.4].
Centropages typicus. Reproductive parameters at Helgoland Roads.
(a) Egg production rate; (b) clutch size, weekly means ± SD; egg production rate; (c) proportion of females spawning; (d) prosome length. |
 issued from : C. Halsband & H.J. Hirche in Mar. Ecol. Prog. Ser., 2001, 209. [p.221, Fig.2]. issued from : C. Halsband & H.J. Hirche in Mar. Ecol. Prog. Ser., 2001, 209. [p.221, Fig.2].
Seasonal cycles of (a) temperature and salinity at Helgoland Roads. (b) phytoplankton at Helgoland Roads. 'others' = total phytoplankton carbon - diatom carbon. Phytoplankton data smoothed by 3-point running average. |
 Issued from : T. Kiørboe & H. Jiang in J. R. Soc. Interface, 2013, 10. [p.3, Fig.2 b]. Issued from : T. Kiørboe & H. Jiang in J. R. Soc. Interface, 2013, 10. [p.3, Fig.2 b].
Example of instantaneous flow field of feeding Centropages typicus.
Region with flow velocity exceeding U* = 0.6 mm/s shaded white. |
 Issued from : M.G. Mazzocchi, L. Dubroca, C. Garcia-Comas, I. Di Capua & M. Ribera d'Alcalà in Prog. Oceanogr., 2012, 97-100. [p.141, Fig.7]. Issued from : M.G. Mazzocchi, L. Dubroca, C. Garcia-Comas, I. Di Capua & M. Ribera d'Alcalà in Prog. Oceanogr., 2012, 97-100. [p.141, Fig.7].
Average annual cycle of abundance (ind. m3) of Centropages typicus at station MC in the period 1984-2006.
iNota: Individual samples collected by vertical tows in the upper 50 m at station MC in the Gulf of Naples, depth < 100m. |
 Issued from : M.G. Mazzocchi, L. Dubroca, C. Garcia-Comas, I. Di Capua & M. Ribera d'Alcalà in Prog. Oceanogr., 2012, 97-100. [p.139, Fig.3]. Issued from : M.G. Mazzocchi, L. Dubroca, C. Garcia-Comas, I. Di Capua & M. Ribera d'Alcalà in Prog. Oceanogr., 2012, 97-100. [p.139, Fig.3].
Average annual cycle of (a) temperature (*C), (b) salinity (psu), and (c) chlorophyll a concentration (mg m3) integrated in the 0-50 m layer at Station MC (Gulf of Naples) in the period 1984-2006. Box-and-whisker plots have whisker range fixed at 1.5 times the interquartile interval. |
 Issued from : C. Stegert, R. Ji, N. Li & C.S. Davis in J. Plankton Res., 2012, 34 (1). [p.20, Fig.1]. Issued from : C. Stegert, R. Ji, N. Li & C.S. Davis in J. Plankton Res., 2012, 34 (1). [p.20, Fig.1].
Abundance of Centropages typicus in the Gulf of Maine/Georges Bank region in relation to environmental characteristics.
Upper: surface temperature, lower left: temperature and chlorophyll-a surface concentration; lower right: surface temperature and salinity.
Abundances are vertical averages over the upper 200 m in Log10 (ind. per m3).
Nota: The highest abundances are found between 14 and 18°C and lowest abundances occurred < 7°C. This temperature preference results in a seasonal peak in October to November, shortly after the temperature in the upper layers reaches its maximum of 16-17°C and decreases in December as temperatures decline to 8-10°C. From MARMAP/ECOMON data set no clear relationship between C. typicus and chlorophyll concentration or salinity was found. This species is somehow able to thrive during the warm season in a relatively low-food environment (< 1 mg Chl. per m3 from summer to winter except at the subsurface maximum layer, where concentrations can reach up to 1.5 mg Chl. per m3). This adaptation suggests a life-history that is different from the cold water species in the region, including Calanus finmarchicus, Pseudocalanus sp., Temora sp., which have peak abundances following the spring phytoplankton bloom.
In this study, the results confimed that cannibalism is a possible constraint controlling the abundances on Georges Bank. |
 Issued from : C. Stegert, R. Ji, N. Li & C.S. Davis in J. Plankton Res., 2012, 34 (1). [p.24, Fig.3]. Issued from : C. Stegert, R. Ji, N. Li & C.S. Davis in J. Plankton Res., 2012, 34 (1). [p.24, Fig.3].
Bi-monthly abundance distribution of Centropages typicus adults from MARMAP/ECOMON as climatology for the years 1977-2006 (vertical average over upper 200 m as ind. per m3). See in Sherman, 1980; Kane, 2007) |
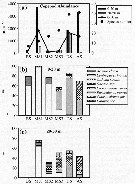 Issued from : S. Zervoudaki, E.D. Christou, G. Assimakopoulou & al. in J. Mar. Systems, 2011, 86. [p.49, Fig.3]. Issued from : S. Zervoudaki, E.D. Christou, G. Assimakopoulou & al. in J. Mar. Systems, 2011, 86. [p.49, Fig.3].
Copepod abundance (a) (ind/m3, bars and line), number of species (a) (symbol) and relative abundance (b and c) (%, stacked bars) of the dominant copepod species on the total copepod populations at all stations from BS to AS following the BSW, during April 2008. Note that zooplankton sampling in BS was performed in 0-30 m.
See Chart, figure 1 below for the transect between Aegean Sea (AS) and the Bosphorus (BS).
Nota: Mean egg production (egg/female/day) 47.5 ± 5 (at MS2); 8.9 ± 1 (at DS); 4.7 ± 0.9 (at AS). |
 Issued from : S. Zervoudaki, E.D. Christou, G. Assimakopoulou & al. in J. Mar. Systems, 2011, 86. [p.46, Fig.1]. Issued from : S. Zervoudaki, E.D. Christou, G. Assimakopoulou & al. in J. Mar. Systems, 2011, 86. [p.46, Fig.1].
Sampling station locations (depth contours in meters) investigated during the cruise in the Turkish Strait System (Bosphorus Straits, Marmara Sea and Dardanelles Straits) and in the northern Aegean Sea during April 2008. Line shows the intrusion of the Black Sea water (BSW) in the northern Aegean Sea. |
 Issued from : S. Zervoudaki, E.D. Christou, G. Assimakopoulou & al. in J. Mar. Systems, 2011, 86. [p.48, Fig.2]. Issued from : S. Zervoudaki, E.D. Christou, G. Assimakopoulou & al. in J. Mar. Systems, 2011, 86. [p.48, Fig.2].
Vertical profiles of temperature (°C), Salinity and Chl a (µg/l) at all stations from BS (Bosphore) to AS (Aegean Sea) following the BSW (Black Sea water), up to 50 m of the water column during April 2008.
Note the different scale in salinity and temperature at DS and AS stations (see chart: fig.1 above). |
 Issued from S. Razouls in XXIII rd Congress of Athens, 3-11 November 1972. [p.2]. Oxygen consumed by individual (adult) in the Banyuls Bay and equivalent carbon asked. Issued from S. Razouls in XXIII rd Congress of Athens, 3-11 November 1972. [p.2]. Oxygen consumed by individual (adult) in the Banyuls Bay and equivalent carbon asked.
(1) Hydrological season in the stability period: Eté = Summer: 18-20 °C; Hiver: = Winter: 13-10°C.
Espèces = species; Saison = Season; Lg céph.= cephalothoracic length; an = individual; moyennes = means. |
 Issued from : A. Ianora, A. Miralto & C. Halsband-Lenk in Progress in Oceanogr., 2007, 72. [p.199]. Issued from : A. Ianora, A. Miralto & C. Halsband-Lenk in Progress in Oceanogr., 2007, 72. [p.199].
Centropages typicus spiny egg, newly hatched naupkius I stage (top panel) and egg development times from different locations and seasons (bottom panel). Bay of Villefranche (o) from Halsband-Lenk & al. (2002); Helgoland Island (black circle) from Halsband Lenk & al; (2002); Gulf of Maine(triangle) from Lawson & Grice (1969); Scotian shelf (+), data derived from the Belehradek function provided in McLaren & al. (1989).
Nota: The data show that egg development times for all Centropages species tend to be quite rapid, ca. 24-72 h within a temperature range of 10-28°C, but increase 4 to 5-fold at lower temperatures.
Although several congeneric species such as Centropages hamatus (Marcus & Lutz, 1998), C. abdominalis (Kasahara & al., 1974) and C. yamadei (Kasahara & al., 1974) have been shown to produce diapause eggs, to date, there is no evidence that C. typicus produces diapause or resting eggs (see Smith & Lane, 1987; Lindley, 1990 and Lindley & Reid, 2002). |
 Issued from : A. Ianora, A. Miralto & C. Halsband-Lenk in Progress in Oceanogr., 2007, 72. [p.199]. Issued from : A. Ianora, A. Miralto & C. Halsband-Lenk in Progress in Oceanogr., 2007, 72. [p.199].
Centropages typicus reproductive parameters in north Atlantic, English Channel , North Sea and Mediterranean Sea. |
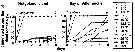
 issued from : G.B. Deevey in Bull. Bingham Oceanogr. Coll., 1960 (2). [p.19, Fig.7]. issued from : G.B. Deevey in Bull. Bingham Oceanogr. Coll., 1960 (2). [p.19, Fig.7].
Relative percentages, by count, of the species Centropages typicus compared with Centropages hamatus at the statuons in Delaware Bay (39° N, 75°25' W), from January 1930 through December 1932.
Nota: Centropages typicus is one of the most important forms over the continental shelf from Cape Cod to Chesapeake Bay; it also occurs in the Gulf of Maine. It is a neritic species, rare outside the continental shelf, but at least off southern New England it does not tolerate salinities lower than c 30 p.1000; thus it is predominant only in open coastal waters where it is primarily a surface form. The southern limits of its abundance are not known; it may not extend south of cape Hatteras, although Foster (1904) recorded it from the Louisiana coast. In the Gulf of Mexico replaces ;
The recorded temperature range for C. typicus is 1-24°C. |
 issued from : G.B. Deevey in Bull. Bingham Oceanogr. Coll., 1960 (2). [p.20, Fig.8]. issued from : G.B. Deevey in Bull. Bingham Oceanogr. Coll., 1960 (2). [p.20, Fig.8].
Relative percentages, by count, of the species Centropages typicus compared with Centropages hamatus at the stations outside Delaware Bay (39° N, 75°25' W), from January 1930 through December 1932.
Nota: C. typicus is very important in the surface waters outside the Bay. No other species occurred in comparable numbers. In general it was most abundant in summer and winter, with minimal numbers during late winter or spring and in fall.
In 1932, a year of moderate temperatures, C. typicus was much less abundant, especially during the summer. |
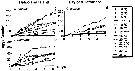
 Issued from : G. B. Deevey in Bull. Bingham Oceanogr. Coll., 1960, 17 (2). [p.69, Fig.8]. Issued from : G. B. Deevey in Bull. Bingham Oceanogr. Coll., 1960, 17 (2). [p.69, Fig.8].
Seasonal mean cephalothorax length variations of female Centropages typicus from the western Mediterranean Sea in 1955-1956 compared with those in the Delaware Bay region (Deevey, 1960) and in Block Island Sound (Deevey, 1952)
Nota: The annual temperature range in the waters of Castellon (Spain) is 13-14°C; extreme temperatures recorded during the two year period were 27.3°C in August 1955 and 10.3° in February 1956. |
 Issued from : G. B. Deevey in Bull. Bingham Oceanogr. Coll., 1960, 17 (2). [p.71, Fig.9]. Issued from : G. B. Deevey in Bull. Bingham Oceanogr. Coll., 1960, 17 (2). [p.71, Fig.9].
Observed variations in mean cephalothorax length of female C. typicus from the western Mediterranan Sea compared with the length cycles calculated from A: the mean temperature and phytoplankton of the month prior to sampling; B: the temperature and phytoplankton of the day of sampling. |
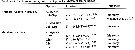
 Issued from : G. B. Deevey in Bull. Bingham Oceanogr. Coll., 1960, 17 (2). [p.71, Table VII]. Issued from : G. B. Deevey in Bull. Bingham Oceanogr. Coll., 1960, 17 (2). [p.71, Table VII].
Correlation coefficients for mean cephalothorax lengths with the temperature and phytoplankton of the day of samplingt and averaged for the previous four weeks obtained with 26 pairs of data for female Centropages typicus from Castellon (W Mediterranean Sea).
Quantity of phytoplankton in Harvey units of pigment/liter.
Nota: Significant negative correlations between length and phytoplankton were obtained fot both the temperature and phytoplankton data of the sampling date of the previous month. |
 Issued from : G.A. Deevey in Bull. Bingham Oceanogr. Coll., 1960, 17 (2); [p.76, Table IX]. Issued from : G.A. Deevey in Bull. Bingham Oceanogr. Coll., 1960, 17 (2); [p.76, Table IX].
Correlation coefficients for mean cephalothorax lengths for Centropages typicus females and males with the temperature at sampled and averaged for the previous month from the Block Island Sound, Rhode Island (data from Deevey, 1952) |
 Issued from M.N. Daly Yahia, S. Souissi & O. Daly Yahia-Kéfi inZool. Studies, 2004, 43 (2). [p.370, Fig.4] Issued from M.N. Daly Yahia, S. Souissi & O. Daly Yahia-Kéfi inZool. Studies, 2004, 43 (2). [p.370, Fig.4]
Taxonomic composition and density range of copepods Centropagidae in the Bay of Tunis between Dec. 1993 to Nov. 1995 (mean annual values).
w
Nota: observe the seasonal difference between C. typicus and C. kriyeri. |
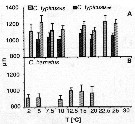
 Issued from : C. Halsband-Lenk, H.-J. Hirche & F. Carlotti in J. Exp. Mar. Biol. Ecol., 2002, 271. [p.124, Fig.1, a]. Issued from : C. Halsband-Lenk, H.-J. Hirche & F. Carlotti in J. Exp. Mar. Biol. Ecol., 2002, 271. [p.124, Fig.1, a].
Habit (after Rose, 1957; modified), range of prosome length in situ (Halsband-Lenk, partly unpublished) (see fig.8, A, B, C) and geographical distribution in the Atlantic and adjacent seas of Centropages typicus and Centropages hamatus (a).
The target is the temperature impact on reproduction and development of two congener copepod pairs inhabiting different biogeographic regions to their geographic distribution patterns (from two stations in the North Sea, Helgoland Island and the Mediterranean Sea, Villefrance -sur-Mer).
Nota: For the authors, when results are compared with field data, a mismatch between the reproductive thermal response in the laboratory and reproduction peaks in the field became apparent. While the temperature optima of egg-laying differed considerably between Centropages hamatus and Temora longhicornis in the experiments, in the North Sea their reproduction peaks occurred simultaneously in spring at 5-10°C in situ temperature (Rijswijk & al., 1989; Halsband & Hirche, 2001);
Egg production rate was controlled by body size which in turn was related to temperature (Halsband & Hirche, 2001).
Analogously, in the Bay of Villefranche (NW Mediterranean Sea) in situ reproduction peaks of Centropages typicus and Temora stylifera coincided in autumn when females were largest (Halsband-Lenk & al., 2001), while temperature optima in the laboratory were different. There, body size appeared to be less influenced by temperature, evenjtually due to the narrow annual temperature range. This was different from Centropages typicus in the Gulf of Naples, where maximal egg production rates were recorded in spring (Ianora & Buttino, 1990). Possibly, autumn temperatures are still high in that shallower region to favour high reproduction rates in this species.
However, specific temperature preferences of individualsn seem to be overridden by body-size-related reproductive potential at sea. Body-size is negatively related to telmperature and consequently, the bigger specimens of Temora longicornis and temora stylifera. Weight specific egg production eliminated size differences and was similar among congeners. The values were lower than those reviewed by Kiørboe and Sabatini (1995).
The comparison of centropages typicus in two different temperature regimes shows that the species is eurytherm and could shift its tolerance range dynamically to the temperature window of a specific environment. Thus, this species is most independant of temperature and could establish a wide distribution in the North and Middle Atlantic and adjacent seas. The shift of tolerance towards lower temperatures in the North Sea indicates adaptation and temperature compensation. In how far this shift is genitically fixed, along a latitudinal temperature gradient needs further investigation (see: Hummel & al., 1997; Dahloff & Rank, 2000).
Regarding the congeners in the North Sea, they showed showed distinct female thermal tolerance in authors' experiments (Table 5) , with C. typicus favouring intermediate and C. hamatus low temperatures.
The optima of the reproductive thermal response were congruent with the temperature ranges they encounter during their successive reproduction periods in the North Sea. Both C. typicus and C. hamatus disappear regularly from the water column in winter, but overwintering strategies are different. C. hamatus produces resting eggs, which persist unfavourable conditions in the sediment (Lindley, 1990; Marcus, 1996). C. typicus depends on a recurring input from the Atlantic with the inflow of relatively warm water (Fransz & al., 1991) and thus probably overwinters in more temperate regions like the English Channel (Le Ruyet-Person & al., 1975).
Thus, the latitudinal and seasonal distribution patterns of both congeners reflect clearly the temperature limits of their survival and reproduction as revealed in the authors' experiments.
See commentaries and authors' conclusion in Temora longicornis. |
 Issued from : C. Halsband-Lenk, H.-J. Hirche & F. Carlotti in J. Exp. Mar. Biol. Ecol., 2002, 271. [p.127, Fig.3, a, b, d]. Issued from : C. Halsband-Lenk, H.-J. Hirche & F. Carlotti in J. Exp. Mar. Biol. Ecol., 2002, 271. [p.127, Fig.3, a, b, d].
Total mortality of adult females after 5 days of incubation at different temperatures between individuals from Helgoland island and Villefranche-sur-Mer.
Nota: Comprison with Centropages hamatus (b), very rare in the W Mediterranean Sea, introduces by the superficial current from the Atlantic through Gibraltar Strait. |
 Issued from : C. Halsband-Lenk, H.-J. Hirche & F. Carlotti in J. Exp. Mar. Biol. Ecol., 2002, 271. [p.128, Fig.4, a, b, d]. Issued from : C. Halsband-Lenk, H.-J. Hirche & F. Carlotti in J. Exp. Mar. Biol. Ecol., 2002, 271. [p.128, Fig.4, a, b, d].
Cumulative proportions of dead females incubated 5 days at different temperatures from two sites North Sea (Helgoland Island) and Northwestern Mediterranean Sea (Villefranche-sur-Mer). Comparison with Centropages hamatus. |
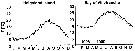
 Issued from : C. Halsband-Lenk, H.-J. Hirche & F. Carlotti in J. Exp. Mar. Biol. Ecol., 2002, 271. [p.129, Fig.5, a, b, d]. Issued from : C. Halsband-Lenk, H.-J. Hirche & F. Carlotti in J. Exp. Mar. Biol. Ecol., 2002, 271. [p.129, Fig.5, a, b, d].
Temperature impact on egg production rates. |
 Issued from : C. Halsband-Lenk, H.-J. Hirche & F. Carlotti in J. Exp. Mar. Biol. Ecol., 2002, 271. [p.130, Fig.6, a, b, d]. Issued from : C. Halsband-Lenk, H.-J. Hirche & F. Carlotti in J. Exp. Mar. Biol. Ecol., 2002, 271. [p.130, Fig.6, a, b, d].
Cumulative egg production during 5 days at different temperatures. |
 Issued from : C. Halsband-Lenk, H.-J. Hirche & F. Carlotti in J. Exp. Mar. Biol. Ecol., 2002, 271. [p.133, Fig.9, a, b, d]. Issued from : C. Halsband-Lenk, H.-J. Hirche & F. Carlotti in J. Exp. Mar. Biol. Ecol., 2002, 271. [p.133, Fig.9, a, b, d].
Embryonic development times fitted with Belehradek curves.
n.d. = no development, EP = egg production.
T = temperature °C, D = days, a = slope of the response, alpha = temperature scale position of the response.
Nota: Temperature impact on embryonic duration shows at all temperatures where eggs were produced hatching was possible, except in C. typicus in the Mediterranean Sea at 2°C.
Embryonic development times decreased with increasing temperature following Belehradek functions. In few cases embryonic duration increased at higher temperatures, as at 25°C in C. hamatus and at 28°C in C. typicus in the Mediterranean Sea, where more than 70 % of nauplii hatched at all temperatures; a more variable proportion of viable nauplii was observed in C. hamatus ranging from 34 % to 89 %.
The lower temperature limit of embryonic development was 5°C in both populations. At the upper temperature range, embryonic duration was shortest at 25°C at both stations. At 28°C, hatching was retarded in Mediterranean eggs; no data were available for the north Sea (fig. 9 a, d);
A fast embryonic development seems advantageous to reduce predation pressure on motionless eggs, which increases with the time needed until hatching (Ohman, 1986). Moreover, a long non-swimming phase denotes a high risk of loss below the euphotic zone or to the sediment in shallow shelf regions.
The Belehradek curves of cold-acclimated North Sea embryos were displaced by about 5° towards lower temperatures in relation to the curves of their Mediterranean congeners.
Post-embryonic stages of C. typicus tended to develop more quickly in the Mediterranean than in the North Sea at all temperatures investigated, suggesting an influence of body size as postulated by Vidal (1980), who stated that smaller individuals have shorter stage durations than larger ones. |
 Issued from : C. Halsband-Lenk, H.-J. Hirche & F. Carlotti in J. Exp. Mar. Biol. Ecol., 2002, 271. [p.134, Table 2]. Issued from : C. Halsband-Lenk, H.-J. Hirche & F. Carlotti in J. Exp. Mar. Biol. Ecol., 2002, 271. [p.134, Table 2].
Belehradek functions of embryonic development at different temperatures in C. typicus and C. hamatus.
Nota: The curve of C. typicus (North Sea) corresponded to that of C. typicus (Mediterranean Sea) in autumn, while the equation derived by McLaren & al. (1989) from Atlantic specimens matched best with the author's equation from May.
Embryonic development time has been primarily attributed to egg size both on a seasonal and latitudinal scale (Corkett, 1972; Lonsdale & Levinton, 1985), with larger eggs from larger females having lower metabolic rates than smaller eggs due to lower oxygen diffusion rates. During the author's study, egg-size was almost constant throughout the study period in all species. Therefore, parental influences due to acclimatation (Landry, 1975) and heredity (Fujisawa, 1995) seem more likely to influence the embryonic thermal response in this case. |
 Issued from : C. Halsband-Lenk, H.-J. Hirche & F. Carlotti in J. Exp. Mar. Biol. Ecol., 2002, 271. [p.139, Table 3]. Issued from : C. Halsband-Lenk, H.-J. Hirche & F. Carlotti in J. Exp. Mar. Biol. Ecol., 2002, 271. [p.139, Table 3].
Stage durations (day) and mortality rates (day) of C. typicus at different temperatures, in two regions.
Compare with Centropages hamatus from the North Sea (Helgoland Island). |
 Issued from : C. Halsband-Lenk, H.-J. Hirche & F. Carlotti in J. Exp. Mar. Biol. Ecol., 2002, 271. [p.143, Table 15]. Issued from : C. Halsband-Lenk, H.-J. Hirche & F. Carlotti in J. Exp. Mar. Biol. Ecol., 2002, 271. [p.143, Table 15].
Seasonal variation of egg production of Centropages typicus in the MediterraneanSea (Villefranche-sur-Mer)
Nota: Experiments showed very similar reproductive thermal response (RTR) in November, March and May, indicating independence from season. Optimum temperature of egg production remained invariable at 20°C, only the magnitude of egg production varied seasonally, while body size was almost constant. Likely, the seasonal variability of embryonic thermal response (ETR) was not significant (see fig.9 d) |
 Issued from : C. Halsband-Lenk, H.-J. Hirche & F. Carlotti in J. Exp. Mar. Biol. Ecol., 2002, 271. [p.140, Table 4]. Issued from : C. Halsband-Lenk, H.-J. Hirche & F. Carlotti in J. Exp. Mar. Biol. Ecol., 2002, 271. [p.140, Table 4].
Egg production rates (EPR) and development times of Centropages typicus.
NS = North Sea; M = Mediterranean; A = Atlantic.
I.g. = Isochrysis galbana; H.e.= Hymenomonas elongata; T.s. = Tetraselmis suecica; D.t. = Dunalliella tertiolecta; T.w. = Thalassiosira weissflogii; T.r. = Thalassiosira rotula; R.b. = Rhodomonas baltica; R.sp. = Rhodomonas sp.; O.m. = Oxyrrhis marina. |
 Issued from : C. Halsband-Lenk, H.-J. Hirche & F. Carlotti in J. Exp. Mar. Biol. Ecol., 2002, 271. [p.144, Table 6]. Issued from : C. Halsband-Lenk, H.-J. Hirche & F. Carlotti in J. Exp. Mar. Biol. Ecol., 2002, 271. [p.144, Table 6].
Proportion of total development time (egg-laying to adult) spent in each stage (cumulative median development time/generation time in Centropages typicus.
NS = North Sea (Helgoland Island); Med = Mediterranean Sea (Villefranche-sur-Mer) |
 Issued from : C. Halsband-Lenk, H.-J. Hirche & F. Carlotti in J. Exp. Mar. Biol. Ecol., 2002, 271. [p.143, Table 5]. Issued from : C. Halsband-Lenk, H.-J. Hirche & F. Carlotti in J. Exp. Mar. Biol. Ecol., 2002, 271. [p.143, Table 5].
Centropages typicus and C. hamatus: Synthesis of results from incubation in a temperature gradient from 0 to 35°C.
FTT = female thermal tolerance. RTR = reproductive thermal response. ETR = embryonic thermal response.
NS = North Sea (Helgoland Island); Med = Mediterranean Sea (Villefranche-sur-Mer).
Nota: The female thermal tolerance differed between the two C. typicus populations in the North Sea and the Mediterranean Sea. While mortality rates of females were similar at upper temperatures, they were higher in the mediterranean at the lower temperature range. Optimal survival occurred at 5-10°C in the North Sea, but at 10-15°C in the mediterranean. In contrast, the reproductive thermal response was very similar in the two populations, except at 2°C, where C. typicus from (the North Sea) produced eggs, whereas C. typicus (from the Mediterranean Sea) did not. At the optimum (20°C), the larger C. typicus (North Sea) females produced more eggs: 54.5 egg female-1 day-1) than the smaller C. typicus (from the Mediterranean) : 34.1 eggs female -1 day-1. On a weight-specific base, egg production was similar in both populations with a slightly higher maximum of C. typicus (mediterranean).
The lower temperature limit of embryonic development was 5°C in both populations, although females were able to produce eggs at 2°C in the North Sea.
The thermal tolerance ranges were rather similar in all parameters considered. However, in some cases, a slight decrease of tolerance was observed in subsequent life phases, i.e. in T. stylifera whose temperature range was wider for female survival than for reproduction and even narrower for embryonic development.
Heat death occurred in T. longicornis, except T. stylifera, at 30°C or below, indicating that this temperature represents a threshold beyond which a selective measure is necessary to ascertain survival, e.g. the production of heat shock proteins reported for various marine organisms (Hofmann, 1999). Depression of development rate (i.e. increasing development time) as an expression of physiological inefficiency at the upper end of a species' thermal range (reported for embryos of Acartia clausi, Temora stylifera, Centropages chierchiae; Bernard, 1971; Landry, 1975). The authors observed prolonged embryonic duration at 25°C or above, both in the North Sea (Centropages hamatus) and in the Mediterranean (Centropages typicus).
Cold death occurred below 5°C in warm-acclimated individuals in the Mediterranean . The lower temperature limit of the boreal species was missed during the authors' study and may be around the freezing point of seawater. |
 Issued from : C. Halsband-Lenk, H.-J. Hirche & F. Carlotti in J. Exp. Mar. Biol. Ecol., 2002, 271. [p.132, Fig.8]. Issued from : C. Halsband-Lenk, H.-J. Hirche & F. Carlotti in J. Exp. Mar. Biol. Ecol., 2002, 271. [p.132, Fig.8].
Prosome length of females incubated in experiments.Vertical bars indicate standard deviation.
NS : North Sea (Helgoland Island); Med : Mediterranean Sea (Villefranche-sur-Mer). Effect of temperatures in the congeners of Centropages species and within the same species.
Nota: Prosome length of females used in experiments showed little variability within species in comparison to the range of prosome length compiled from different seasons and locations (see in fig. 1).
Prosome length of C. typicus (North Sea) ranged from 971.1 to 1415.9 µm (mean: 1158.9 ±83.6 µm). Specimens of C. typicus (mediterranean) were smaller, ranging from 921.8 to 1174.0 (mean: 1036.7 ±61.5 µm)
Body size of C. hamatus was between 793.1 and 1146.8 µm (mean: 944.6 ±79.5 µm).
Size differenvces between experiments were significant only in C. typicus (mediterranean) and C. hamatus; in both cases, females were greater at 15°C than at 10°C (p <0.0001). |
 Issued from : C. Halsband-Lenk, H.-J. Hirche & F. Carlotti in J. Exp. Mar. Biol. Ecol., 2002, 271. [p.125, Fig.2]. Issued from : C. Halsband-Lenk, H.-J. Hirche & F. Carlotti in J. Exp. Mar. Biol. Ecol., 2002, 271. [p.125, Fig.2].
Seasonal cycle of surface temperature in the North Sea (Helgoland Roads) in 1999 and in the mediterranean Sea (Villefranche-sur-Mer) in 1998 and 1999.
Plankton collected at the sampling sites ''Kabeltonne'' (54°11'03'' N, 7°54'00'' E) and ''Point B'' (43°41'10'' N, 7°19'00'' E). These stations are of a similar longitude position, but represent two different climatic regions. |
 Issued from : S. Ban, C. Burns, J. Castel, Y. Chaudron & al. in Mar. Ecol. Prog. Ser., 1997, 157. [p.289, Table 1]. Issued from : S. Ban, C. Burns, J. Castel, Y. Chaudron & al. in Mar. Ecol. Prog. Ser., 1997, 157. [p.289, Table 1].
Synopsis of feeding/reproduction experiments. A total of 17 diatom and 16 copepod species, representative of a variety of worldwide temperate and subarctic environments (E: estuarine, C: coastal ocean), were screened.
Data for fecundity and hatching success are average values measured at the start and end of the inciubations in a minimum of 3 replicate batches, showing the variation in time of the effects of diatoms on copepod reproduction.
Level of significance of the diatom effect between treatments and controls (e.g. non-diatom diets) in categories I to III was p < 0.01. No.. rank (for comparison with Table 2, p.290).
For the signification of the categories I to IV (fecundity vs. Hatching success vs. Duration of experiment days-1): See Eurytemora affinis, Calanus pacificus, Calanus finmarchicus, Temora stylifera.
List of the 12 marine or estuarine species studied (fresh water excluded. CR): Acartia clausi, A. grani, A. steueri, A. tonsa, Calanus finmarchicus, C. helgolandicus, C. pacificus, Centropages hamatus, C. typicus, Eurytemora affinis, Temora longicornis, T. stylifera. |
 Issued from : S. Ban, C. Burns, J. Castel, Y. Chaudron & al. in Mar. Ecol. Prog. Ser., 1997, 157. [p.290, Table 2]. Issued from : S. Ban, C. Burns, J. Castel, Y. Chaudron & al. in Mar. Ecol. Prog. Ser., 1997, 157. [p.290, Table 2].
Combinations of copepod and non-diatom diets in controls in concentrations ranging from 104 to 105 cells ml-1. Data for fecundity and hatching success are average values measured at the start and end of incubation in a minimum of 3 replicate batches.
N.A: natural assemblages of phytoplankton at time of incubation were for No 11 >50% diatoms.
Nos11, 12, 3: In Category I. |
| | | | Loc: | | | ? Namibia (in Carola, 1994), Brazil (Oliveira, 1945 (p.191), Congo, Dakar, Morocco-Mauritania, Cap Ghir, Canary Is., off Madeira, Bahia de Mochima (Venezuela), Jamaica, G. of Mexico (Texas), Aransas Ship Channel, Florida, Beaufort Inlet, Chesapeake Bay, Navesink River estuary, Delaware Bay, Narragansett Bay, off Woods Hole, Long Island Sound, New York Bight, Great Bay estuary, Gulf of Maine, Georges Bank, Bay of Fundy, Nova Scotia, Bedford Basin, off SE & SW Nova Scotia, Newfoundland, S & W Iceland, Faroe, Ireland, off SW Ireland, Celtic Sea, Lough Hyne, Galway Bay, Fairlie Channel (SW Scotland), Bristol Channel, Norway Sea, Wyville Thomson Ridge, Nordvestbanken, S & W Barents Sea (rare), Skagerrak, Gullmar Fjord, Norway (Malangen fjord, Raunefjorden, Haøybotn), North Sea, NE Scotland , Dogger Bank, Kattegat, Pas de Calais, English Channel, Plymouth, Roadstead of Brest, Morlaix estuary, Bay of Biscay, Atcachon Bay, Gironde estuary, La Pallice roadsteadt (rare), Glenans Islands, Belon estuary, Bilbao & Urdaibai estuaries, Portugal, Mondego estuary, off Coruña, NW Spain, Ibero-moroccan Bay, off W Tangier, Medit. (Castellon, Alboran Sea, Habibas Isz., Sidi Fredj coast, Gulf of Annaba, El Kala shelf, Baleares, Balearic Sea, off Barcelona, Banyuls, G. du Lion, Berre Lagoon, Marseille, Toulon harbour, Nice, Villefranche-s-Mer, Genova, Ligurian Sea, Lake Faro (Sicily), Tyrrhenian Sea, Milazzo, Strait of Messina, Taranto, Tripoli, Malta, Adriatic Sea, Mljet Is., Venezzia, Po delta, G. of Trieste, G. of Gabès, Ionian Sea, Aegean Sea, Thracian Sea, Lebanon Basin, Alexandria, Marmara Sea, Black Sea), Port Said N Red Sea (Safaga) in El-Sherif & Aboul Ezz (2000, p.61); [? Pacific (in C.B. Wilson, 1950, p.188)], N Chile | | | | N: | 369 (SE Pacif.: 1, S Atlant.: 3; N Atlant.: 192; Sub-Arct.: 2; Medit.: 162; Black Sea: 2; Red Sea: 1) | | | | Lg.: | | | (38) F: 1,63-1,46; M: 1,64-1,56; (45) F: 1,75-1,25; M: 1,6-1; (46) F: 2-1,6; M: 1,85-1,42; (65) F: 1,75; M: 1,6; (353) F: 1,664-1,32; M: 1,561-1,32; (449) F: 2-1,6; M: 1,9-1,4; (580) F: 1,874-1,376; M: 1,752-1,4; (920) F: 1,52; M: 1,51; (927) F: 1,65-1,67 [winter]; 1,50-1,52 [summer]; M: 1,57-1,59 [winter]; 1,47-1,49 [summer]; (1302) F: 0,79-1,69; (1303) F: 1,86; M: 1,74; {F: 0,79-2,00; M: 1,00-1,90}
The mean female size is 1.594 mm (n = 21; SD = 0.2718), and the mean male size is 1.546 mm (n = 19; SD = 0.2018). The size ratio (male : female) is 0.95 (n = 11; SD = 0.0470). | | | | Rem.: | Epipelagic, netitic.
According to Østvedt (1955) this species is regarded as a typically temperate form, and the northern limit of its common occurrence is probably the Faroe-Shetland Channel. A single specimen was taken in June at Weather ship M (Norwegian Sea). Pipe and Coombs (1980) note this species by 60°N, 07°W in the Wyville Thomson Ridge at depths between 0 and 70 m., owed to the North Atlantic Drift water.
After Norrbin (1992, p.6) this species is uncommon so far north at Hakøybotn, Norway (69°30'N), found mainly during summer and disappears during winter.
Krause (1978) found this spcies in the North Sea brought from Atlantic water with high salinity, he reported a positivr correlation between the abundance and sea surface salinity.
First occurrence in SE Pacific (N Chile) by Hidalgo & al. (2010).
Gaudy (1971 a) shows a relation between the size and the length of the antennula, linked with the water density in the Gulf of Marseille, although others hypothesis are also possible. In 2009, Dvoretskii & Dvoretskii (2009) observe the same variation for Oithona similis in the White Sea.
For C. Razouls (1974, p.66), if the concentration of adults does not affect the duration of development of the generation to which it gave birth, it can play a role in the time interval between sexual maturity and the time of mating.
It is possible to have an order of magnitude of the time taken by a Copepod to explore a given volume. We can estimate the average speed (v) of C. typicus at 1 cm/sec and the radius of the sphere of action (s) at 2 mm. If we assume that the individual moves at random, the explored volume is equal to π s2 v. We will apply by analogy the calculation model used in the kinetic theory of gases.
The average value of the space traveled between two meetings is the average free path L determined by Clausius' formula:
L = 3/4 1 /(n π s2)
The time t necessary to cover the distance L is then:
t = 1/v
For a concentration of one adult per m3, the value of t is 69 days.
For a concentration of two adults per m3 (the sex ratio being equal to 1), we find a value of t close to 1 month.
For a concentration of 20 per m3, t is close to 3 days. We can see that the rate of adults can be taken into account especially in the case of the last annual generation numerically quite weakly represented.
From and below the threshold of 4 individuals per m3, the possibilities of reproduction become very low, and we would be in the presence of a pseudo-population. The first annual generation of February-March could, in this case, have a different origin and not come from the previous one.
Only experimentation and a better knowledge of the values of the concentrations as a function of chorological factors will be able to specify the importance of this hypothesis on the population dynamics.
If in the Mediterranean the two congeneric species C. typicus and C. hamatus hardly compete with each other, because of the very great rarity of C. hamatus, introduced by the surface current of Gibraltar of salinity lower than that of the Mediterranean, it is surely not the same in the North Atlantic. If the nutritional factors are probably the same for the two species, their competition would be to be sought in the hydological factors and in a better knowledge of their metabolism and consequently of the knowledge of their genome.
According to Chaouadi & Hafferssas (2018, p.926) the species is present in all samples between 0 and 100 m (2012-2013) on the Algerian coast near Algiers (stations near Sidi Fredj) with an average abundance 14.6 ± 2.6 ind/m3. The maximum concentrations (24.6 ind/m3) are observed in spring and the minimum (5.34 ind/m3) in winter. During the fall the values were relatively constant (11 to 14 ind/m3). Near the Habibas Islands (Alboran Sea) the maximum value is noted during the spring (7.6 to 11.1 ind/m3) but becomes rare during the summer, the maximum not exceeding 3 ind/m3.
For Kouwenberg & Razouls (1990) a study of the communities observed in 1957-1964 compared to those of 1986-1988 in the Gulf of Lion (NW Mediterranean) reveals a change in the composition of copepod species, in favor of Clausocalanus spp. This modification is in correlation with a significant change in the NW sector winds (Tramontane) induced by the existence of the depression in the Gulf of Genoa which only lasts occasionally. The summer of 1974 seems to be the critical date for this phenomenon of climate change on a larger scale, resulting in a currentological change in the Gulf of Lion and a lesser mixing of waters during the winter period, if not a very slight warming of the surface waters, which will prove larger in 2018 and 2019.
According to Lakkis (1998, p.2,6) this species is rare in the Levant Sea (E Mediterranean Sea) and should be an indicator of the Atlantic current in the Mediterranean Sea. Terbiyik Kurt & Polat (2013 , p.1172 do not observe this species during the seasoonal abundance of copepods in the Iskenderum Bay (south Turkey); For Moraitou-Apostolopoulou (1985, p.315) the species very abundant in the western Mediterranean Sea, progressively diminishes to the east but is found in very large numbers in the north of the Aegean Sea
After us, El-Sherif & Aboul Ezz (2000) has noted for the first time this species in the south of the Gulf of Suez.
For Blanco-Bercial & al., 2014 (p.6), in light of both morphological and molecular data, there is significant doubt about the validity of the distrinction of C. chierchiae Giesbrecht, 1889 from C. typicus Krôyer, 1849.
For Barton & al. (2013, p.530, Table 1) this species belongs to the feeding mode, mixing 'ambush' and 'cruising'; the separation between the two feeding modes are gradual (the separation between 'feeding current' (hovering) and 'cruising'). A neutrally buoyant zooplankter that beats its feeding appendages (scraping particles) will cruise through water, while a negatively buoyant individual that beats the appendages in the same way will produce a feeding current. Some species may switch between between ambush feeding [rather carnivory or omnivory] and feeding-current or cruise feeding.
After Benedetti & al. (2018, p.1, Fig.2) this species belonging to the functional group 4 corresponding to small filter feeding herbivorous and mixed feeding omnivorous (mostly broadcasters). | | | Last update : 28/10/2022 | |
|
|
 Any use of this site for a publication will be mentioned with the following reference : Any use of this site for a publication will be mentioned with the following reference :
Razouls C., Desreumaux N., Kouwenberg J. and de Bovée F., 2005-2026. - Biodiversity of Marine Planktonic Copepods (morphology, geographical distribution and biological data). Sorbonne University, CNRS. Available at http://copepodes.obs-banyuls.fr/en [Accessed March 18, 2026] © copyright 2005-2026 Sorbonne University, CNRS
|
|
|
|

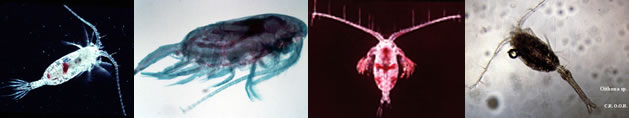


;)
;)
;)
;)
;)
;)
;)
;)
;)
;)
;)
;)
;)
;)
;)
;)
;)
;)
;)
;)
;)
;)
;)
;)
;)
;)
;)
;)
;)
;)
;)
;)
;)
;)
;)

;)
;)
;)
;)
;)
;)
;)
;)
;)
;)
;)
;)
;)
;)
;)
;)
;)
;)
;)
;)
;)
;)
;)
;)
;)
;)
;)
;)
;)
;)
;)
;)
;)
;)
;)
;)
;)
;)
;)
