|
|
 |
|
Cyclopoida ( Order ) |
|
|
|
Oithonidae ( Family ) |
|
|
|
Oithona ( Genus ) |
|
|
| |
Oithona davisae Ferrari & Orsi, 1984 (F,M) | |
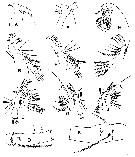
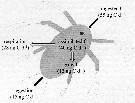
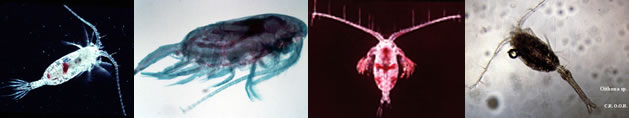
| | | | | | | Syn.: | Oithona brevicornis f. minor Nishida & al., 1977 (part., p.131, figs.); Gubanova & al., 2013 (in press, Rem.: p.5: for the specimens found in the Black Sea) | | | | Ref.: | | | Ferrari & Orsi, 1984 (p.114, figs.F,M); Nishida, 1985 a (p.38, Rem., p.141); 1986 (p.386, 388); 1986 a (p.914); Yoo & Lim, 1993 (p.91, 94, Table 1, fig.2); Chihara & Murano, 1997 (p.936, Pl.199, 203: F,M); Ferrari & Dahms, 2007 (p.31, Rem. N); Vives & Shmeleva, 2010 (p.54, figs.F,M, Rem.); Temnykh & Nishida, 2012 (p.425, fig.1, 2, Table 1, Rem.); Cornils & Heckmann, 2015 (p.243, figs. F, Table I, Fig. 2, molecular biology, phylogeny) | 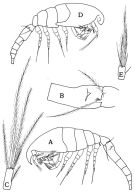 issued from : F.D. Ferrari & Orsi in J. Crust. Biol., 1984, 4 (1). [p.115, Fig.6]. Female (from San Francisco Bay): A, habitus (lateral left side); B, urosomal segments 1 and 2; C, caudal ramus (dorsal). Nota: Rostrum present, pointed ventrally. Caudal ramus length 3-times width. Male: D, habitus (lateral right side); E, caudal ramus (dorsal). Nota: Rostrum absent. Cephalosome flap digitiform laterally, reaching beyond 2nd articulation, with ''pore signature''. Caudal ramus length 2-times width.
|
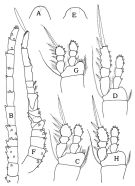 issued from : F.D. Ferrari & Orsi in J. Crust. Biol., 1984, 4 (1). [p.116, Fig.7]. Female: A, Forehead (dorsal); B, A1; C, P1; D, P2. Nota: Forehead rounded dorsally. A1 13-segmented. Male: E, forehead (dorsal); F, A1; G, P1; H, P2. Nota: Forehead quadrate dossally. A1 digeniculate, with subterminal aesthete on terminal segment.
|
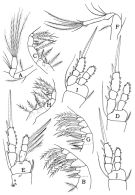 issued from : F.D. Ferrari & Orsi in J. Crust. Biol., 1984, 4 (1). [p.117, Fig.8]. Female: A, A2; B, Mx2; C, Mxp; D, P3; E, P4. Male: F, A2; G, Mx2; H, Mxp; I, P3; J, P4.
|
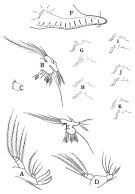 issued from : F.D. Ferrari & Orsi in J. Crust. Biol., 1984, 4 (1). [p.118, Fig.9]. Female: A, Md (mandibular palp); B, Mx1; C, Md (cutting edge). Male: D, Md; E, Mx1; F, left \"pore signature\" of the cephalosome flap (anterodorsal cluster and adjacent section of horizontal row indicated with arrows); G-K, left (top) and right (bottom, transposed 180°) anterodorsal cluster and adjacent section of horiszontal row of male \"pore signature; G and H, 2 males from a station; I-k, 3 males from another station.
|
 Issued from : A. Temnykh & S. Nishida in Aquatic Inv., 2012, 7 (3). [p.427, Fig.2]. Character comparison between Oithona brevicornis (A-D), O. aruensis (E-G), and O. davisae (H-K). A, E, H: rostrum; B, F, I: Md; C, G, J: Mx1, indicating distal-most spine (thin arrow) of 1st inner lobe, endopod (arrowhead), seta on 2nd inner lobe (dotted arrow, absent in J) and seta on 2nd basal segment (thick arrow, absent in J); D: genital double-somite and next somite, lateral view, indicating rows of hairs (arrows) in O. brevicornis; K: genital double-somite, lateral view. Not at scale. After Nishida (1985: A-D), Nishida & Ferrari (1983: E-G) and Ferrari & Orsi (1984: H-K).
|
 Issued from : A. Temnykh & S. Nishida in Aquatic Inv., 2012, 7 (3). [p.428, Table 1]. Characteristics in O.davisae adult female from the Black Sea (this study). Nota: Compare with the species O. brevicornisO. wellershausi, O. aruensis, O. davisae.
|
 Issued from K.-I. & D.-H. Lim in The Korean J. Syst. Zool., 1993, 9 (2). [Key of female]: ]Morphological characters of Oithona davisae female in Korean waters :
1 - Anterior part of prosome rounded in dorsal view.
2 - Rostrum pointed ventrally. 3 - Length of A1 shorter than that of prosome. 4 - Length of 1st spine in inner lobe 1 of Mx1 more than 2 times of that of other spines.
|
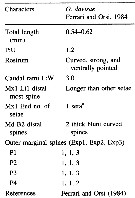 Issued from : A. Cornils & B. Wend-Heckmann in Helgol. Mar. Res., 2015, 69. [p.246, Table 1]. Oithona davisae charcteristics in the semi-enclosed bight in the northern Germann Wadden Sea (North Sea) Compare with O. nana, O. plumifera, O. atlantica and O. similis in the North Sea. a: This sets this species O. similis, O. nana, O. plumifera, O. atlantica apart from O. brevicornis, O. aruensis and O. wellershausi have 3 setae on the endopod of Mx1
|
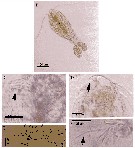 Issued from : A. Cornils & B. Wend-Heckmann in Helgol. Mar. Res., 2015, 69. [p.244, Fig.1, B-F]. Oithona davisae Female (from 55°01.30'N, 08°27.10'E): B, habitus with eggs (dorsal view); C, Md with terminal setae (arrow); D, rostrum (arrow; E, P3 (arrows indicate the outer spines of the exopod); F, Mx1 inner lobe 1(arrow points at long distal seta).
|
 Issued from : K.-I. Yoo & D.-H. Lim in The Korean J. Syst. Zool., 1993, 9 (2) [p.99, Fig.2, O] Female (from East and South Korean Waters): O, Mx1.
| | | | | Compl. Ref.: | | | Uchima, 1985 (p.23); Hirota & Tanaka, 1985 (p.169); Nakata & Nakane, 1987 (p.281, respiration vs pollution); Hirakawa, 1988 (p.337, invasive); Uchima, 1988 (p.93, gut content); Uchima & Hirano, 1988 (p.47, swimming behavior vs. food concentration); Hiromi & al., 1988 (p.143, respiration); Uchima & Murano, 1988 (p.39, mating behavior); Hirota, 1990 (p.307, microdistribution); Yoo, 1991 (tab.1); Kim & al., 1993 (p.271); Hiromi, 1994 (p.149, respiration vs feeding); Uye & Sano, 1995 (p.121, seasonal reproduction); Cordell & al., 1997 (p.2, 7, invasive species, % change 1980-1997); Uye & Sano, 1998 (p.37, seasonal variations, growth, abundance, production); Uye & al., 2000 (p.193, fig.8 : abundance vs t°, Sal.); Ueda & al., 2000 (tab.1); Ishii & Tanaka, 2001 (p.311); Saiz & al., 2003 (p.1304, hydrodynamic turbulence effects); Hooff & Bollens, 2004 (p.167, fig.3, 5, Table 1, 2, vs predator); Calbet & al., 2005 (p.131); Choi & al., 2005 (p.710: Tab.III); Kiørboe, 2007 (p.1511, mating vs population dynamics); Henriksen & al., 2007 (p.119, feeding & swimming activity/ naiuplii); ; Titelman & al., 2007 (p.1023, Table I, Rem.: mate-behaviour); Islam & Tanaka, 2007 (p.579, Table 1; Ohtsuka & al., 2008 (Table 4, Rem.: in Japan Harbors); Cordell & al., 2008 (p.753); Mariani & al;, 2008 (p.273, feeding rates); Kiørboe, 2008 (p.155, Table 2, swimming speed); Ohtsuka & al., 2008 (p.115, Table 5); Yen & Lasley, 2010 (p.177, Rem.: p.183, mating): Almeda & al., 2010 (p.97, development vs. temperature & food concentration); Almeda & al., 2010 (p.24, feeding rates, gross growth efficiencies); Ceballos & Kiørboe, 2011 (PloS ONE, e18870: senescence and sexual selection); Bollens & al., 2011 (p.1358, Table III, fig.7); Itoh & al., 2011 (p.129, vertical distribution); Yebra & al., 2011 (p.87, growth vs metabolism); Sakaguchi & al., 2011 (p.18, Table 1, occurrences); Beltrao & al., 2011 (p.47, Table 1, 2, 3, fig.3, density vs time); Jiang & Kiørboe, 2011 (p.1090, swimming); Winder & al., 2011 (p.749, figs.2, 6, invasion chronology); Almeda & al., 2011 (p.403, nauplius metabolism); Borg & al., 2012 (p.1, Nauplii swimming); Bruno & al., 2012 (p.1, Nauplii behaviour); Heuschele & Kiørboe, 2012 (p.929, pheromone cue vs virgin & mated females); Drillet & al., 2012 (p.155, Table 1, culture); Youn & al., 2012 (p.33, Table 1, 2: seasonal composition); Zamora Terol, 2013 (p.61, feeding rates, egg production, Table 5); Zamora-Terol & Saiz, 2013 (p.376, Rem.: Table 3, grazing, egg production); Gubanova & al., 2013 (p.1, Rem.: p.5, fig.2, Table 4, alien species); Mihneva & Stefanova, 2013 (p.119, Table 1, seasonal and abundance); Tachibana & al., 2013 (p.545, Table 1, seasonal change 2006-2008); Heuschele & al., 2013 (p.399, Table 2, mate behavior); Hubareva & Svetlichny, 2013 (p.742, t° & Sal. tolerance); Altukhov & al., 2014 (p.28, invasive occurrence); Cornils & Heckmann, 2015 (p.243, invasive species); Uriarte & al., 2016 (p.718, fig.5: abundance vs. years 1998-2011); , swimming activity); Svetlichny & al., 2016 (p.77, seasonal variation, egg production, respiration, swimming activity); Ohtsuka & Nishida, 2017 (p.565, 578, Table 22.1, Fig.22.3: central station-innermost station in Japanese waters); Khanaychenko & al., 2018 (p.937, feeding); Terbiyik-Kurt & Besiktepe, 2019 (p.1, fig. 3, 4, 5, Table 2, seasonal variations, % population, spatial distribution) | | | | NZ: | 7 | | |
|
Distribution map of Oithona davisae by geographical zones
|
| | | | | | | | | 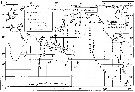 Issued from : S. Nishida in Bull. Ocean Res. Inst., Univ. Tokyo, 1985, No 20. [p.141, Fig.93]. Issued from : S. Nishida in Bull. Ocean Res. Inst., Univ. Tokyo, 1985, No 20. [p.141, Fig.93].
Indo-Pacific geographical distribution of and Oithona aruensis. |
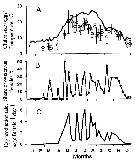
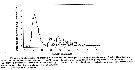
 Issued from : S.-i. Uye & K. Sano in Mar. Ecol. Prog. Ser., 1995, 118. [p.123, Fig.4]; Issued from : S.-i. Uye & K. Sano in Mar. Ecol. Prog. Ser., 1995, 118. [p.123, Fig.4];
Seasonal variation in sex composition of Oithona davisae in Fukuyama Harbor (The Inland Sea of Japan) in 1986 and 1987, during the night.
Nota: Females always outnumbered males, the former comprising 85.8% of the annual mean. In February and March adults were almost entirely composed of females (mean 98.1%).
Temperature was lowest (8.9°C) on 2 March and increased to the annual peak (28°2°C) on 11 September. Salinity ranged from 28.6 to 33.3 p.1000, and it was lower and more variable in summer and fall than in winter and spring. Fukuyama Harbor is heavily eutrophic. Hence, Chl.a was high,particularly in summer. Extraordinarily high values were due to occurrence of red tides of Chatonella marina and Heterosigma akasshiwo, both Raphidophyceae. |
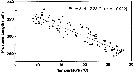 Issued from : S.-i. Uye & K. Sano in Mar. Ecol. Prog. Ser., 1995, 118. [p.124, Fig.6]. Issued from : S.-i. Uye & K. Sano in Mar. Ecol. Prog. Ser., 1995, 118. [p.124, Fig.6].
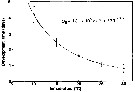
Relationship between water temperature (T) and mean prosome length (PL) of Oithona davisae female in Fukuyama Harbor |
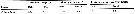 Issued from : T. Kiørboe in Oecologia, 2008, 155. [p.185, Table 2]. Issued from : T. Kiørboe in Oecologia, 2008, 155. [p.185, Table 2].
Grand average swimming speeds (±SD) and cephalothorax lengths of males and females of Oithona davisae.
Nota: Experimental animals were reared in the laboratory at 22°C. |
 Issued from : S.-i. Uye & K. Sano in Mar. Ecol. Prog. Ser., 1995, 118. [p.125, Fig.10]. Issued from : S.-i. Uye & K. Sano in Mar. Ecol. Prog. Ser., 1995, 118. [p.125, Fig.10].
Relationship between temperature (T) and embryonic development time (De), vertical lines denote SD. Oithona davisae in Fukuyama Harbor (The Inland Sea of Japan).
Nota: The best fit was achieved by using the Belehradek equation. |
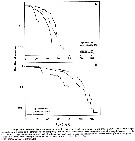
 Issued from : M. Winder, A.D. Jassby & R.M. Nally in Ecology Letters, 2011, 14. [p.753, Fig.3, b]. Issued from : M. Winder, A.D. Jassby & R.M. Nally in Ecology Letters, 2011, 14. [p.753, Fig.3, b].
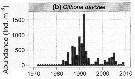
Historical abundances of introduced species in the upper San Francisco Estuary between 1972 and 2009.
Adult stages are shown because immature stages were not continuously identified. |
 Issued from : R. Almeda, M. Alcaraz, A. Calbet & E. Saiz in Limnol. Oceanogr., 2011, 56 (1). [p.411, Fig.6]. Issued from : R. Almeda, M. Alcaraz, A. Calbet & E. Saiz in Limnol. Oceanogr., 2011, 56 (1). [p.411, Fig.6].
Carbon budget of Oithona davisae nauplii (NII-NIII) at 20°C and under saturating food conditions (Oxyrrhis marina; ESD =16 µm) from laboratory culture (CSIC, Barcelona, Spain), under a 12:12 light:dark cycle.
Egestion was calculated as the difference between ingested and assimilated carbon biomass.
Carbon budget was calculated using the average carbon biomass of nauplii during the incubation (50.7 ng Cby ind.) |
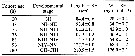 Issued from : R. Almeda, M. Alcaraz, A. Calbet & E. Saiz in Limnol. Oceanogr., 2011, 56 (1). [p.404, Table 1]. Issued from : R. Almeda, M. Alcaraz, A. Calbet & E. Saiz in Limnol. Oceanogr., 2011, 56 (1). [p.404, Table 1].
Cohort composition (dominant stages) at the beginning of the experiments.
Size (total body length for nauplii and prosome length for copepodites) and estimated body weight (W) of the Oithona davisae developmental stages used in the study are also provided.
Carbon content was calculated from size using the equation reported in Almeda & al., 2010 (Mar. Ecol. Prog. Ser., 410: 97-109; doi: 10.3354/meps08625) . |
 Issued from : R. Almeda, M. Alcaraz, A. Calbet & E. Saiz in Limnol. Oceanogr., 2011, 56 (1). [p.411, Table 3]. Issued from : R. Almeda, M. Alcaraz, A. Calbet & E. Saiz in Limnol. Oceanogr., 2011, 56 (1). [p.411, Table 3].
Assimilation efficiencies (AE, %) and net growth efficiencies (NGE, %) of Oithona davisae developmental stages;
W, carbon body weight; T, temperature (°C); I, carbon-specific ingestion rates (µg C by µg C by day); G, carbon-specific growth rates (µg C by µg C by day); Rc, specific respiration rates with filtered seawater (µg C by µg C by day); Rc*, specific respiration under food satiating concentrations (µg C by µg C by day.
I and G were calculated from Almeda & al. (2010) except those from the ''Food effect experiment'' that were estimated from this study.
Note that AE and NGE calculations were based on Rc* (see methods). |
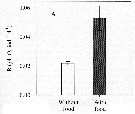 Issued from : R. Almeda, M. Alcaraz, A. Calbet & E. Saiz in Limnol. Oceanogr., 2011, 56 (1). [p.410, Fig.5 A]. Issued from : R. Almeda, M. Alcaraz, A. Calbet & E. Saiz in Limnol. Oceanogr., 2011, 56 (1). [p.410, Fig.5 A].
Effect of food concentration on respiration rates (R) of Oithona davisae nauplii (NII-NIII) incubated at 30°C.
The columns represent the mean value of four replicates and the error bars the corresponding standard error (SE)
Nota: For the authors, food availability appears to be the main factor driving copepod feeding rates in the field (Saiz & Calbet, 2007) and, consequently, it must influence their metabolism (see also Kiørboe & al., 1985). In the case of oithonids, respiration rates of fed adult stages of O. davisae were between 1.4 and 2.8 times higher than for starved animals (see Nakata & Nakane, 1987; Hitomi, 1994).
The observed increase of respiration rates in association with feeding activity is referred to as ''specific dynamic action'' (SDA) and it is attributed to the cost of biosynthesis of new tissue from ingested food (see Kiørboe & al., 1985).
However, besides SDA, the increase on swimming and feeding activity under the presence of food may result in an increase of energetic expenditure (see Paffenhöfer, 1993; 2006).
The respiration rates under starved conditions have been condidered somewhere betweenh basal and routine metabolism (see Ikeda & al., 2001), whereas the respiration rates in the presence of food may be closer to active metabolism. The quantity and quality of food are also important factors (see Conover, 1966; Ikeda, 1977).
The observed changes in respiration rates were temperature dependent. |
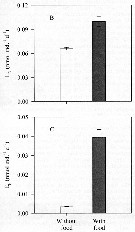 Issued from : R. Almeda, M. Alcaraz, A. Calbet & E. Saiz in Limnol. Oceanogr., 2011, 56 (1). [p.410, Fig.5 B, C]. Issued from : R. Almeda, M. Alcaraz, A. Calbet & E. Saiz in Limnol. Oceanogr., 2011, 56 (1). [p.410, Fig.5 B, C].
Effect of food concentration on ammonium excretion rates (B) and phosphate excretion rates (C) of Oithona davisae nauplii (NII-NIII) incubated at 30°C.
The columns represent the mean value of four replicates and the error bars the corresponding standard error (SE) |
 Issued from : R. Almeda, M. Alcaraz, A. Calbet & E. Saiz in Limnol. Oceanogr., 2011, 56 (1). [p.409, Fig.4]. Issued from : R. Almeda, M. Alcaraz, A. Calbet & E. Saiz in Limnol. Oceanogr., 2011, 56 (1). [p.409, Fig.4].
Relationship between temperature and (A) respiration rates, (B) ammoniul excretion rate, and §C) phosphate excretion rate for Oithona davisae nauplii (NIII-NIV) incubated in filtered sea waters. |
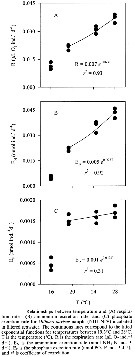
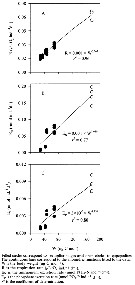 Issued from : R. Almeda, M. Alcaraz, A. Calbet & E. Saiz in Limnol. Oceanogr., 2011, 56 (1). [p.407, Fig.3]. Issued from : R. Almeda, M. Alcaraz, A. Calbet & E. Saiz in Limnol. Oceanogr., 2011, 56 (1). [p.407, Fig.3].
Relationship between carbon body weight and (A) respiration rate, (B) ammonium excretion rate, and (C) phosphate excretion rate for Oithona davisae larval developmental stages incubated in filtered seawater at 20*C. |
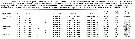 Issued from : R. Almeda, M. Alcaraz, A. Calbet & E. Saiz in Limnol. Oceanogr., 2011, 56 (1). [p.408, Table 2]. Issued from : R. Almeda, M. Alcaraz, A. Calbet & E. Saiz in Limnol. Oceanogr., 2011, 56 (1). [p.408, Table 2].
Average values of weight-specific respiration rates (Rc), ammonia excretion rates (En), phosphate excretion rates (Ep), and metabolic quotients (C:N, N:P, C:P, by atoms) of different larval stages of Oithona davisae. |
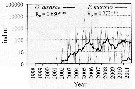 Issued from : I. Uriarte, F. Villate & A. Iriarte in J. Plankton Res., 2016, 38 (3). [p.724, Fig.5]. Issued from : I. Uriarte, F. Villate & A. Iriarte in J. Plankton Res., 2016, 38 (3). [p.724, Fig.5].
Monthly time-series from 1998 to 2011 of Acartia davisae (black) and Pseudodiaptomus marinus (grey) from inner Bilbao estuary (NW Spain). Thicker lines are moving averages. Ro is the Spearman's rank correlation coefficient (***P <0.001).
Nota: From 2003 to 2009, ia replacement in the dominance of indigenous neritic species (such as Acartia clausi) by the newly arriving non-indigenous brackish species Acartia tonsa and Oithona davisae occurred. The species have been found to be able to inhabit low oxygen waters (see Roman & al., 1993; Itoh & al., 2011). |
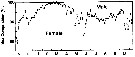
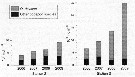
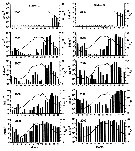 Issued from : D.A. Altukhov, A.D. Gubanova & V.S. Mukhanov in Mar. Ecol., 2014, 35 (suppl 1). [p.31, Fig.2]. Issued from : D.A. Altukhov, A.D. Gubanova & V.S. Mukhanov in Mar. Ecol., 2014, 35 (suppl 1). [p.31, Fig.2].
Seasonal dynamics of O. davisae abundance (bars) and water yemperature (lines) at the mouth (St 2) and centre (St 3) of Sevastopol Bay (Black Sea) from 2005 to 2009. Samples marked 'a' are samples in which no individuals of O. davisae were found. |
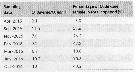
 Issued from : D.A. Altukhov, A.D. Gubanova & V.S. Mukhanov in Mar. Ecol., 2014, 35 (suppl 1). [p.32, Fig.3]. Issued from : D.A. Altukhov, A.D. Gubanova & V.S. Mukhanov in Mar. Ecol., 2014, 35 (suppl 1). [p.32, Fig.3].
Average annual contribution of Oithona davisae to the total copepod abundance at 2 stations: St 2 (mouth of Sevastopol Bay) and St. 3 (internal part) in 2006-2009. |
 Issued from : D.A. Altukhov, A.D. Gubanova & V.S. Mukhanov in Mar. Ecol., 2014, 35 (suppl 1). [p.33, Fig.4]. Issued from : D.A. Altukhov, A.D. Gubanova & V.S. Mukhanov in Mar. Ecol., 2014, 35 (suppl 1). [p.33, Fig.4].
Seasonal dynamics of Oithona nana in 1976-1980 and O. davisae in 2008 and 2009 at the mouth of Sevastopol Bay. |
 Issued from : T. Terbiyik Kurt & S. Besiktepe in Mar. Ecol., 2019. [p.5, Table 2]; Issued from : T. Terbiyik Kurt & S. Besiktepe in Mar. Ecol., 2019. [p.5, Table 2];
Seasonal variations of the ratio of female abundance values of Oithona davisae to Oithona nana and percentage of Oithona davisae in total copepods in the Izmir inner Bay.
Nota: The abundance of O. davisae was high in the summer months (September, July) and in February in the Izmir Bay (South in the Aegean coast of Turkey). This species is thermophilic (Svetlichny & al., 2016).
This species is reported for the first time in the Aegean Sea, collected in August 2017 from 14 stations along the Turkish coast between the opening of the Dardanelles Strait in the north to Izmir Bay in the south.
The abundance of female ranged from 4 ind./m3 in April 2015 to 31, 524 ind./m3 in July 2016, and contributed to the total oithonid female population by 10.8% in April 2015 and 92.8% in September 2016. This species has become a permanent component of the copepod community in the area. |
 Issued from : S. Zamora Terol in Tesis Doc. Univ. Politèc. Catalunya, 2013 [p.82-83, Table 3]. Issued from : S. Zamora Terol in Tesis Doc. Univ. Politèc. Catalunya, 2013 [p.82-83, Table 3].
Comparison of egg production and clutch sizes among different species of Oithona from field and lab studies.
d: maximum specific-egg production rate.
Also, see: Oithona attenuata, O. colcarva, O. aruensis, O. nana, O. plumifera, O. setigera, O. similis, O. simplex. |
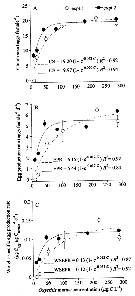
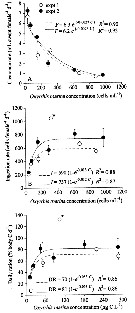 Issued from : S. Zamora Terol in Tesis Doc. Univ. Politèc. Catalunya, 2013 [p.71, Fig. 3]. Issued from : S. Zamora Terol in Tesis Doc. Univ. Politèc. Catalunya, 2013 [p.71, Fig. 3].
Oithona davisae feeding rates as a function of food concentration (C).
(A) Clearance rate (F, ml. female-1 d. -1).
(B) Ingestion rate (I, cells female-1 d-1).
(C) Weight-specific ingestion rate, as percentage of body carbon ingested per day (daily ration, DR, %) are shown.
Exponential decay and Ivlev's equations fits are also shown.
Symbols marked with an asterisk correspond to extreme values not used in the equation fitting.
<< Experiments on adult females coming from continuous culture in laboratory (Institut de Ciències fel Mar (Barcelona, Spain) in October 2000), routinely fed the heterotrophic dinoflagellate Oxyrrhis marina (ESD = 16 µm), which were at the same time fed the cryptophyte Rhodomonas salina (ESD = 8 µm).; all incubations and experiments conduced in a temperature room at 18 ± 1¨C.
Clearance and ingestion rates were determined for each food level according to Frost's equations (Frost, 1972).
Clearance rates were fitted to an exponential decay function:
F = Fmax e-l C.
Where Fmax is the maximum clearance, C is the concentration of food and I is the decay rate.
Ingestion rates were fitted to a type II functional response model using the Ivlev (1961) equation:
I = Imax (1 - ea C).
Where Imax is the maximum ingestion rate, C is the food concentration and a is the rate at which ingestion approaches the maximum rate.
The critical or saturating food concentration (Ks, i.e. the threshold concentration below which feeding is food limited, was calculated as the food concentration at which ingestion equals 95% of the maximum ingestion rate (Almeda & al., 2010).
For the females corresponding to the feeding experiments, the percentage of ovigerous females was determined, and their mean clutch size was quantified buy dissecting all eg sacs present. The average population egg production rates (EPR, eggs female-1 day-1), computed for the ensemble of ovigerous and non-ovigerous females was calculated using egg-ratio method according to the equation modified from Uye & Sano (1995).:
EPR = CS x OF/TF xI T.
Where CS is clutch size (eggs female-1, OF is the number of ovigerous females present in the sample, TF is the total number of females, and IT is the interclutch time (days).
The authors hvve used the interclutch time determined by Uye & Sano (1995) instead of the hatching time (as found in the litterature, Sabatini & Kiørboe, 1994; Castellani & al., 2005), because the interclutch time for O. davisae is longer than the embryonic time at the corresponding experimental temperature (respectively, 2.5 and 1.8 days, Uye & Sano, 1995).
Weight-specific rates were estimated from size measurements and carbon content-size relationship from the litterature. In the case of Oxyrrhis marina biovolume estimates from the Multisizer Counter were converted into carbonj using the conversion factor 0.123 pg C µm-3. (Pelegri & al., 1999). The carbon weight of both eggs and females were estimated by taking digital pictures. For each experimental condition at least 200 eggs and 20 females were measured. (C µg).
The egg diameter (ED µm) was estimated as equivalent circular diameter and then the egg carbon content (µgC) was calculated using the Uye & Sano's equation for O. davisae:
C = 5.32 x 10⁻⁸ x ED3.04.
For adult females estimation of individual biovolume (µm3 at each food level by using the minor and major axis of the cephalothorax to build an ellipsoid. Then using only the major axis, homologous to the prosome length (PL µm), thecarbon content was estimated for all conditions using the Uye's equation:
C = 1.26 x 10⁻⁴ x PL1.31. Finally, average carbon content: biovolume factor, 6.74 µgC µm-3, used to estimate the female biomass from the biovolume measurements.
Clearance rates found show values (average ± SE) ranged from 7.3 ± 0.39 to 0.63 ± 0.06 ml swelt clear /female/day at the lowest and highest food concentration, respectively.
Ingestion rates increased asymptotically when increasing food concentration, showing saturation food concentrations (Ks of 249 cells mL-1, and maximum ingestion rates of 737 cells /female/day.
In terms of weight-specific rates, daily ration (DR) varied from 30% of body carbon ingested by day at the lowest concentration tested, to maximum values of 80% body C/day. The saturation food concentration of Oxyrrhis marina in terms of carbon was 56 µg C L-1. >> |
 Issued from : S. Zamora Terol in Tesis Doc. Univ. Politèc. Catalunya, 2013 [p.73, Fig. 4]. Issued from : S. Zamora Terol in Tesis Doc. Univ. Politèc. Catalunya, 2013 [p.73, Fig. 4].
Relationship between fecundity of Oithona davisae and food concentration.
(C) in terms of : (A) mean clutch size (CS): (B) egg production rate (EPR); (C) weight-specific production rate (SEPR).
Mean values and SE (n=3) are shown.
Ivlev's fits are displayed in the graphs.
<< The effects of food concentration on the fecondity, differently to what happened with ingestion rates, it is observed that although maximum values are simiilar between both experiments, the rate at which both clutch size and egg production reached those maximum values (the a parameter in the Ivlev's fits) are natably different.
Females from expt 2 reached maximum egg production rates at lower food levels than those from expt 1, and the author interpreted that fact as if the young females from expt 1 did not have enough time to mature their gonads. For that reason, the author will only refer to egg production values from expt 2.
Both clutch size (eggs/female, bothb sacs together) and egg production rate (eggs/female/day) increased asymptotically with increasing food concentration;
Clutch size varied in average from 8 eggs to maximum values of 20 eggs, and although the females produced eggs at the lowest food concentration (10-20 µgC L-1) they never reached the clutch size of the highest food levels.
The egg production rates (eggs/female/day) found in this study varied from 1.8 ± 0.07 to 6.5 ± 0.14. It is important to notice that clutch size was only computed for ovigerous females, whereas the egg production rate is computed on a population basis, i.e., also indcludes non-ovigerous females.
The critical concengtration of food at which saturating values (Ks for egg production (EPR) were found was 81 µg C L-1, with egg production rates of approximately 5-6 eggs female/day above this threshold.
The weeight-specific egg production rates (SEPR, µg Cegg µg Cind day-1are shown in Fig.4C). Values (avg. ± SE) ranged from 0.04 ± 0.002 to 0.12 ± 0.003 µg Cegg µg Cind day-1. maximum weight-specific egg production rates corresponded to those females carrying the largest clutch sizes (20 eggs on average). >> |
 Issued from : S. Zamora Terol in Tesis Doc. Univ. Politèc. Catalunya, 2013 [p.77, Table 2]. Issued from : S. Zamora Terol in Tesis Doc. Univ. Politèc. Catalunya, 2013 [p.77, Table 2].
Comparison of literture data on maximum ingestion rate (Imax) and maximum clearance rates (Fmax) among different stages of Oithona davisae feeding on the same type of prey (Oxyrrhis marina in the laboratory. |
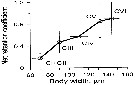 Issued from : L. Svetlichny, E. Hubareva, A. Khanaychenko, A. Gubanova, D. Altukhov & S. Bensiktepe in Turk. J. Fish. Aquat. Sci., 2016, 16. [p.80, Fig.1]. Issued from : L. Svetlichny, E. Hubareva, A. Khanaychenko, A. Gubanova, D. Altukhov & S. Bensiktepe in Turk. J. Fish. Aquat. Sci., 2016, 16. [p.80, Fig.1].
Net retention coefficients of Oithona davisae copepodite stages collected by the plankton net with the mesh size of 100 µm.
Copepod species recently entered into the Black Sea presumably with ballast waters. Samples collected weekly by integrated horizontal tows of 20 m from the depth 0.5- 1.0 m; volume of filtered water 1.43 m3 from 14 January 2013 to 27 January 2014. at the permanent station (depth 3 m) located opposite the exit of Sevastopol Bay near the Institute of Biology of the Southern Seas embankment.
The net retention coefficients (Cn) for copepodite stages and adults were calculated as the ratio between the number of individuals collected with the net (Nn, ind m3) and the number of organisms in the bottle container (Nb ind m3 : Cn = Nn / Nb.
Females prosome width 143 ± 4 µm and males prosome width 147 ± 14 µm. Copepodites V females prosome width 126 ± 3 µm and males prosome width 138 ± 5 µm. For copepodites III and IV the prosome width: 80-120 µm. Mean Cn for copepodites I and II (prosome width 60-80 µm) was found to be 0.17 ± 0.08. |
 Issued from : L. Svetlichny, E. Hubareva, A. Khanaychenko, A. Gubanova, D. Altukhov & S. Bensiktepe in Turk. J. Fish. Aquat. Sci., 2016, 16. [p.82, Fig.4]. Issued from : L. Svetlichny, E. Hubareva, A. Khanaychenko, A. Gubanova, D. Altukhov & S. Bensiktepe in Turk. J. Fish. Aquat. Sci., 2016, 16. [p.82, Fig.4].
Oithona davisae in Sevastopol Bay during 2013: Seasonal variation in temperature (solid line) and clutch size (o, open circle) (A), share of ovigerous females (B), egg production rate (C).
Nota: The abundance of O. davisae was highest in September-November at 15-23°C and decreased dramatically in winter-spring period at a temperature ± 8°C. From the end of February (8°C) till the middle of May (17.5°C) the population was represented only by adult females. Copepodites were observed first only the water temperature increased to 17.5°C, and males appeared only in late May at 22°C. The revealed seasonal trends in copepod abundance and reproduction from field and experimental data suggest that winter population of O. davisae survives the cold season in the Black Sea at the stage of fertilized females which give the birth to the next generation in favorable spring conditions.
At the end of March the share of females with ovisacs containing 4.5 ± 2 eggs increased up to 25% of the total number of females (27 ±13 ind m3 (A, B in figure).
The first annual peak of ovigerous females (50% of total female number) with the clutch size of 12 ± 3 eggs was recorded on 13 May. Maximum clutch size of 20 ±7 eggs was observed during the periocd from the end of May till the end of July within the temperature range from 22 to 25 °C. In August with significant decrease in clutch size (12.4 ± 2.5 eggs) while the temperature increased up to 27°C. From October to December 2013 the temperature dropped from 20 to 9°C, and the clutch size decreased from 14.2 ± 2.5 to 4.2 ± 2.0 eggts.
maximum egg production rate up to 6 eggs/female/day was observed during the period from late May till start of August (see figure C).
The maximum recorded share of dead females (up to 18% from the total numbe(r total abundance of this fraction) in October and December 2013 whilst the annual average value of dead individuals in the sample was about 6.3 ± 5 %. The maximum share of dead males was recorded in January and December 2013 (37 and 11% of total abundance of males, respectively).
From May till December 8 pronouced peaks in number of ovigerous females with mean periodicity of 25 ±5 days were observed, presumably corresponding to the number of generations. In Fukuyama Harbor the share of ovigerous females in O. davisae adult part of population also varied all year round (Uye & Sano, 1995), but they did not show such pronounced periodicity in the share of ovigerous females as founded in Sevastopol Bay where the development of O. davisae is strictly synchronized with the temperature.
After the authors, this is the first study that proves the possibility of the long-term preservation of viable sperm after mating by overwintering females in natural environment |
 Issued from : L. Svetlichny, E. Hubareva, A. Khanaychenko, A. Gubanova, D. Altukhov & S. Bensiktepe in Turk. J. Fish. Aquat. Sci., 2016, 16. [p.83, Fig.5]. Issued from : L. Svetlichny, E. Hubareva, A. Khanaychenko, A. Gubanova, D. Altukhov & S. Bensiktepe in Turk. J. Fish. Aquat. Sci., 2016, 16. [p.83, Fig.5].
Oithona davisae in Sevastopol Bay during 2013 : Effect of temperature on the reproductive activity of freshly collected overwintering females (A) and the share of ovigerous females at 20°C after the incubation during 17 (shaded squares), 34 (open squares), 56 (black circles, and 71 (open circles) days at 8¨C (B).
All females used in experiments were collected at the beginning of March.
The authors suggest << that O. davisae population survives cold season in the Black Sea at the stage of fertilized females (Hubera & Svetlichny, 2013) basing on the fact that about 97% of overwintering females started to produce viable eggs within 2-3 days after the transfer from the ambient sea water (8°C) to the warm water (22-24°C). Females were found to live up to 80-120 days and to spawn eggs during 30 days after only one mating at 20°C in laboratory experiments (Ceballos & Kiørboe, 2011) Consequently, at lower temperature of the Black Sea, the period of preservation of viable sperm afetr mating could be longer than that in the experiments. The long preservation of alive sperm by fertilized O. davisae was proved also by the fact that according to our experimental results, 87 and 47 % females collected in Marchj at 8°C and exposed in experimental conditions to prolonged (56 and 71 days, respectively) incubation at 8°C were able to produce viable eggs. The last males of winter generation were observed on 25 February 2013 at 8°C, it is assumed that the first copepodites of spring generation collected in the sea on 13 May (in 76 days) originated from the eggs of overwintering females fertilized before the disappearance of males.
This is the first study that proves the possibility of the long-term preservation of viable sperm after mating by overwintering females in natural environment. Earlier the possibility to produce viable eggs in several months after fertilization was shown in diapausing females of Cyclops strenuus (Naess & Nilssen, 1991) and harpacticoid Harpacticus uniremi (Jewett & Feder, 1977). Cyclopoid females as a rule need to be fertilized only once in the lifetime (Smyly, 1970), and there is no evidence of any diapauses stage in cyclopoids (Alekseev & Starobogatov, 1996; Marcus, 1996) >>. |
 Issued from : L. Svetlichny, E. Hubareva, A. Khanaychenko, A. Gubanova, D. Altukhov & S. Bensiktepe in Turk. J. Fish. Aquat. Sci., 2016, 16. [p.84, Fig.6]. Issued from : L. Svetlichny, E. Hubareva, A. Khanaychenko, A. Gubanova, D. Altukhov & S. Bensiktepe in Turk. J. Fish. Aquat. Sci., 2016, 16. [p.84, Fig.6].
Oihtona davisae in Sevastopol Bay during 2013 : Effect of temperature on respiration rate of overwintering females (A) and ontogenetic changes of respiration rate from nauplii to copepodite stages II and III.
Nota: Respiration rate (R) of females collected in March was 0.00219 ± 0.00044 µg O2 ind-1h-1 at 8°C and increased up to 0.00925 ± 0.0020 µg O2 ind-1 h-1 at 28°C.
Respiration rates of females from summer population and that of spring females (both acclimated to 20°C) and measured at the same temperature did not differ significantly. However, weight-specific respiration rate of summer females was significantly 1.32 fold higher than that of spring females because of the difference in body size and weight (see in Table 1). The ratio between total and basal metabolism of both summer and spring females amounted to 3. |
 Issued from : L. Svetlichny, E. Hubareva, A. Khanaychenko, A. Gubanova, D. Altukhov & S. Bensiktepe in Turk. J. Fish. Aquat. Sci., 2016, 16. [p.84, Table 1]. Issued from : L. Svetlichny, E. Hubareva, A. Khanaychenko, A. Gubanova, D. Altukhov & S. Bensiktepe in Turk. J. Fish. Aquat. Sci., 2016, 16. [p.84, Table 1].
Oithona davisae in Sevastopol Bay during 2013 : Respiration rate (R), weight-specific respiration rate (R WW-1) and morphologic characteristics (active and anesthetized) females during spring and summer periods.
Nota: The authors indicate the ability of females of O. davisae to survive winter in a state of reduced metabolic activity which is similar to metabolic arrest, manifested in diapausing stages of some species of marine pelagic copepods (Svetlichny & al., 1998; Auel & al., 2005).
Another effect on the respiration rate arises also from the movements (activity or passivity) of the animals. |
 Issued from : L. Svetlichny, E. Hubareva, A. Khanaychenko, A. Gubanova, D. Altukhov & S. Bensiktepe in Turk. J. Fish. Aquat. Sci., 2016, 16. [p.86, Fig.8]. Issued from : L. Svetlichny, E. Hubareva, A. Khanaychenko, A. Gubanova, D. Altukhov & S. Bensiktepe in Turk. J. Fish. Aquat. Sci., 2016, 16. [p.86, Fig.8].
Respiration rate (R) of Oithona davisae and other Black Sea copepod at 20°C. |
 ssued from : L. Svetlichny, E. Hubareva, A. Khanaychenko, A. Gubanova, D. Altukhov & S. Bensiktepe in Turk. J. Fish. Aquat. Sci., 2016, 16. [p.85, Fig.7]. ssued from : L. Svetlichny, E. Hubareva, A. Khanaychenko, A. Gubanova, D. Altukhov & S. Bensiktepe in Turk. J. Fish. Aquat. Sci., 2016, 16. [p.85, Fig.7].
Frequency diagram of jump in Oithona davisae females in Sevastopol Bay from spring (black squares) and summer (open squares) generations. Effect of crowding on jump frequency of females from summer population (B).
Nota: << General motility pattern in undisturbed active females included sinking with ventral side down and upward jumps. Each jump consisted of 1-5 multiple kicks (average 1.2 ± 0.2) with the use of the antennules, thoracic legs and abdomen. Jump frequency distribution of spring and summer females was unimodal with strong differences in modal values . At the same density (5 ind ml-1 and temperature (20°C) average jump frequency (37.3b ±b 14.5 min-1) of spring females was significantly lower than that of summer females (96.4 ± 16.7 min-1). The authors recorded crowding effect in summer females at 25°C only at the density more than 40 ind ml-1, at 60 ind ml-1 jump frequency increased up to 270 ± 70 jump m-1. |
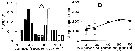
 Issued from : S. Ceballos & T. Kiørboe in 2011, PLoS ONE 6(4): e 18870. doi: 10.1371/journal.pone.0018870. [p.4, Fig.1]. Issued from : S. Ceballos & T. Kiørboe in 2011, PLoS ONE 6(4): e 18870. doi: 10.1371/journal.pone.0018870. [p.4, Fig.1].
Male (A) and female (B) life span.
Nota: The average longevity of virgin males was significantly longer than that of mated males in both experiments. The effect was most pronounced in the experiment where one male was incubated which 10 females (40 vs 19 days) but still significant in the incubation with only 2 females per 2 males (31 vs 26 days). The life span of males in celibate was the same irrespective of the density in the incubations (single vs group of 4). The maximum individual life span of mated and virgin males were between 1 and 2 months and > 3 months, respectively (Fig. 1A);
As for females longevity of virgin females was significantly longer than that of mated females (Fig.1B). Virgin females lived an average of 73 (68-77) days, the longevity of females incubated in groups of 2 male and 2 females was 64 (58-69) days, and females that had access to different groups of males lived 43 (37-50) days. Hence, mating activity also had an effect on female longevity although not as strong as in males.
Males have a low mating capacity. Average mating rate was <2.5 matings per day during the first 4 days of adult life. Only 4% of 10-day-old males mate, and 20 days after maturation males did not mate at all. This senescence is independent of previous marying history since males living in celibacy for 5-10 days after maturation had similarly low mating rates when eventually offered females.. Hence, age has an important effect on male mating capacity and males get reproductively old ca. 10 day after maturation During this time they produced an average of 11 (8-14) spermatophores, which means that they are able to mate with 5.5 (4-8) females (2 spermatophores transferred in each mating event. |
 Issued from : S. Ceballos & T. Kiørboe in 2011, PLoS ONE 6(4): e 18870. doi: 10.1371/journal.pone.0018870. [p.6, Fig.4]. Issued from : S. Ceballos & T. Kiørboe in 2011, PLoS ONE 6(4): e 18870. doi: 10.1371/journal.pone.0018870. [p.6, Fig.4].
Female fertile life span.
The authors note whether the relatively short fertile period (around 2 weeks) of the females relative to their total life span was due to exhaustion of egg production capacity or due to an age-dependent loss of fertility. Examination of the fertility in old virgins (30 days after maturation). Following mating, these females produced fertile eggs in a temporal pattern resembling that the younger females, with a peak of 8 days after mating and a subsequent gradual decline, but at a significantly lower level. 75% of the old virgin females mated, but 1/3 of these did not produce any nauplii even though they had spermatophores attached. The offspring production was 18 ±23 nauplii (95% CI: 8-29), ca. 3 times less that of the young females, but their fertile life lasted almost as long that of the young females (11±10 days, 95% CI: 6-15, Fig.4).
These observations suggest a rather fixed duration of the fertile period independent of the age at which the female is fertilized, but a lower fertility of older female;
Females can fertilize all the eggs they produce with just one mating. The number of egg batches, total number of offspring and the duration of fertile life for females repeatedly exposed to males were not different from that of females exposed to males only once.
The duration of the reproductive period to the average longevity in other small copepods is substantially longer, i.e. , 26 day reproductive period in Acartia rtonsa (Parrish & Wilson, 1978) and 22 days in Centropages typicus (Carlotti & al., 1997) relative to average longevities of less than 30 days for both species under laboratory conditions.
The authors suggest that the capability of virgin females to remain fertile even at high age may be interpreted as an adaptation to fertilization limitation owing to low male encounter rates during long periods of the year and/or low mating capability of the males. It could also increase their chance of finding and choosing a high quality partner without a large loss in offspring production.
A long post-reproductive life of those individuals that mate at early age would then be a secondary consequence of such an adaptation.
The fact that male:female sex ratios in field populations of O. davisae are about 1:10 combined with the low mating capacity of males (on average 5 life-time matings per male in a predator-free environment) indeed suggests that a large fraction of the females in a population will never be mated and that fertilization limitation is severe (as suggested earlier, see in Kiørkoe, 2007). Field observations that only about 1/3 of the adult females are actively reproducing support this picture (see Uye & Sano, 1995). The question is to know if this evolutionary stable strategy life is correct. |
 Issued from : C. Castellani, C. Robinson, T. Smith & R.S. Lanpitt in mar. Ecol/ Progr. Ser., 2005, 285. [p.132, Table 1]. Issued from : C. Castellani, C. Robinson, T. Smith & R.S. Lanpitt in mar. Ecol/ Progr. Ser., 2005, 285. [p.132, Table 1].
Oithona spp. Summary of respiration rates (range) reported in the litterature in different regions.
c: converted to dry weight from wet weight assuming 81% water content (Mauchline, 1998).
Cf. Oithona similis to compare to other species in Table 1 in the same authors. |
| | | | Loc: | | | San Francisco (Bay, Sacramento-San Joaquin estuary), China Seas (Yellow Sea), S & E Korea, Yongsan River estuary, Japan (Atiake Bay, Tokyo Bay, Fukuyama harbor, Uranouchi Inlet, Ariake sea: Chikugo River estuary, Honshu: Maizuru Bay, Lake Nakaumi), S Chile (Aysén Fjord), NE Atlant. (NW Spain), Bilbao estuary, North Sea (N Wadden Sea), Medit. (Barcelona Harbour, Aegean Sea, Black Sea, Sevastopol Bay, Bulgarian coast) | | | | N: | 64 | | | | Lg.: | | | (621) F: 0,62-0,54; M: 0,53-0,47; (866) F: 0,49-0,61; M: 0,47-0,54; (1239) F: 0,48-0,58; {F: 0,48-0,62; M: 0,47-0,54} | | | | Rem.: | According to Nishida (1985, p.38), this species can be distinguished from O. aruensis and O. wellershausi by the presence of only one seta on endopodite of Mx1. Among the specimens referred to as O. aruensis by Nishida & Ferrari (1983), those of Tokyo Bay proved to be O. davisae, whereas those from Penang Harbor, Surabaya Harbor and Kabira Bay are O. aruensis.
For Yoo & Lim (1993, p.94) the species is very similar to O; brevicornis Giesbrecht, 1891, except some differences: body length, length of 1st spine in Mx1 inner lobe 1 (length of 1st spine in the lobe 1 of O. brevicornis is equal to that of the rest spines, but that of O. davisae is two times as long), and the location of outer marginal seta in caudal rami (the location of outer marginal seta in caudal rami is near the base of caudal rami in O. brevicornis, whereas the location in O. davisae is in the middle between base and terminal part).
This species is considered as a colonisation example of North America and Chile by transoceanic ships coming from Asia (cf. map of J.T. Carlton, 1987).
Its presence NW of Spain, observed by Calbet & al. (2005), would be its first record in the Atlantic Ocean.
Observed in ballasts of ships in San Francisco.
Alcaraz (pers. comm., 2008) points to the occurrence of this species in the harbour of Barcelona in 2001, after Callet & Saiz (probably recent introduction). The identification is confirmed by Nishida (2008)
According to Cordell & al., 2008 (p.753) the 1st record of this species in San Francisco estuary is 1963.
For Gubanova & al. (2013, p.5) this species is an invader expanding along the Black Sea coast since 2009 (under the name Oithona brevicornis).
After Temnykh & Nishida (2012, p.429) O. brvicornis that has been reported to be recently introduced into the Black Sea is indeed O. davisae. After Mihneva & Stefanova (2013, p.119) the species was discovered along the west coast of the Black Sea in 2009-2012. In the short period since its discovery off the Bulgarian coast, the populations have increasede to become one of the dominant zooplankters, contributing up to 63.5-70.5 % of total mesozooplankton numbers in the Varna Bay and adjacent open sea waters. This species thrived in early autumn with a maximum density of 43818 ind.m3 in the eutrophic Varna Bay.
Probably invasive in the northern Wadden Sea: 55°01.30'N, 08°27.10'E (North Sea) (See A. Cornils & B.-W. Heckmann, 2015).
For Ohtsuka & Nishida (2017, p.573) the species dominating in estuaries and embayment waters of Japan and previously reported as Oithona nana (i-e Yamazi, 1955; Hirota & Hara, 1975) were O. davisae. For the authors, in the Inlet and brackish waters on the main islands of Japan, this species is dominant. After Ohtsuka & Nishida (2017, p.578) the species is very abundant in the Ariake Sea, Lake Nakaumi, and Tokyu Bay, reaching about 1 million individuals/m3. For these authors, the species prefers dinoflagellates to diatoms (Uchima, 1988). For these authors, (p.583), mating behavior was observed by Uchima & Murano (1988). This behavior differs from that of calanoids in precopulatory spiraling by the male in search of a mate and to diffuse the pheromone released from the female; grasping of specialized setae on female P4 by both A1 of the male. The function of the special ''cephalosome flap organ'' (Nishida, 1986) located laterally on the male cephalothorax is not clear but may be involved in perception of hydrodynamic disturbance or sex pheromones during spiraling. | | | Last update : 16/12/2020 | |
|
|
 Any use of this site for a publication will be mentioned with the following reference : Any use of this site for a publication will be mentioned with the following reference :
Razouls C., Desreumaux N., Kouwenberg J. and de Bovée F., 2005-2026. - Biodiversity of Marine Planktonic Copepods (morphology, geographical distribution and biological data). Sorbonne University, CNRS. Available at http://copepodes.obs-banyuls.fr/en [Accessed June 15, 2026] © copyright 2005-2026 Sorbonne University, CNRS
|
|
|
|


;)
;)
;)
;)
;)
;)
;)
;)

;)
;)
;)
;)
;)
;)
;)
;)
;)
;)
;)
;)
;)
;)
;)
;)
;)
;)
;)
;)
;)
