|
|
 |
|
Calanoida ( Order ) |
|
|
|
Diaptomoidea ( Superfamily ) |
|
|
|
Acartiidae ( Family ) |
|
|
|
Acartia ( Genus ) |
|
|
|
Acartiura ( Sub-Genus ) |
|
|
| |
Acartia (Acartiura) clausi Giesbrecht, 1889 (F,M) | |
| | | | | | | Syn.: | no Acartia clausi : Farran, 1929 (part., p.210, 281); Gurney, 1931 a (part., p.220); Mori, 1937 (1964) (p.103, figs.F,M); ? Dakin & Colefax, 1933 (p.207); 1940 (p.105, figs.F,M); Shen & Bai, 1956 (p.223, figs.F,M); Kott, 1957 (p.12); ? Yamazi, 1958 (p.152, Rem.); Bradford, 1972 (p.32, figs.F,M); Landry, 1978 (p.685, P/B quotient); 1978 a (p.77, production); ? Itoh & Iizuka, 1979 (p.5); Uye, 1980 (p.1, development); 1980 a (p.11, isochronal development); 1981 (p.255, egg production); 1982 (p.55, population dynamics, production); Ueda & al., 1983 (p.166, 167, 169); Uye, 1985 (p.440, Rem;: = A. omorii); ? Nakai, 1955 (p.12, chemical composition); ? Hirota & Hara, 1975 (p.115, fig.5); ? Hirota, 1981 (p.19, Table 1); ? Ayukai, 1987 (p.137, feeding, defaecation rate);
? Acartia sp. A (F) Razouls, 1972 (Annexe: p.101, figs.F: anomaly);
? Acartia sp. B (F) Razouls, 1972 (Annexe: p.102, figs.F: anomaly)
Acartia clausi gabonensis Rahm, 1955 (p.155); : Le Borgne & Dufour, 1979 (p.1, Rem.: p.13: in Ebrie Lagoon);
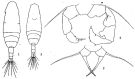
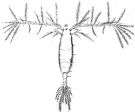
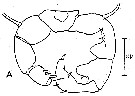
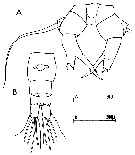
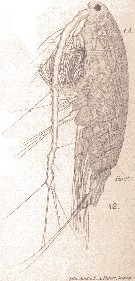
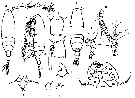
Acartia spp. : Hansen B.W. & al., 2016 (p.131, embryonic strain); Hansen B.W. & al., 2017 (p.984, pH effects).. | | | | Ref.: | | | Giesbrecht, 1892 (p.507, 522, figs.F,M); Karavaev, 1894 (p.29, figs.F, M, Rem.); Giesbrecht & Schmeil, 1898 (p.152, figs.F,M); Sars, 1903 (p.150, figs.F,M); Farran, 1908 b (p.87); Lysholm, 1913 (p.7); Willey, 1920 a (p.20); Pesta, 1920 (p.546); Lysholm & Nordgaard, 1921 (p.28); Steuer, 1923 (p.5, figs.F,M); Esterly, 1924 (p.103, figs.F,M, Rem.); Sars, 1925 (p.361); Farran, 1926 (p.292); 1929 (part.: 210, 281); Candeias, 1926 (1929) (p.43, figs.F,M); Campbell, 1929 (p.319, Rem.); Steuer, 1929 (p.497, fig.M); Rose, 1929 (p.47); Gurney, 1931 a (p.220, figs.F,M); Rose, 1933 a (p.271, figs.F,M); Jespersen, 1934 (p.123, figs.30, 32, Rem.); 1940 (p.68); Farran, 1948 a (n°12, p.3, figs.F); Brodsky, 1950 (1967) (p.420, figs.F,M, Rem.); Marques, 1951 a (p.14); 1955 (p.39); Conover, 1956 (p.156 & suiv., figs. Nauplius, juv.); Chiba & al., 1957 (p.310); 1957 a (p.12); Chen & Zhang, 1965 (p.111, figs.F,M, Syn. part.); Vilela, 1965 (p.10); Marques, 1966 (p.9); Faber, 1966 (p.191, figs.N); Marques, 1973 (p.245); Shih & al., 1971 (p.29, 141); Crisafi & Crescenti, 1972 (1974) (p.225, figs.F,M); Razouls, 1972 (p.95, Annexe: p.98); Carillo & al, 1974 (part., p.452, figs.F, Rem.: Atlantic forms, non Pacific forms); Sullivan & al., 1975 (p.176, fig.Md); Kos, 1976 (Vol.II, figs.F,M, Rem.); Bradford, 1976 (p.164, figs.F,M); Dawson & Knatz, 1980 (p.8, figs.F,M); Arnaud & al., 1980 (p.213, gut structure); Brylinski, 1981 (p.255, figs.F,M); Klein Breteler, 1982 (p.5, figs.); Schnack, 1982 (p.145, fig.Md); Gardner Szabo, 1982 (p.414, figs.F, M); Yoo & Hue, 1983? (p.11, figs.F,M); Kurashova & Abdullaeva, 1984 (p.931, figs.F,M); Brylinski, 1984 (p.961, figs.F: anomalies); Zheng Zhong & al., 1984 (1989) (p.258, figs.F,M); Roe, 1984 (p.359); Sazhina, 1985 (p.80, figs.Nauplius); Kos, 1985 (p.242); Coen & Mazzocchi, 1985 (p.789, figs.F,M); Ueda, 1986 (p.131-132: Rem.); 1986 b (p.134, figs.F, Rem.); Schnack, 1989 (p.137, tab.1, fig.6: Md); Kang & Lee, 1990 (p.378, Rem.); Huys & Boxshall, 1991 (p.65, fig.); Durbin E.G. & al., 1992 (p.342, Rem.: p.343, affinities with A. clausii); Shadrin & Popova, 1994 (p.179, figs.F,M, Rem.); Cervelli & al., 1995 (p.117, Rem.: biol. mol.); Belmonte, 1998 a (p.38, fig., Rem.: eggs); Bradford-Grieve, 1999 (n°181, p.3, figs.F,M); Barthélémy, 1999 (p.857, 862, 863, figs.F); 1999 a (p.9, Fig.22, A, B); Bucklin & al., 2000 (p.1237, Rem: molecular genetic analysis); Castro-Longoria, 2001 (p.225, fig.3); Boxshall & Halsey, 2004 (p.51: figs.F,M); Seuront, 2005 (p.1303, tab. I, II); Conway, 2006 (p.13, 25, copepodite stages 1-6, Rem.); Avancini & al., 2006 (p.107, Pl. 75, figs.F,M, Rem.); Vives & Shmeleva, 2007 (p.411, figs.F,M, Rem.); Gubanova & al., 2013 (in press, Rem: p.3, Table 1, 4, fig.2); Laakmann & al., 2013 (p.862, figs.1, 2, 3, 5, Table 1, 2, molecular Biology). | 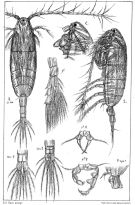 issued from : Sars G.O. in An Account of the Crustacea of Norway. Vol. IV. Copepoda Calanoida. Published by the Bergen Museum, 1903. [Pl.CI]. Female and Male. Rem: P5 = fifth leg
|
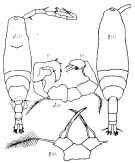
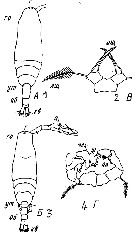
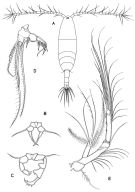 issued from : G.A. Boxshall & S.H. Halsey in The Ray Society, 2004. [Fig.2, p.51]. Female: A, habitus (dorsal view); B, P5. Male: P5. D, Mxp.; E, A2. A-C from Sars, 1903; D-E from Huys & Boxshall, 1991. Rem: P5 = fifth leg
|
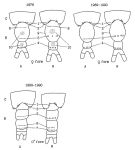 issued from : N.V. Shadrin & E.V. Popova in Hydrobiologia, 1994, 292/293; [Fig.1, p.180]. Schematic representation of the urosome (B) and last prosomal segments for two forms (A and N) (years 1976 and 1989-90) 1-10: the numbers of the areas having different number of spines (See p.181-183, table 2,2a,3,4). Black Sea (Crimean south-western part)
|
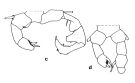
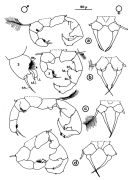 issued from : J.M. Brylinski in J. Plankton Res., 1981, 3 (2). [Fig.2, p.257]. Structure of P5 of the Acartia in the wet docks of the harbour of Dunkirk (Strait of Dover). Male and Female a: Acartia clausi; b: A. tonsa, c: A. discaudata, d: A. bifilosac.f.: curved finger, c.n.: curved needle, d.t.: distal tooth, l.: lamella, l.p.: lamellar process, p.t.: proximal tooth, s.: setae, sp.: spines, 3, segment 3 of left leg. Rem: P5 = fifth leg
|
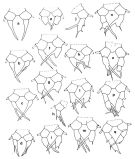 issued from : J.M. Brylinski in J. Plankton Res., 1984, 6 (6). [Fig.1, p.962]. Different types of anomalies of P5 Female in the wet docks of the harbour of Dunkirk and in the Strait of Dover. a: P5 (normal), b-q: P5 (withh anomalies). Rem: P5 = fifth leg
|
 ssued from : J.M. Brylinski in J. Plankton Res., 1984, 6 (6); [Fig.2, p.963]. Stucture of P5 Male. c: P5 (normal); d: P5 (with anomaly). Rem: P5 = fifth leg
|
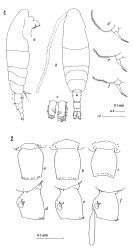 issued from : J. M. Bradford in N.Z. J. Mar. Freshw. Res., 1976, 10 (1). [Figs.2,3]. Female ( from W France: Brest; Italy: Genoa Harbour): 1a, habitus (lateral view); 1b, idem (dorsal view); 1c, caudal rami (right, L: length, W: width); 1d-f, P5; 2, genital segment, a-c: dorsal view; d-f, lateral view. Rem: P5 = fifth leg
|
 issued from : J. M. Bradford in N.Z. J. Mar. Freshw. Res., 1976, 10 (1). [Fig.4]. Male ( from W France: Brest; Italy: Genoa Harbour): : a, habitus (lateral view); b, idem (dorsal); c, P5 (anterior surface); d, posterior surface of left basipod 2 of P5; e, terminal segment of left P5. Rem: P5 = fifth leg
|
 issued from: Q.-c Chen & S.-z. Zhang in Studia Marina Sinica, 1965, 7. [Pl.49, 1-4]. With doubt. Female (from E China Sea): 1, habitus (dorsal); 2, P5 (posterior). Male: 3, habitus (dorsal); 4, P5 (posterior).
|
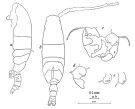
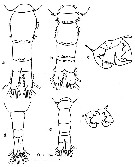
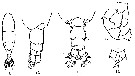
 Issued from : K.A. Brodskii in Calanoida of the Far Eastern Seas and Polar Basin of the USSR. Opred. Fauna SSSR, 1950, 35 (Israel Program for Scientific Translations, Jerusalem, 1967) [p.420, Fig.296]. Female (from Sea of Japan): habitus (dorsal); S5, P5. Male: habitus (dorsal); S5, P5 (Le = left leg; Ri = right leg).
|
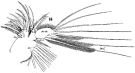
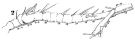
 issued from : W. Giesbrecht in Fauna Flora Golf. Neapel, 1892, 19. [Taf.42, fig.32]. Female: 32, habitus (dorsal).
|
 issued from : W. Giesbrecht in Fauna Flora Golf. Neapel, 1892, 19. [Taf.43, Fig.3]. Female: 3, thoracic segment 5 and urosome (ventral).
|
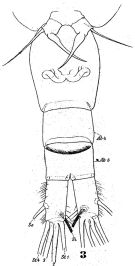
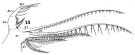
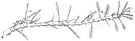
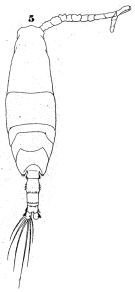 issued from : W. Giesbrecht in Fauna Flora Golf. Neapel, 1892, 19. [Taf.43, Fig.5]. Male: 5, habitus (dorsal).
|
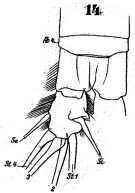 issued from : W. Giesbrecht in Fauna Flora Golf. Neapel, 1892, 19. [Taf.43, Fig.14]. Male: 14, anal segment and caudal ramus (dorsal).
|
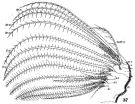
 issued from : W. Giesbrecht in Fauna Flora Golf. Neapel, 1892, 19. [Taf.30, Fig.4]. Female: 4, A1 (ventral view).
|
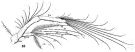 issued from : W. Giesbrecht in Fauna Flora Golf. Neapel, 1892, 19. [Taf.30, Fig.13]. Female: 13, A2.
|
 issued from : W. Giesbrecht in Fauna Flora Golf. Neapel, 1892, 19. [Taf.30, Fig.14]. Female: 14, Mx1 (posterior view).
|
 issued from : W. Giesbrecht in Fauna Flora Golf. Neapel, 1892, 19. [Taf.30, Fig.15]. Female: 15, Mxp.
|
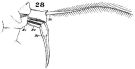 issued from : W. Giesbrecht in Fauna Flora Golf. Neapel, 1892, 19. [Taf.30, Fig.28]. Female: 28, P5
|
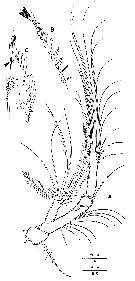
 issued from : W. Giesbrecht in Fauna Flora Golf. Neapel, 1892, 19. [Taf.30, Fig.37]. Female: 37, Mx2 (posterior view).
|
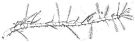
 issued from : W. Giesbrecht in Fauna Flora Golf. Neapel, 1892, 19. [Taf.30, 2]. Male: 2, right A1.
|
 issued from : W. Giesbrecht in Fauna Flora Golf. Neapel, 1892, 19. [Taf.30, Fig.6]. Male: 6, left A1 (ventral view).
|
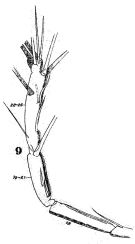 issued from : W. Giesbrecht in Fauna Flora Golf. Neapel, 1892, 19. [Taf.30, Fig.9]. Male: 9, right A1 (distal portion).
|
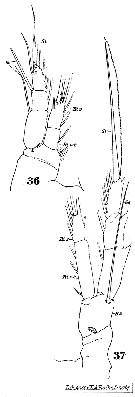
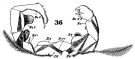 issued from : W. Giesbrecht in Fauna Flora Golf. Neapel, 1892, 19. [Taf.30, Fig.36]. Male: 36, P5. Pd = right leg; Ps = left leg; B = basipodite; Re = exopodite.
|
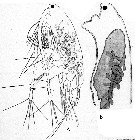
 issued from : G. Zagami & L. Guglielmo in Mem. Biol Mar. Oceanogr.,1988-89, 17. [p.62, Fig.1]. Comparison between and from Sicilia (Italia).
Acartia clausi: a, urosome female (dorsal view); b, urosome male (dorsal view); c, P5 male.
Acartia margalefi: d, urosome female (dorsal view); ; e, urosome male (dorsal view); f, P5 male.
|
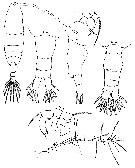
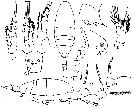 issued from : C.O. Esterly in Univ. Calif. Publs Zool., 1924, 26 (5). [p.103, Fig. L). Female (from San Francisco Bay): 1, P4; 2, P2; 3, P3; 4, habitus (dorsal); 5, ending margin of last thoracic segment and genital segment (lateral, right side); 6, A2; 7, forehead (lateral); 8, P1; 9, genital segment (ventral); 10, habitus (lateral); 11, Md (cutting edge); 12, P5; 13, right P5; 14, A1. Nota: Relative lengths of segments of cephalothorax (along middorsal line) 52:17:7:13:15. Relative lengths of abdominal segments and caudal rami 17:7:4:8
|
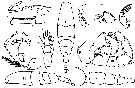 issued from : C.O. Esterly in Univ. Calif. Publs Zool., 1924, 26 (5). [p.104, Fig. M). Male: 1, grasping A1; 2, denticulation on grasping A1, proximal to geniculation; 3, habitus (dorsal); 4, forehead (lateral); 5, terminal segment of left P5; 6, terminal part of Mxp; 7, left P5; 8, exopod of P1; 9, margin of last part of thorax, to show spines; 10, P5; 11, habitus (lateral); 12, posterior margin of thorax and urosome. Nota: Relative lengths of segments of cephalothorax (along middorsal line) 50:18:6:15:12. Relative lengths of abdominal segments and caudal rami 9:11:6:4:4:7.
|
 issued from : C. Razouls in Th. Doc. Etat Fac. Sc. Paris VI, 1972, Annexe. [Fig.56, B, D, F]. Female (from Banyuls, G. of Lion): B, urosome (lateral); D, P5; E, urosome (dorsal).
|
 issued from : C. Razouls in Th. Doc. Etat Fac. Sc. Paris VI, 1972, Annexe. [Fig.57, A]. Female (from Banyuls, G. of Lion): A, P5.
|
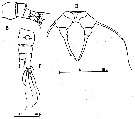
 issued from : P. Crisafi & M. Crescenti in Boll. Pesca Piscic. Idrobiol., 1972 (1974), 27 (2). [p.241, Pl.I]. Female (from Milazzo, Sicily): f, habitus (dorsal); f ad, posterior thoracic part and urosome (dorsal; f ad l, idem (lateral); f P5, P5; f A1, A1. Male: m ad, posterior thoracic part and urosome (dorsal); m P5, P5
|
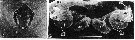 issued from : R.-M. Bathélémy in J. Mar. Biol. Ass. U.K., 1999, 79. [p.860 ,Fig.3, A-B]. Scanning electon miccrograph. Female (from Gulf of Marseille, NW Mediterranean Sea): A, genital area (external ventral view); B, internal dorsal view (note the characteristic loop-like form of the seminal duct sd). Scale bars: 0.030 mm (A); 0.020 mm (B). Symbols: * = fixation site of the spermatophore; small arrow = genital slit; sd = seminal duct; sr = seminal receptacle; ap = apodeme; ed = egg-laying duct.
|
 issued from : A. Steuer in Arb. zool. Inst. Univ. Innsbruck, 1923, 1 (5). [p.7, Figs.9-13]. As Acartia clausi var. gaboonensis. With doubt. Female (from Cameroon): 9, habitus (dorsal); 10, last thoracic segment and urosome (dorsolateral); 13, P5. Male: 11, last thoracic segment and urosome (dorsal); 12, P5
|
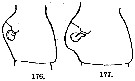 issued from : A. Steuer in Arb. zool. Inst. Innsbruck, 1923, 1 (5). [p.44, Figs.176, 177]. Comparison of the genital segment (left lateral view) in Acartia clausi (176) and Acartia clausi var. gaboonensis (177).
|
 issued from : A. Steuer in Arb. zool. Inst. Innsbruck, 1923, 1 (5). [Taf.II, Figs.2, 3]. Female: 2, genital segment with spermatophore (lateral; 3, idem (ventral). DK = chitinous cap ( Gruber's cap); Tr = funnel.
|
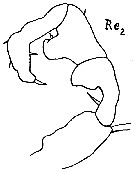 issued from : A. Steuer in Sber. Akad. Wiss. Wien, mat.-nat. K1, 138, Abt.1, 1929. [p.501, Fig.2]. Male (from Naples, Mediterranean Sea]: 2, right P5. Re2 = exopodite 2.
|
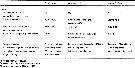 issued from : L. Seuront in J. Plankton Res., 2005, 27 (12). [p.1303, Table I]. Comparisons of distinctive characters of Acartia species closely related to each other.
|
 Issued from : W. Giesbrecht in Systematik und Faunistik der Pelagischen Copepoden des Golfes von Neapel und der angrenzenden Meeres-Abschnitte. Fauna Flora Golf. Neapel, 1892. Atlas von 54 Tafeln. [Taf.31 , Figs.36, 37 ]. Female: 36, P1 (anterior view); 37, P4 (posterior view).
|
 issued from : J.M. Brylinski in J. Plankton Res., 1984, 6 (6). [Tableau.1, p.964]. Results of the countings of the normal and abnormal animals in samples analyzed to Acartia clausi in diferent regions.
|
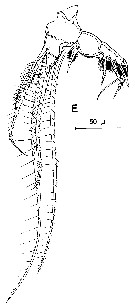
 issued from : R. Huys & G.A. Boxshall in Copepod Evolution. The Ray Society, 1991, 159. [p.65, Fig.2.2.12, A-C]. From The Netherlands: Vlissingen, West Schelde estuary): A, A2; B, margin of allobasis, showing muscle and ligaments connecting proximal setae; C, distal tip of endopod with double seta representing fourth segment (arrowed).
|
 issued from : R. Huys & G.A. Boxshall in Copepod Evolution. The Ray Society, 1991, 159. [p.77, Fig.2.2.24, E]. E, Mxp.
|
 issued from : C. Razouls in Th. Doc. Etat Fac. Sc. Paris VI, 1972, Annexe. [Fig.58]. As Acartia sp. A Female (from Banyuls, G. of Lion): A, P5; B, urosome (dorsal). Nota: After Brylinski (1984) this form is an anomaly from Acartia clausi.
|
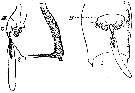
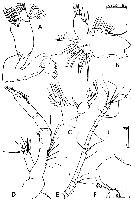 issued from : C. Razouls in Th. Doc. Etat Fac. Sc. Paris VI, 1972, Annexe. [Fig.59]. As Acartia sp. A Female (from Banyuls, G. of Lion): A, Md; B, Mx1; C, Mxp; D, A2; F, labrum.
|
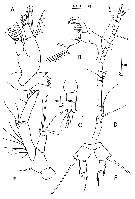 issued from : C. Razouls in Th. Doc. Etat Fac. Sc. Paris VI, 1972, Annexe. [Fig.60]. As Acartia sp. B Female (from Banyuls, G. of Lion): A, Md; B, Mxp; C, urosome; D, A1; E, A2; F, P5. Nota: After Brylinski (1984) this form is an anomaly from Acartia clausi.
|
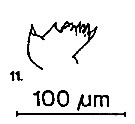 issued from : S.B. Schnack in Crustacean Issue, 1989, 6. [p.143, Fig.6: 11]. 11, Acartia clausi (from off NW Africa, upwelling region): Cutting edge of Md.
|
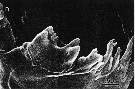 issued from : B.K. Sullivan, C.B. Miller, W.T. Peterson & A.H. Soeldner in Mar. Biol., 1975, 30. [p.179, Fig.4, D]. Acartia clausii (from 44°40'N, 124°10'W) female: D, SEM of right Md (posterior surface).
|
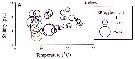
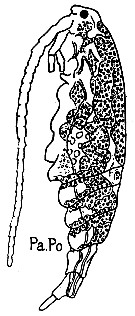 issued from : G. Trégouboff & M. Rose in Manuel de planctonologie méditerranéenne, 1957, CNRS, Paris. [Pl. 125]. Acartia clausi (from Mediterranean Sea). Paradinium poucheti (Pa.Po) in the copepod's coelome.
|
 issued from : A. Ianora, B. Scotto di Carlo, M.G. Mazzocchi & P. Mascellaro in J. Plankton Res., 1990, 12 (2). [p.253, Fig.4, C]. Acartia clausi female (from Gulf of Naples, Italy) parasitized by the dinoflagellate Blastodinium, with infection rates of 1 % or less throughout the year.
|
 Issued from : J.M. Bradford-Grieve in ICES Identification Leaflets for Plankton N°181, 1999 [p.7, Figs.1 a-g]. As Acartia (Acartiura) clausii. Female: 1a, habitus (dorsal); 1b, same (lateral); 1c, genital double-somite; 1d, same (lateral); 1e, P5. Nota: Posterior prosome bordered with 2-4 strong spines dorsally and some stiff hairs ventrally. Right caudal ramus length:width 1.83-2.08. Genital double-somite and urosomite 2 bordered posterodorsally with conspicuous spines. Genital double-somite length:width 1.10-1.20 in dorsal view widest part is on anterior 1/3 of somite, and genital swelling centrally placed in lateral view. A1 slightly shorter than prosome, segment 5 with a distinct denticle anteriorly. P5 terminal spine thick. Male: 1f, P5 (L = left leg; R = right leg); 1g, last thoracic segment and urosome (lateral). Nota: Posterior prosome bordered by dorsal spines and ventral stiff hairs. Genital somite bordered by posterodorsal hairs. Urosomites 2-4 bordered by posterodorsal small spines; and urosomite 2 with small spinules laterally. Right caudal ramus length:width 1.02)1.24. Basis of left P5 with 2 rows of small spines, 1 row on inner edge ridge, other on posterior surface; exopodal segment 1 with some anterior surface spinules and inner edge hairs; exopodal segments 2+3 shorter than exopodal segment 1 with a slightly convex distal border and length of posterior spine just less than half that of its segment and longer than anterior spine inserted distal to anterior spine. Right exopodal segment 1inner distal lobe with proximal border at right angles to rest of segment, exopodal segment 2 inner lobe with 1 distal and 1 proximal spinule and distoposterior knob.
|
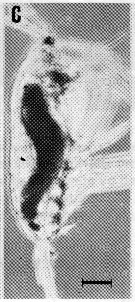
 Issued from : E. Chatton in Arch. Zool. Exp. & Gen., 1920, 59, [Pl. IV, 42]. Acartia clausi female (from Banyuls), with the general cavity is envaded by the plasmode of Paradinium poucheti (Dinoflagellate). t.D.: gut; Par.P.: Paradinium poucheti.
|
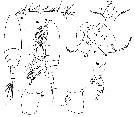
 Issued from : E. Chatton in Arch. Zool. Exp. & Gen., 1920, 59, [p.286, Fig.133 bis & ter]. Acartia clausi female (from Banyuls) parasited by Ichthyosporidium sp. (Dinoflagellate). A: young plasmode located against the stomacal wall, oesophagus omitted. B: bouquet of tubes short and branched out in contact of gut.
|
 Issued from : E. Chatton & M.O. Soyer in Annals Sci. nat., Zool., Paris, 1973, 15 (1). [p.37, courbe 1]. Comparative curve showing the number of cystes (sporosheres) from Paradinium poucheti sent out by Acartia clausi function of time in three types of experimental conditions.
|
 Issued from : N.H. Marcus in Mar. Biol., 1990, 105. [p.415, Fig.2, b]. Egg of Acaertia clausi from sediment (coast of northern California, in February-April 1989). Egg diameter (µm); 71.2 ± 3.0 (N = 15) (sediments, February); 72.7 ± 2.6 (sediments, April). . Egg sueface smooth.
|
 Issued from : M.G. Mazzocchi in Guida al Riconoscimento del plancton dei Mari Italiani, Vol. II, 2006. [p.83, Tav. 75]. After A. Comaschi. Female: a-b, habitus (dorsal and lateral, respectively); c, genital segment (dorsal); d, same with spermatheca (lateral); e, P5. Male: f, habitus (dorsal); g, right A1 with geniculation; h, urosome (lateral); i, P5; L, exopodal segment 1 of left P5 (posterior view); m-n, distal segment of left P5 (various views).
|
 Issued from : M.S. Kos in Field guide for plankton. Zool Institute USSR Acad., Vol. II, 1976. After Brodsky, 1950. Female: 1, habitus (dorsal); 2, P5. Male: 3, habitus (dorsal); 4, P5.
| | | | | Compl. Ref.: | | | Gadeau de Kerville, 1894 (p.81); Mrazek, 1902 (p.510); I.C. Thompson, 1903 a (p.30); Thompson & Scott, 1903 (p.236, 254); Pearson, 1906 (p.30); Sars, 1909 b (p.18); Esterly, 1917 (p.393, light-dark reactions); 1919 (p.1, 16, light-dark reactions); Chatton, 1920 (p.17, parasited); Rose, 1925 (p.152); Gurney, 1927 (p.155); Wilson, 1932 (p.19); W.H. Johnson, 1933 (p.1, vertical distribution vs. light); Wilson, 1942 a (p.169); Massuti Alzamora, 1942 (p.98, Rem.); Lysholm & al., 1945 (p.42); Sewell, 1948 (p.345, 388: chart, 441, 461, 486, 482, 487, 514); C.B. Wilson, 1950 (p.151); Fleury, 1950 (p.47, fig.2); Gauld & Raymont, 1953 (p.447, Table I, IV, fig.1, respiration); Gundersen, 1953 (p.1, 24, Table 20, seasonal abundance); Østvedt, 1955 (p.15: Table 3, p.77); Duran, 1955 (p.52); Conover, 1956 (p.156, biology); Deevey, 1956 (p.126, 127, tab.IV); Beldescu & al., 1956 (p.63, Table, Size-weight), Gauld, 1957 (p.510, copulation); (?) Kott, 1957 (p.6); 1960 (p.31, tab.II); Conover, 1959 (p.259, Table 1, 2, respiration); 1960 (p.399, Table I, respiratory rate); Deevey, 1960 (p.5, Table II, fig.7: annual abundance, Rem.: p.31, fig.18, 19), ? M.W. Johnson, 1961 (p.311, Table 2); Bowman, 1961 (p.206, Rem.); Wickstead, 1962 (p.546, food & feeding); Marshall Orr, 1962 (tab.1, 3); Gaudy, 1962 (p.93, 99, Rem.: p.115, Tableau 10: development, p.150: biological annual cycle); McLaren, 1963 (p.685, fig.4, growth vs. temperature); Giron-Reguer, 1963 (p.55); Shmeleva, 1963 (p.141); Duran, 1963 (p.24); Björnberg, 1963 (p.66, Rem.); Bary, 1963 a (p.1519, Table 1); ? Northcote & al., 1964 (p.1069, Table II); Anraku, 1964 b (p.195, respiration-grazing vs. temperature); Rice, 1964 (p.163, hydrostatic pressure effects); Bary, 1964 (p.183, T-diagram-occurrences); Greze & Baldina, 1964 (p.249, population dynamic & production); Dimov, 1964 b (p.33, Tableau 1); Bodo & al., 1965 (p.219, annual cycle); Carter, 1965 (Rem.: p.351); Lance, 1965 (p.155, Table 2: osmotic pressure); Martin, 1965 (p.185, 188: Table 1); Deevey, 1966 (p.155, Table 3, lengths variation), Marshall & Orr, 1966 (p.513, 521, fig.I, 2, Table 1, 2, 3, 4, 6 ''as A. longiremis'', 7, feeding, respiration); Faber, 1966 a (p.419, 420); Mazza, 1966 (p.72); 1967 (p.364, 377); Matthews, 1967 (p.159, Table 1, Rem.); Fleminger, 1967 a (tabl.1); Subbaraju, 1967 (p.18, developmental time vs latitude); Harder, 1968 (p156, Table 1, behaviour vs. density discontinuity); Vinogradov, 1968 (1970) (p.64, 106, 111); Corkett, 1968 (p.77, rearing); Greze & al., 1968 (p.1066, annual variation); in Oceanology, 1968 p.839, P/B quotient); Porumb, 1968 (p.417); 1968 a (p.510); Dimov, 1968 (p.506); Séguin, 1968 (p.488); Corner & Cowey, 1968 (p.393, Table 7, respiration rate); Zaika, 1968 (p.311, P/B quotient); Kovalev, 1968 a (p.441, fig.1); 1969 a (p.177); 1970 a (p.87, Tableau 1, 2, comparison hyponeustonic & planctonic forms); Mullin, 1969 (p.308, Table I: estimates of production); Champalbert, 1969 a (p.608); Singarajah, 1969 (p.171, Table II, behaviour); Corkett & McLaren, 1970 (p.161, development rate egg-CI); El-Maghraby & Dowidar, 1970 (p.81); Dowidar & El-Maghraby, 1970 (p.267); Itoh, 1970 a (p.1, tab.1, 2); Paulmier, 1971 (p.168); Hodgkin & Rippingale, 1971 (p.573, Fig.1, predation); Gamulin, 1971 (p.381, tab.2); Salah, 1971 (p.320); Gaudy, 1971 (p.65, Tabl. 1, fig.1, egg production); 1972 (p.175, 190, figs.7-12, annual cycle); Razouls S., 1972 b (p.2, respiration); Lefèvre-Lehoërff, 1972 (p.1681); Nival & al., 1972 (p.63, respiration); Subbaraju & Krishnamurphy, 1972 (p.25, Table 2, 4: developmental time vs latitude); Valentin, 1972 (p.349, figs.9, 25, 26, 27, 28, egg diameter = 84 µm, egg production); Apostolopoulou, 1972 (p.328, 370); Conover & Francis, 1973 (p.272, Table 3, grazing rate measured by isotope); Björnberg, 1973 (p.353, 384); Arndt & Heidecke, 1973 (p.599, 603); Eriksson, 1973 (p.37, fig.22-25, annual cycle); 1973 b (p.113, 118); Desgouille, 1973 (p.1, 131, Rem.: p.134); Gaudy, 1973 (p.267, Table I, II, fig.3, 5, respiration); Chatton & M.O. Soyer, 1973 (p.27, courbe 1: parasite); Guglielmo, 1973 (p.399); Frolander & al., 1973 (p.277, annual cycles); Champalbert & al., 1973 (p.529, CHN composition); P. Nival & S. Nival, 1973 (p.135, mouth parts, grazing); S. Razouls, 1974 (147, oxygen rate); de Bovée, 1974 (p.109, 124); Nival & al., 1974 (p.231, respiration & excretion); Laval, 1974 (p.57, Rem.: p.78, avoidance); Vives al., 1975 (p.53, tab.II, III, IV); Person-Le Ruyet, 1975 (p.203, rearing); ? Kasahara & al., 1975 (p.25, eggs, cycles); Landry, 1975 (p.43, egg hatching); 1975 a (p.434, egg development rates vs. temperazture); 1975 b (p.854, stage development times vs. temperature); Peterson & Miller, 1975 (p.642, 650, Table 3, interannual abundance); Porumb, 1976 (p.91); Uye & Fleminger, 1976 (p.253, resting egg, hatching); Mayzaud, 1976 (p.47, respiration/nitrogen excretion); Kukina, 1976 (p.355, feeding); Furuhashi, 1976 (p.355, Diel vertical migration); Gaudy, 1976 (p.77, fig.1, 4, Table I, II, III, production); Peterson & Miller, 1976 (p.14, Table 1, 2, 3, abundance vs interannual variations); Hecq, 1976 (p.443, abundance annual cycle); Eriksson, 1976 (p.155, annual cycle-temperature occurrences); Hirota & Uno, 1977 (p.77, fig. egg); Hargis, 1977 (p.942 filtration rates: comparison of techniques); Falconetti & Seguin, 1977 (p.188); Gibson & Grice, 1977 (p.85, Table 1, copper pollution); Richman & al., 1977 (p.69, grazing); Sameoto, 1977 (p.1, fig.14, abundance); Peterson & Miller, 1977 (p.717, Table 1, seasonal occurrence); Gaudy, 1977 a (p.179, respiration vs temperature); Iwasaki & al., 1977 (p.55, nutrition, temperature, egg production Landry, 1978 (p.77, population dynamics & production); Conover, 1978 (p.66, 69, feeding); Comaschi Scaramuzza, 1978 (part., p.16: Rem.); Poulet, 1978 (p.1126, grazing); Honjo & Roman, 1978 (p.45, fecal pellets); Mayzaud & Poulet, 1978 (p.1144, feeding); Poulet & Marsot, 1978 (p.1403, chemosensory-grazing); McLaren, 1978 (p.1330, 1337: life history); Durbin & Durbin, 1978 (p.958, Length-weight, formalin effect/preservation); Alcaraz & Wagensberg, 1978 (p.155, sex-ratio, fecundity); Tomasini & Mazza, 1978 (p.154, feeding); Fernandez, 1978 (p.97, metabolism/food, Rem.: Table 19); Garrod & Colebrook, 1978 (p.128, fig.113 annual variation); Lefèvre-Lehoërff & Quintin, 1979 (p.71, length-temperature); Peterson & al., 1979 (p.467, Table 1, fig.8); Longhurst & Williams, 1979 (p.1, Table IVb, V, vertical distribution); Lee & McAlice, 1979 (p.228, annual cycle); Karanas & al., 1979 (p.1104, UV-B effects); Donaghay & Small, 1979 (p.137, feeding preferences); Pipe & Coombs, 1980 (p.223, figs. 1, 2, 4, table 1, vertical distribution); Vaissière & Séguin, 1980 (p.23, tab.2); Samain & al., 1980 (p.225, polluant effects); Rosenberg, 1980 (p.738, feeding); Svetlichnyi, 1980 (p.28, Table 1, passive submersion); Porumb, 1980 (p.167); Miller & al., 1980 (p.361, Rem.); Poulet & Marsot, 1980 (p.198, Fig.2, 6, 7, 8, Table 3, 5, feeding); Donaghay (1980 (p.234, feeding); Grice & Marcus, 1981 (p.125, Dormant eggs, Rem.: p.132, 135, 136); Gallo, 1981 (p.847); Uye, 1981 (p.255, fecundity); Yassen, 1981 (p.125, rearing, mortality rate); Vives, 1982 (p.295); Kovalev & Shmeleva, 1982 (p.85); Citarella, 1982 (p.791, 798: listing, frequency, fig.5, Tableau II, V); Castel & Courties, 1982 (p./417, Table II, fig.4, spatial & monthly distribution); Yassen, 1982 (p.125, culture: mortality rate); Mackas & Sefton, 1982 (p.1173, Table 1); Klein Breteler & Gonzalez, 1982 (p.157, body length/food); Klein Breteler & al., 1982 (p.195, growth & development); Myers & Runge, 1983 (p.189, life-history, mortality rates); Uye, 1982 (p.55, dynamic, production); Landry, 1983 (p.614, development times vs stages); Jacoby & Youngbluth, 1983 (p.84, Table 4, Rem: mating); Saint-Jean & Pagano, 1983 (p.145, egg production); Pagano & Saint-Jean, 1983 (p.151, development); Rivière, 1983 (p.19, enzymes); Rivière & Kerambrun, 1983 (p.25, enzymes); Pasternak & Kopylov, 1983 (p.240, parasitism); Huntley & al., 1983 (p.143, Table 2); Ueda & al., 1983 (p.165, Table 1, 2, 4, swarms); Saint-Jean & Pagano, 1984 (egg production); Patriti & al., 1984 (tab.1); Mayzaud O. & al., 1984 (p.15, feeding/enzyme); Baars & Fransz, 1984 (p.120, Table 1, grazing); Fransz & al., 1984 (p.86); Brylinski, 1984 a (p.91, length/temperature); Tsuda & Nemoto, 1984 (p.79, feeding); Scotto di Carlo & al., 1984 (1045); d'Elbée, 1984 (p.24, Fig.3); Peterson, 1985 (p.726, fig.2, abundance); Mullin & al., 1985 (p.151, Appendix: as ''Acartia'', vertical structure v.s. storm & larval fish effects); Musayeva, 1985 (tab.1); Regner, 1985 (p.11, Rem.: p.38); Moraitou-Apostolopoulou, 1985 (p.303, occurrence/abundance in E Mediterranean Sea); Jansa, 1985 (p.108, Tabl.I, II, III, IV, V); Gruzov, 1985 (p.633, age dependant feeding); Nagasawa & al., 1985 (p.61, bacterial colonization); Gaudy, 1985 (p.279, Tab.3); Pagano & Saint-Jean, 1985 (p.83, feeding); Colebrook, 1985 (p.261, fig.2); Garcia-Rodriguez, 1985 (p.37, fig.4); 1985 a (p.41, 42); Williams & Collins, 1985 (p.27); Nagasawa & Nemoto, 1985 (p.81); Brenning, 1985 a (p.28, Table 2); Légier-Visser & al., 1986 (p.529, mechanoreception); Mackas & Anderson, 1986 (p.115, Table 2); Yamamoto & Nishizawa, 1986 (p.1729, horizontal distribution); Ambler, 1986 a (p.957, Table III, selectivity ); Brylinski, 1986 (p.457, spatial variations); Ueda, 1986 (p.124, 131, Rem.); 1987 (p.691: Rem.); Moraitou- Apostolopoulou & al., 1986 (p.464); Robinson & Hunt, 1986 (p.791, Table 1, 2, fig.2); Robinson & al., 1986 (p.201, seasonal distribution); Kerambrun, 1987 (p.115, elementary chemical composition); Ceccherelli & al., 1987 (p.571, fig.5); Ibanez & Boucher, 1987 (p.205, Tableau, fig.6, hydrological fronts); Boucher & al., 1987 (p.133, spatial distribution/physical structure); Brenning, 1987 (p.31, spatial distribution, T-S diagram, Rem.); Ayukai, 1987 (p.579, figg. 1, 2, 3, , Table 1, 2, 3, 4, 5, 6, 7: Ingestion vs ESD); Comaschi Scaramuzza, 1987 (tab.1); Diouf & Diallo, 1987 (p.260); Quisthoudt & al., 1987 (p.995, spatial distribution); Huntley, 1988 (p.83, Table 1, feeding history); Lozano Soldevilla & al., 1988 (p.60); Tiselius, 1988 (p.215, grazing); Gorsky & al., 1988 (p.133, Table I, C-N composition); Williams D. & al., 1988 (p.580); Daan & al., 1988 (p.45, Table 4, carnivorous behaviour); Brylinski & al., 1988 (p.503, size/spatial distribution); Ianora & Scotto di Carlo, 1988 (p.247, egg production); Hay & al., 1988 (p.431, enclosed population dynamic); Hernandez-Trujillo, 1989 a (tab.1); Giguère & al., 1989 (p.522, Table 1, formaldehyde preservation); Tiselius, 1989 (p.49, feeding); Cervantes-Duarte & Hernandez-Trujillo, 1989 (tab.3); Wiadnyana & Rassoulzadegan, 1989 (p.37, feeding); Citarella, 1989 (p.123, abundance); Poulet & al., 1989 (p.1325, fig.3, Table 2, vitamin content); Ianora & al., 1990 (p.249, fig., parsitism effects); Coyle & al., 1990 (p.763); Krsinic, 1990 (p.337, Table I-II, vertical distribution, comparison bottme-net); Tiselius & Jonsson, 1990 (p.23, table 1-4, feeding behaviour); Stoecker & McDowell Capuzzo, 1990 (p.891, feeding); Rodriguez & Jiménez, 1990 (p.497); Marcus, 1990 (p.414: tab.1, 2, fig.2: egg); Ianora & Buttino, 1990 (p.473, seasonal cycles & egg production); Klein Breteler & al., 1990 (p.177, Table IV: generation vs body length); Naess, 1991 (p.261, Rem.); 1991 a (p.455); 1991 b (p.29, rotenone effect); Gifford, 1991 (p.8, Table 2, diet); Fransz & al., 1991 (p.10); Hernandez-Trujillo, 1991 (1993) (tab.I); Shih & Marhue, 1991 (tab. 3); Alcaraz & Saiz, 1991 (p.137, Table II, turbulence effects); Jouffre & al., 1991 (p.489, lagoon); Tiselius & al., 1991 (p.445, egg production); Hay & al., 1991 (p.1453, Table 2, 5); Roche-Mayzaud & al., 1991 (p.25, feeding, enzyme activity); Saiz & Alcaraz, 1992 (p.229, tab.1, behaviour); Mayzaud & al., 1992 (p.197, enzyme activity/food concentration); Huntley & Lopez, 1992 (p.201, Table 1, A1, eggs, egg-adult weight, temperature-dependent production); Bautista & Harris, 1992 (p.41, ingestion rate, gut contents); Séguin & al., 1993 (p.23, Table 2: abundance, %); ); Kouwenberg, 1993 a (p.281, fig.3, 4, sex ratio); Fromentin & al., 1993 (p.285, Ligurian transect abundance); Christou & Verriopoulos, 1993 (p.643, biological annual cycle); Guerin-Ancey & David, 1993 (p.119, table 1, biovolume, vertical distribution); Lakkis, 1994 (p.481); Vinogradov & al., 1994 (tab.1); Kouwenberg, 1994 (tab.1); Mayzaud & al., 1994 (p.195, enzyme activity/meteorologic events); Sautour, 1994 (p.113, grazing); Klein Breteler & al., 1994 (p.1039, Table I, fig. 2, 6, 7, duration life stages); Shih & Young, 1995 (p.66); Palomares Garcia & Vera, 1995 (tab.1); Lefèvre-Lehoërff & al., 1995 (p.269, annual hydroclimatic variations); Krause & al., 1995 (p.81, Rem.: p.138); Hajderi, 1995 (p.542); Fernandez de Puelles & al., 1996 (p.97, occurrence: p.101); Zauke & al., 1996 (p.141, Table 7, metal bioaccumulation); Marcus, 1996 (p.143); Hays & al., 1996 (p.159, Rem.: Herring correlation); part. Madhupratap & al., 1996 (p.77, Table 2: resting eggs); Park & Choi, 1997 (Appendix); Guerrero & Rodriguez, 1997 (p.584, production Paracalanus spp.); Gismervik & Andersen, 1997 (p.247, feeding, model description); Ban & al., 1997 (p.287, Table 1, 2: feeding vs. reproduction); Ban S, Burns C. & al., 1997 (p.287, Table1, 2, feeding, reproduction); Tiselius & Jonsson, 1997 (p.164, predation); Mauchline, 1998 (tab.8, 16, 17, 19, 21, 24, 33, 35, 36, 40, 45, 46, 47, 48, 51, 53, 54, 56, 58, 61, 62, 63, 64, 65); Hure & Krsinic, 1998 (p.74, 103); Mayzaud & al., 1998 (p.483, feeding, acclimatation); Suarez-Morales & Gasca, 1998 a. (p107); Bragina, 1999 (p.196); Seridji & Hafferssas, 2000 (tab.1); Siokou-Frangou, 1999 (p.478); Harvey & al., 1999 (p.1, 49: Appendix 5, in ballast water vessel); Miralto & al., 1999 (p.173, Rem.: p.174, egg production vs diatoms effect of inhibition); Fernandez-Alamo & al., 2000 (p.1139, Appendix); Moraitou-Apostolopoulou & al., 2000 (tab.I); Gaudy & al., 2000 (p.51, metabolism, temperature & salinity effects); Selifonova, 2000 (p.68, tab.1); Sautour & al., 2000 (p.531, Table II, abundance); Musaeva & Gagarin, 2000 (p.534, tab.1); Plounevez & Champalbert, 2000 (p.175, Table III, IV, V, abundance vs fish); El-Sherif & Aboul Ezz, 2000 (p.61, Table 3: occurrence); d'Elbée, 2001 (tabl.1); Holmes, 2001 (p.33, Rem.); Fransz & Gonzalez, 2001 (p.255, tab.1); Calbet & al., 2001 (p.319, Fig.7); Belmonte & Potenza, 2001 (p.173); Cotonnec & al., 2001 (p.693, Table III, IV, food selectivity); Halsband & Hirche, 2001 (p.219, annual reproduction cycle); Bressan & Moro, 2002 (tab.2); Sameoto & al., 2002 (p.11); Hernandez-Trujillo Suarez-Morales, 2002 (p.748, tab.1); Zerouali & Melhaoui, 2002 (p.91, Tableau I, figs.5, 10); Morgado & al., 2003 (p.S205, abundance vs ebbs and floods in estuary); Fernandez de Puelles & al., 2003 (p.123, fig.5); Vieira & al., 2003 (p.S163, Table 2, abundance); Vukanic, 2003 (p.139, tab.1); Kovalev, 2003 (p.47); Zagorodnyaya & al., 2003 (p.52); Gubanova, 2003 (p.94, 100); Bode & al., 2003 (p.85, Table 1, abundance); Pagano & al., 2003 (p.433, feeding); Daly Yahia & al., 2004 (p.366, fig.4, tab.1); Park, W & al., 2004 (p.464, tab.1); Fernandez de Puelles & al., 2004 (p.654, fig.7); Katechakis & al., 2004 (p.589, feeding selectivity & food niche); Shushkina & al., 2004 (p.524, tab.2); Gislason & Astthorsson, 2004 (p.472, tab.1); Fernandez & al., 2004 (p.501, tab.5); Vallet & Dauvin, 2004 (p.539,tab.2); Guermazi & al., 2005 (p.280); Vaglio & al., 2005 (p.163); Lakkis & al., 2005 (p.152); Gubanova, 2005 (p.146: small form); Smeleva & Selifonova, 2005 (p.57); Uriarte & Villate, 2005 (p.863, tab.I); Uriarte & al., 2005 (p.105, fecundity, hatching vs enviromental conditions); Queiroga & al., 2005 (p.195, table 1); Miller C.B., 2005 (p.154, figs.7.18, 7.19, 7.20, 7.21, 7.22; length vs temperature, weight vs length, development vs. temperature, production, productivity); Frangoulis & al., 2005 (p.254, Table I: C/N/P fecal pellet composition); Zuo & al., 2006 (p.163: tab.1); Isari & al., 2006 (p.241, tab.II); Rawlinson & al., 2005 (p.205, tidal exchange); Knotz & al., 2006 (p.406, enzymology); Azeiteiro & al., 2005 (p.7, fig.2, table 2, dynamic, production); S.C. Marques & al., 2006 (p.297, tab.III); Lavaniegos & Jiménez-Pérez, 2006 (tab.2, Rem); Mageed, 2006 (p.171, Table 4); Camatti & al., 2006 (p.46, fig.5); De Olazabal & al., 2006 (p.966); Sei & al., 2006 (p.121, feeding, eggs viabiliity vs oxygenation); Rajkumar & Kuramaguru vasagam, 2006 (p.649, biochimical composition); Zervoudaki & al., 2006 (p.149, Table I); Lopez-Ibarra & Palomares-Garcia, 2006 (p.63, Tabl. 1, seasonal abundance vs El-Niño, Rem.: p.67, 69, 70, 71, 72, 74); Ware & McQueen, 2006 (p.28, Table B1, weight ranges); Selifonova, 2006 (p.117); Varela & al., 2006 (p.272, Table 3, oil spill effects); Leandro & al., 2006 (p.189, development, growth vs temperature); S.C. Marques & al., 2007 (p.213, Table 1, fig.6); Fernandez de Puelles & al., 2007 (p.338, fig.7); Zakaria, 2007 (p.238, Table 2, spatial distribution); Zakaria & al., 2007 (p.52, Table 1, vs Salinity); David & al., 2007 (p.59: tab.2); Wesche & al., 2007 (p.1309); Valdés & al., 2007 (p.104: tab.1); Eisfeld & Niehoff, 2007 (p.193, reproduction); Busatto, 2007 (p.26, Tab.3); Barreiro & al., 2007 (p.279, Rem.: toxic phytoplankton versus copepod grazer); Ferrari & Dahms, 2007 (p.63, 64, 65, Rem.); Youn & Choi, 2007 (p.222: Table1, egg production); Khelifi-Touhami & al., 2007 (p.327, Table 1); Marques S.C. & al., 2007 (p.725, Table 1, fig.4, climate variability); Isinibilir & al., 2008 (p.745: Tab.1); Cabal & al., 2008 (289, Table 1) ; Humphrey, 2008 (p.83: Appendix A); Morales-Ramirez & Suarez-Morales, 2008 (p.517); Selifonova & al., 2008 (p.305, Tabl. 2); Shmeleva & al., 2008 (p.31, Table 1); Gugliandolo & al., 2008 (p.580, bacteria assiociated); Calliari & al., 2008 (p.18, salinity effects); Molinero & al., 2008 (p.271, fig.4); Hubareva & al., 2008 (p.131, Table 1, 3); Rossi, 2008 (p.90: Tabeau XII); Jansen S., 2008 (p.251, grazing); Dvoretsky & Dvoretsky, 2009 a (p.11, Table 2, abundance); DFO, 2009 (p.1, fig. 13, seasonal variability); Brylinski, 2009 (p.253: Tab.1, p.256: Rem.); Primo & al., 2009 (p.341, Table1, interannual variations); Labat & al., 2009 (p.1747, Table 2); Calliari & Tiselius, 2009 (p.111); Aravena & al., 2009 (p.621, seasonal & spatial distribution vs. environmental factors); Brugnano & al., 2010 (p.312, Table 2, 3); Hafferssas & Seridji, 2010 (p.353, Table 2: as clause); Fileman & al., 2010 (p.709, Rem.: feeding); Isinibilir, 2010 (p.233, abundance %); Magnusson & Tiselius, 2010 (p.374, toxicity); Eloire & al., 2010 (p.657, Table II, temporal variability); Lidvanov & al., 2010 (p.356, Table 3); Drira & al., 2010 (p.145, Tabl.2); Hernandez-Trujillo & al., 2010 (p.913, Table 2); Mazzocchi & Di Capua, 2010 (p.423); Sun & al., 2010 (p.1006, Table 2: Yellow Sea); Dvoretsky & Dvoretsky, 2010 (p.991, Table 2); Hirst & al., 2010 (p.2193, sex ratio); Hafferssas & al., 2010 (p.1281, Table III, abundance vs spatial distribution); Ianora & Miralto, 2010 (p.493, Table I: reproductive responses vs diatom diets); Nowaczyk & al., 2011 (p.2159, Table 2); Maiphae & Sa-ardrit, 2011 (p.641, Table 2); Fileman & al., 2011 (p.403, abundance vs bloom condition); S.C. Marques & al., 2011 (p.59, Table 1, seasonal variability); Mazzocchi & al., 2011 (p.1163, Table I, II, fig.6, long-term time-series 1984-2006); Isari & al., 2011 (p.51, Table 2, 5, fig.5, abundance vs distribution); Zervoudaki & al., 2011 (p.45, fig.3, 5, Table 3, abundance: Turkish Straits); Van Ginderdeuren & al., 2012 (p.3, Table 1); Delpy & al., 2012 (p.1921, Table 2); Boyer & al., 2012 (p.1, fig.2a); Uysal & Shmeleva, 2012 (p.909, Table I); DiBacco & al., 2012 (p.483, Table S1, ballast water transport); Salah S. & al., 2012 (p.155, Tableau 1, fig.5: spatio-temporal distribution); Zizah & al., 2012 ( p.79, Table I, Rem.: p.89); Sigurdardottir, 2012 (p.1, Table 2.3); Vidjak & al., 2012 (p.243, Rem.: p.253); Miloslavic & al., 2012 (p.165, Table 2, transect distribution); Stefanova & al., 2012 (p.403, Table 2, interannual abundance); Aubry & al., 2012 (p.125, table 1, fig. 6, 8 a, b, interannual variation); Annabi-Trabelsi & al., 2012 (p.445, egg production vs environmental conditions); Jean & al., 2012 (p.12, Table 3, protein vs environmental metal stress); McGinty & al., 2012 (p.122, time series abundance); Krsinic & Grbec, 2012 (p.57, 61: abundance); Gonçalves & al., 2012 a (p.16, abundance, diel vertical behavior); Boyer & al., 2012 (p.2, fig.2, abundance & annual change); Bode & al., 2012 (p.108, spatial distribution vs time-series, % biomass); Gonçalves & al., 2012 (p.321, abundance vs climatic variability); Mazzocchi & al., 2012 (p.135, annual abundance 1984-2006); Nikolioudakis & al., 2012 (p.173, Table 2: Ivelv's selectivity index); Lavaniegos & al., 2012 (p. 11, Table 1, fig.3, seasonal abundance, Appendix); Rekik & al., 2012 (p.336, Table 1, abundance); Gusmao & al., 2013 (p.279, Table 3, fig.2, sex-specific predation by fish); Belmonte & al., 2013 (p.222, Table 2, abundance vs stations); in CalCOFI regional list (MDO, Nov. 2013; M. Ohman, pers. comm.); Sobrinho-Gonçalves & al., 2013 (p.713, Table 2, fig.8, seasonal abundance vs environmental conditions); Cole & al., 2013 (p.6646, microplastic ingestion); Peijnenburg & Goetze, 2013 (p.2765, genetic data); Terbiyik Kurt & Polat, 2013 (p.1163, Table 2, seasonal distribution); Lindeque & al., 2013 (p.737, molecular identification); Boyer & al., 2013 (p.125, egg production vs environmental parameters); Lidvanov & al., 2013 (p.290, Table 2, % composition); Barton & al., 2013 (p.522, Table 1: metabolism, diapause, population dynamic, feeding mode, biogeo); Siokou & al., 2013 (p.1313, fig.4, 8, biomass, vertical distribution); Fernandez de Puelles & al., 2014 (p.82, Table 3, seasonal abundance); Pansera & al., 2014 (p.221, Table 2, abundance); Mazzocchi & al., 2014 (p.64, Table 4, abundance) ; Zaafa & al., 2014 (p.67, Table I, occurrence): Zakaria, 2014 (p.3, Table 1, abundance vs 1960-2000); Rojas-Herrera & al., 2016 (p.40, Table 2: temporal abundance, Table 3: diversity index); Uriarte & al., 2016 (p.718, fig.5: abundance vs years 1998-2011); Zakaria & al., 2016 (p.1, Table 1); Benedetti & al., 2016 (p.159, Table I, fig.1, functional characters); Svetlichny & al., 2016 (p.77, fig.8: respiration rate, Rem.); Ben Ltaief & al., 2017 (p.1, Table III, Summer relative abundance); El Arraj & al., 2017 (p.272, table 1, 2, spatial distribution); Benedetti & al., 2018 (p.1, Fig.2: ecological functional group) ; Record & al., 2018 (p.2238, Table 1: diapause); Abo-Taleb & Gharib, 2018 (p.139, Table 5, p.146, occurrence %); Belmonte, 2018 (p.273, Table I: Italian zones); Chaouadi & Hafferssas, 2018 (p.913, Table II: occurrence); Hure M. & al., 2018 (p.1, Rem.: p.11); Palomares-Garcia & al., 2018 (p.178, Table 1: occurrence); Yebra & al., 2019 (p.1, Table 4: length, width: juv; F,M); Camatti & al., 2019 (p.1, fig. 3, 5, 6, 7, 8, 9, 10, Tale 1, 3, 4, 5); Richirt & al., 2019 (p.3, Table 1, fig.2, 3, 4, 5, abundance changes vs years 1998-2014, table 2: diversity index); Acha & al., 2020 (p.1, Table 3: occurrence % vs ecoregions). | | | | NZ: | 16 + 3 doubtful | | |
|
Distribution map of Acartia (Acartiura) clausi by geographical zones
|
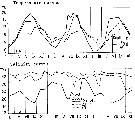
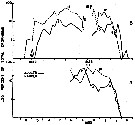
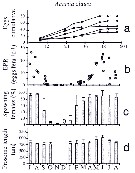
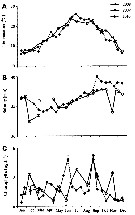
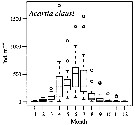
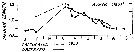
| | | | | | | | | | | | | | |  issued from : P.S.B. Digby in J. Mar. Biol. Ass. U.K., 1950, 29. [p.403, Fig.6]. issued from : P.S.B. Digby in J. Mar. Biol. Ass. U.K., 1950, 29. [p.403, Fig.6].
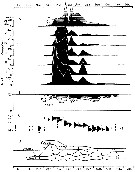
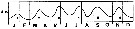
Life history of Acartia clausi at station L (5 miles from Plymouth, English Channel).
A: abundance of copepodite stages; B: percentage distribution of stages; C: size-groups of adult females; D: suggested interpretation of generations (or cohorts) succession during the year (1947).
Correlate the size variations with the water temperature at station L4 (p.397, Fig.1).
The author deduces the succession of 5 generations. |
 issued from : P.S.B. Digby in J. Mar. Biol. Ass. U.K., 1950, 29. [p.397, Fig.1]. issued from : P.S.B. Digby in J. Mar. Biol. Ass. U.K., 1950, 29. [p.397, Fig.1].
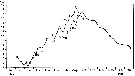
Temperature of the water at 1 and 30 m depth at station L4 (5 miles from Plymouth, English Channel) during 1947. |
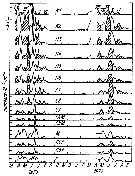
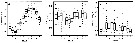
 issued from : R. Gaudy in Rec. Trav. St. Mar. End., 1962, 27 (42). [p.140, Fig.3]. issued from : R. Gaudy in Rec. Trav. St. Mar. End., 1962, 27 (42). [p.140, Fig.3].
Population dynamics of Acartia clausi in the Gulf of Marseille (43°15'30''N, 5°17'02''E) during 1960-1961.
A: Frequenciy distributions of size classes (cephalothoracic lengths females from 1 to 6); B: Number of adults (males and females) and nauplii by haul; C: Percentage of the different stages (N: naulii, 1-5: copepodites, 6: adults); D: Interpretation of successive generations.
Class of sizes (in mm): 1 = 0.700-0.799; 2 = 0.800-0.849; 3: 0.850-0.899; 4 = 0.900-0.949; 5: 0.950-0.999; 6 = 1.000-1.049;
Gaudy (p.138) points to 6 generations by year in the Gulf of Marseille (NW Mediterranean Sea). |
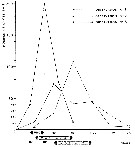
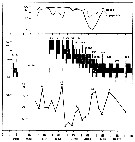
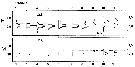 issued from : J.-M; Brylinski, D. Bentley & C. Quishoudt in J. Plankton Res., 1988, 10 (3). [p.507, Fig.4]. Lenth prosome histogramm (in mm) of Acartia clausi females (F) and males (M) in relation to the transect from Boulogne-sur-Mer to Dover, through the Dover Strait (stations 1 to 13). issued from : J.-M; Brylinski, D. Bentley & C. Quishoudt in J. Plankton Res., 1988, 10 (3). [p.507, Fig.4]. Lenth prosome histogramm (in mm) of Acartia clausi females (F) and males (M) in relation to the transect from Boulogne-sur-Mer to Dover, through the Dover Strait (stations 1 to 13).
The dotted line is arbitrary reference. Each stations equidistant. |
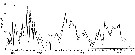 issued from : A. Ianora & I. Buttino in J. Plankton Res., 1990, 123 (3). [p.475, Fig.1, B]. issued from : A. Ianora & I. Buttino in J. Plankton Res., 1990, 123 (3). [p.475, Fig.1, B].
Acartia clausi females from Gulf of Naples: Seasonal fluctuations in egg production rates after 24 h. Mean values obtained by averaging egg data for all females (continuous line), including those that had not laid eggs, and only in cases where egg deposition had occurred (dashed line). |
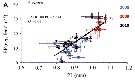
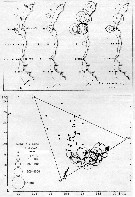 issued from : U. Brenning in Wiss. Z. Wilhelm-Pieck-Univ. Rostock - 36. Jahrgang 1987. Mat.-nat. wiss. Reihe, 2. [p.32, Figs.5, 6]. issued from : U. Brenning in Wiss. Z. Wilhelm-Pieck-Univ. Rostock - 36. Jahrgang 1987. Mat.-nat. wiss. Reihe, 2. [p.32, Figs.5, 6].
Spatial distribution and T-S Diagram for Acartia clausi from 8° S - 26° N; 16°- 20° W, for diferent expeditions (V1: Dec. 1972- Jan. 1973; V2: Feb/Mar. 1973; VI: May 1974; IV: Jun./Jul. 1972).
SO: Southern Surface Water (S °/oo: 34,50; T°C: 29,0); ND: Northern Water of the Surface Layer (S °/oo: 37,5; T°C: 21,0); SD: Southern Deep Water of the surface layer (S °/oo: 35,33; T°C: 13,4). See commentary in Temora stylifera and Brenning (1985 a, p.6). |
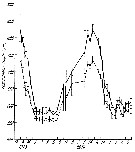
 issued from : R. Gaudy in Tethys, 1972, 4 (1). [p.237, Fig.36]. issued from : R. Gaudy in Tethys, 1972, 4 (1). [p.237, Fig.36].
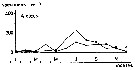
Schematic quantitative abundance of Acartia clausi in the Gulf of Marseille (Mediterranean Sea) established from samples during the period between ending 1960 to ending 1967.
Gaudy (p.198) points to 6 generations per year. The sex ratio is in favor of females ≥ 60-80 %, except in winter |
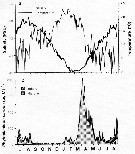
 issued from : S. Eriksson in ZOON, 1976, 4. [p.157, Fig.2]. issued from : S. Eriksson in ZOON, 1976, 4. [p.157, Fig.2].
Seasonal distribution of neritic copepod Acartia clausi off Gothenburg (Göteborg), The Skattegatt. (Monthly means for adult specimens during 1968-1973; point : inshore, depth = 10 m; x: offshore, depth > 40 m.
The congeneric species A. clausi and A. longiremis have a tendency for seasonal separation and different temperature optima. |
 issued from : S. Eriksson in ZOON, 1976, 4. [p.159, Fig.3, f]. issued from : S. Eriksson in ZOON, 1976, 4. [p.159, Fig.3, f].
Temperature occurrence of neritic copepod Acartia clausi off Gothenburg (Göteborg), The Skattegatt.
.Surface salinity of the investigation area varies around 25 p.1000 and the deep water slinity around 34 p.1000. There is a temperature stratification with surface water warmer than 10°C from May to October with maximum of 20°C in August. The coldest period is January to March with surface temperatures of 1-2°C. The deep water ranges between 5 and 10°C.
The hauls were horizontal at 2, 20, and 40 m.
Limits subjectively regarded as the optimum temperature range: 5-20°C. |
 issued from : S. Eriksson in ZOON, 1973, 1. [p.59, Fig.25]. issued from : S. Eriksson in ZOON, 1973, 1. [p.59, Fig.25].
Size distribution of adult females of Calanus helgolandicus (offshore station H6:11°30' N, 57°40'.5 E, The Kattegatt) during 1969-70 in the main series. |
 issued from : S. Eriksson in Mar. Biol., 1974, 26. [p.320, Figs. 2-3] issued from : S. Eriksson in Mar. Biol., 1974, 26. [p.320, Figs. 2-3]
Salinity and temperature curves for main series at offshore station H6 (11°30' N, 57°40'.5 E, The Kattegatt) from March 1968 to November 1970. |
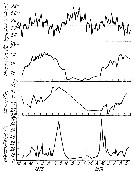
 issued from : I.A. McLaren inJ. Fish. Res. Board Can., 1978, 35. [p.1338, Fig.7]. issued from : I.A. McLaren inJ. Fish. Res. Board Can., 1978, 35. [p.1338, Fig.7].
Life cycles of Acartia clausi in Loch Striven (55°55'N, 05°10'W).
Relative abundance of C V as a percentage of all copepodids (lower panel); size and numbers per haul (including combined hauls from 60 m to 10 m and 10 to 0 m) of adult females (middle panel), and percentage of nauplii and copepodids above 10 m (from split hauls, taken from 60 to 10 m and 10 to 0 m) (upper panel).
Successive generations as infered from peaks in the C V cohorts and size changes designated as Go, G1, etc.
Data from Marshall (1949, tables VIII and XV). |
 Issued from : R.J. Conover in Rapp. P.-v. Réun. Cons. int. Explor. Mer, 1978, 173. [p.69, Fig.54]. Issued from : R.J. Conover in Rapp. P.-v. Réun. Cons. int. Explor. Mer, 1978, 173. [p.69, Fig.54].
Regression between rate of ingestion (I) for Acartia clausi from Bedford Basin, Nova Scotia (Canada) and particle concentration in the same environment. |
 Issued from : R.J. Conover in Bull. Bingham Oceanogr. Coll., 1956, XV. [p.181, Fig.13]. Issued from : R.J. Conover in Bull. Bingham Oceanogr. Coll., 1956, XV. [p.181, Fig.13].
Size distribution of adult females Acartia clausi from Long Island Sound ( U.S.A.) at different times of the year, 1952-1953. |
 Issued from : R.J. Conover in Bull. Bingham Oceanogr. Coll., 1956, XV. [p.176, Fig.11, A, B]. Issued from : R.J. Conover in Bull. Bingham Oceanogr. Coll., 1956, XV. [p.176, Fig.11, A, B].
Seasonal distribution in percent of total organisms of adults and naupliiAcartia clausi from Long Island Sound ( U.S.A.) 1952-1953.
The number of generations was estimated from the distribution of nauplii and adults.
The nauplii of each generation are designated by Roman numerals and the corresponding adults in Arabic.
An estimate of 4 generations a year was obtained using data from 1953 (B) supplemented by the information recorded from 1952.
Nota: Adults noted about December 1, 1952 have been designated 0. Some of the offspring (I) of this primary breeding stock reached maturity in February and were designated 1. The precise designation of adults 1 is complicated by subsidiary peaks in December and January, but a second naupliar peak II was undoubredly produced by these adults.
Adults 2 matured in Aptil of both 1952 and 1953 and probably produced nauplii III, although a gap in the 1953 data makes the exact date of origin of this generation questionable. |
 Issued from : M.R. Landry in Int. Revue ges. Hydrobiol., 1978, 63 (1). [p.89, Fig.5]. Issued from : M.R. Landry in Int. Revue ges. Hydrobiol., 1978, 63 (1). [p.89, Fig.5].
Stage-specific abundance of A. clausi from Jakle's Lagoon in 1973 and 1974.
Cohorts (I-XI are delimited by the alternate pattern of shading.
Nota: The population dynamics and production of A. clausi were studied in a small temperate lagoon (surface area of approximateky 25,600 m2, mean depth 2.4 m) located on the southern end of San Juan Island (Washington) situated north of Puget Sound. An approach which integrated laboratory and in situ experiments with time-series sampling of the field population.
The cycles of abundance were similar in the two years of study and were not affected by differences in the cycles of tidal inflow, temperature, and food availability even though the latter two factors appreciably affected growth, development, and fecundity rates. The abubdance cycle is controlled by an annually consistent pattern of copepodid and adult mortality believed to be due predation by the three-spined stickleback (dominant fish species in the lagoon).
Cannibalism and periodic tidal stimulation of hatching of accumulated eggs in the sediment help to regulate population abundance within seasonal limits. |
 Issued from : M.R. Landry in Int. Revue ges. Hydrobiol., 1978, 63 (1). [p.96, Fig.10]. Issued from : M.R. Landry in Int. Revue ges. Hydrobiol., 1978, 63 (1). [p.96, Fig.10].
Seasonal changes in cephalothorax lengths of C. calusi adult males (broken line) and females (solid line) of A. clausi (from Jakle's Laggon).
Vertical lines denote 95% confidence limits. |
 Issued from : M.R. Landry in Int. Revue ges. Hydrobiol., 1978, 63 (1). [p.87, Fig.3].Seasonal cycle of environmental variables in Jakle's Lagoon). Issued from : M.R. Landry in Int. Revue ges. Hydrobiol., 1978, 63 (1). [p.87, Fig.3].Seasonal cycle of environmental variables in Jakle's Lagoon).
Horizontal broken line denotes sill height. |
 issued from : C. Halsband & H.J. Hirche in Mar. Ecol. Prog. Ser., 2001, 209. [p.222, Fig.3]. issued from : C. Halsband & H.J. Hirche in Mar. Ecol. Prog. Ser., 2001, 209. [p.222, Fig.3].
Acartia clausi. Reproductive parameters at Helgoland Roads.
(a) Cumulative egg production (eggs by female) of 5 individuals during 2.5 d period; (b) egg production rate, EPR; (c) proportion of females spawning; (d) prosome length. |
 issued from : C. Halsband & H.J. Hirche in Mar. Ecol. Prog. Ser., 2001, 209. [p.221, Fig.2]. issued from : C. Halsband & H.J. Hirche in Mar. Ecol. Prog. Ser., 2001, 209. [p.221, Fig.2].
Seasonal cycles of (a) temperature and salinity at Helgoland Roads. (b) phytoplankton at Helgoland Roads. 'others' = total phytoplankton carbon - diatom carbon. Phytoplankton data smoothed by 3-point running average. |
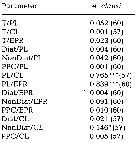 issued from : C. Halsband & H.J. Hirche in Mar. Ecol. Prog. Ser., 2001, 209. [p.224, Table 2]. issued from : C. Halsband & H.J. Hirche in Mar. Ecol. Prog. Ser., 2001, 209. [p.224, Table 2].
Correlation coefficients (r2) between temperature at collection (T), prosome length (PL), clutch size (CL), egg production rate (EPR), diatom carbon (Diat), non-diatom carbon (NonDiat), and total phytoplankton carbon (PPC) at Helgoland Roads.
Clutch size = daily egg production rate of spawning females. Sample size in parentheses. Significance levels = * p<0.01; *** p < 0.0001. |
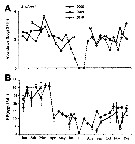 Issued from : S. Boyer, M. Bouvy & D. Bonnet in Estuar, Coast. Shelf Sci., 2013, 117. [p.129, Fig.3 A, B]. Issued from : S. Boyer, M. Bouvy & D. Bonnet in Estuar, Coast. Shelf Sci., 2013, 117. [p.129, Fig.3 A, B].
Acartia clausi: A, Abundance (ind. 33) over a year at the monitoring station in 2008, 2009 and 2010. B, Egg production (EP) .
Bars: standards deviations.
Samples collected at a fixed station (43°25'N, 03°40'E) in the Thau lagoon, close to Sète channel, with a WP2 net (200 µm mesh aperture). Mesozooplankton collected by horizontal hauls at 1 m depth. |
 Issued from : S. Boyer, M. Bouvy & D. Bonnet in Estuar, Coast. Shelf Sci., 2013, 117. [p.128, Fig.2]. Issued from : S. Boyer, M. Bouvy & D. Bonnet in Estuar, Coast. Shelf Sci., 2013, 117. [p.128, Fig.2].
Environmental parameters at the sampling station in 2008, 2009, 2010, in the Thau lagoon, close to Sète channel. .
Bars: Standards deviations.
A: temperature (°C); B, salinity (psu); c, chlorophyll a concentration (µg /L). |
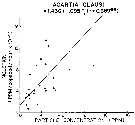
 Issued from : S. Boyer, M. Bouvy & D. Bonnet in Estuar, Coast. Shelf Sci., 2013, 117. [p.132, Fig.6, A]. Issued from : S. Boyer, M. Bouvy & D. Bonnet in Estuar, Coast. Shelf Sci., 2013, 117. [p.132, Fig.6, A].
Acartia clausi: Relationship between egg production (EP) and prosome length (PL), in the Thau lagoon, close to Sète channel. .
Black dotted lines represent the linear regression for all points. |
 Issued from : S. Boyer, M. Bouvy & D. Bonnet in Estuar, Coast. Shelf Sci., 2013, 117. [p.130, Table 2]. Issued from : S. Boyer, M. Bouvy & D. Bonnet in Estuar, Coast. Shelf Sci., 2013, 117. [p.130, Table 2].
Summary results after model averaging: effects of each single environmental parameter Chl a (Chlorophyll a concentration), T (temperature), S (salinity and their interactions (:) on egg production in Acartia clausi and Acartia discaudata at the sampling station in 2008, 2009, 2010, in the Thau lagoon, close to Sète channel. |
 Issued from : S. Boyer, M. Bouvy & D. Bonnet in Estuar, Coast. Shelf Sci., 2013, 117. [p.131, Fig.5, A]. Issued from : S. Boyer, M. Bouvy & D. Bonnet in Estuar, Coast. Shelf Sci., 2013, 117. [p.131, Fig.5, A].
Acartia clausi: Egg production (EP) in function of salinity (S) and temperature (T) in the Thau lagoon, close to Sète channel.
Blue circles: 2008; red circles: 2009; black circles: 2010. |
 Issued from : M.G. Mazzocchi, L. Dubroca, C. Garcia-Comas, I. Di Capua & M. Ribera d'Alcalà in Prog. Oceanogr., 2012, 97-100. [p.141, Fig.7]. Issued from : M.G. Mazzocchi, L. Dubroca, C. Garcia-Comas, I. Di Capua & M. Ribera d'Alcalà in Prog. Oceanogr., 2012, 97-100. [p.141, Fig.7].
Average annual cycle of abundance (ind. m3) of Acartia clausi at station MC in the period 1984-2006.
Nota: Individual samples collected by vertical tows in the upper 50 m at station MC in the Gulf of Naples, depth < 100m. |
 Issued from : M.G. Mazzocchi, L. Dubroca, C. Garcia-Comas, I. Di Capua & M. Ribera d'Alcalà in Prog. Oceanogr., 2012, 97-100. [p.139, Fig.3]. Issued from : M.G. Mazzocchi, L. Dubroca, C. Garcia-Comas, I. Di Capua & M. Ribera d'Alcalà in Prog. Oceanogr., 2012, 97-100. [p.139, Fig.3].
Average annual cycle of (a) temperature (*C), (b) salinity (psu), and (c) chlorophyll a concentration (mg m3) integrated in the 0-50 m layer at Station MC (Gulf of Naples) in the period 1984-2006. Box-and-whisker plots have whisker range fixed at 1.5 times the interquartile interval. |
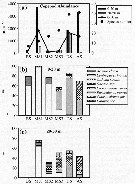 Issued from : S. Zervoudaki, E.D. Christou, G. Assimakopoulou & al. in J. Mar. Systems, 2011, 86. [p.49, Fig.3]. Issued from : S. Zervoudaki, E.D. Christou, G. Assimakopoulou & al. in J. Mar. Systems, 2011, 86. [p.49, Fig.3].
Copepod abundance (a) (ind/m3, bars and line), number of species (a) (symbol) and relative abundance (b and c) (%, stacked bars) of the dominant copepod species on the total copepod populations at all stations from BS to AS following the BSW, during April 2008. Note that zooplankton sampling in BS was performed in 0-30 m.
See Chart, figure 1 below for the transect between Aegean Sea (AS) and the Bosphorus (BS.
Nota: Mean egg production (egg/female/day) 38 ±2.7 (at BS); 12.9 ± 1.2 (at MS1); 21 ± 2.4 (at MS2). |
 Issued from : S. Zervoudaki, E.D. Christou, G. Assimakopoulou & al. in J. Mar. Systems, 2011, 86. [p.46, Fig.1]. Issued from : S. Zervoudaki, E.D. Christou, G. Assimakopoulou & al. in J. Mar. Systems, 2011, 86. [p.46, Fig.1].
Sampling station locations (depth contours in meters) investigated during the cruise in the Turkish Strait System (Bosphorus Straits, Marmara Sea and Dardanelles Straits) and in the northern Aegean Sea during April 2008. Line shows the intrusion of the Black Sea water (BSW) in the northern Aegean Sea. |
 Issued from : S. Zervoudaki, E.D. Christou, G. Assimakopoulou & al. in J. Mar. Systems, 2011, 86. [p.48, Fig.2]. Issued from : S. Zervoudaki, E.D. Christou, G. Assimakopoulou & al. in J. Mar. Systems, 2011, 86. [p.48, Fig.2].
Vertical profiles of temperature (°C), Salinity and Chl a (µg/l) at all stations from BS (Bosphore) to AS (Aegean Sea) following the BSW (Black Sea water), up to 50 m of the water column during April 2008.
Note the different scale in salinity and temperature at DS and AS stations (see chart: fig.1 above) |
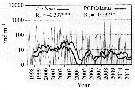 Issued from : I. Uriarte, F. Villate & A. Iriarte in J. Plankton Res., 2016, 38 (3). [p.724]. Issued from : I. Uriarte, F. Villate & A. Iriarte in J. Plankton Res., 2016, 38 (3). [p.724].
Monthly time-series from 1998 to 2011 of Acartia clausi (black) and PCPCalanus (mostly C. helgolandicus, Paracalanus spp., Clausocalanus spp., Pseudocalanus elongatus (grey) in the inner estuary of Bilbao (NW Spain). Thicker lines are moving averages. Ro is the Spearman's rank correlation coefficient (***P<0.01; **P<0.05)
Nota: A. clausi showed positive correlation with precipitation and NAO index. PCPCalanus were correlated with chlorophyll a, EA index (East Atlantic pattern) and DOS (Dissolved Oxygen Saturation). The species, indigenous neritic species dominated the copepod assemblage from 1998 to 2002. |
 Issued from S. Razouls in XXIII rd Congress of Athens, 3-11 November 1972. [p.2]. Oxygen consumed by individual (adult) in the Banyuls Bay and equivalent carbon asked. Issued from S. Razouls in XXIII rd Congress of Athens, 3-11 November 1972. [p.2]. Oxygen consumed by individual (adult) in the Banyuls Bay and equivalent carbon asked.
(1) Hydrological season in the stability period: Eté = Summer: 18-20 °C; Hiver = Winter: 13-10°C.
Espèces = species; Saison = Season; Lg céph.= cephalothoracic length; an = individual. |
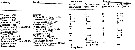
 Issued from : G. B. Deevey in Bull. Bingham Oceanogr. Coll., 1960, 17 (2). [p.68, Table V]. Issued from : G. B. Deevey in Bull. Bingham Oceanogr. Coll., 1960, 17 (2). [p.68, Table V].
Simple, partial and multiple correlation coefficients. for mean length of cephalothorax with the temperature and Chlorophyll of the day of sampling and averaged for the previous month.
The calculed and observed mean cephalothorax length cycles of female Acartia clausi in Long Island Sound, (E coast U.S.A.) March 1952 to June 1953. |
 Issued from : G.B. Deevey in Bull. Bingham Oceanogr. Coll., 1960, 17 (2). [p.74, Fig.10]. Issued from : G.B. Deevey in Bull. Bingham Oceanogr. Coll., 1960, 17 (2). [p.74, Fig.10].
Obsrrved seasonal variations in median cephalothorax length of female Acartia clausi (Marshall, 1949) in Loch Striven in 1933) compared with length calculated from the mean temperature and number of diatoms of the month previous to sampling. |
 Issued from : G. B. Deevey in Bull. Bingham Oceanogr. Coll., 1960, 17 (2). [p.73, Table VIII]. Issued from : G. B. Deevey in Bull. Bingham Oceanogr. Coll., 1960, 17 (2). [p.73, Table VIII].
Correlation coefficients for mean cephalothorax lengths with the temperature and phytoplankton of the day of samplingt and averaged for the previous four weeks obtained with 21 and 20 pairs of data for female Acartia clausi from Loch Striven (W Clyde estuary)).
Quantity of diatoms (data published by S.M. Marshall, 1949 .
In 1933 the extreme range temperature at 0 m was 4.5-16.4°C and at 30 m 6.37-12.98°C. |
 Issued from : G.A. Deevey in Bull. Bingham Oceanogr. Coll., 1960, 17 (2); [p.76, Table IX]. Issued from : G.A. Deevey in Bull. Bingham Oceanogr. Coll., 1960, 17 (2); [p.76, Table IX].
Correlation coefficients for mean cephalothorax lengths for Acartia clausi with the temperature at sampled and averaged for the previous month from the English Channel (data from Digby, 1950).. |
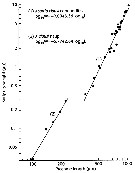
 Issued from : L. Yebra, A. Hernandez de Rojas, N. Valcarcel-Pérez & al. in Mar. Ecol. Prog. Ser., 2019. [p.8, Table 4] Issued from : L. Yebra, A. Hernandez de Rojas, N. Valcarcel-Pérez & al. in Mar. Ecol. Prog. Ser., 2019. [p.8, Table 4]
Mean length (mm) and width (mm) corresponding standard length (SL, mm) of the potential predator (Sardina pilchardus) calculated as in Morote & al. (2012), 1 length after Conway (2012).; bold indicates develpmental stages falling within the expected prey size for the sardine larvae in the study (SL < 20 mm). |
 Issued from : W.C.M. Klein Breteler, N. Schogt & J. van der Meer in J. Plankton Res., 1994, 16 (8). [p.1045, Table I]. Issued from : W.C.M. Klein Breteler, N. Schogt & J. van der Meer in J. Plankton Res., 1994, 16 (8). [p.1045, Table I].
The mean duration (days), its standar error (SE) and the among-cultures variance (% of the total variance) of the life stages Acartia clausi cultured at 15°C and excess food.
Negative values of among-cultures variance are indicated by 0.
Nauplii (1-6) and copepodites (7-11).
The summed duration of females (generation time.br>
Nota: individuals from the North Sea (Texel, Netherlands Institute for Sea Research).
The brood was raised to maturity at excess food from continuous cultures of Rhodomonas sp. (4.8-8.5 µm ESD) and Isochrysis galbana (3.6-7.0 µm ESD). The heterotrophic dinoflagellate Oxyrrhis marina (10.4-19.0 µm) lived together with the copepods in the culture tank. |
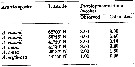 Issued from : R.C. Subbraju & K. Krishnamurphy in mar. Biol., 1972, 14. [p.28, Table 2] Issued from : R.C. Subbraju & K. Krishnamurphy in mar. Biol., 1972, 14. [p.28, Table 2]
Duration of developmental time in relation to latitude in different species of the genus Acartia. |
 Issued from : R.C. Subbraju & K. Krishnamurphy in mar. Biol., 1972, 14. [p.28, Table 4] Issued from : R.C. Subbraju & K. Krishnamurphy in mar. Biol., 1972, 14. [p.28, Table 4]
Number of generations and developmental period recorded in A. clausi and A. tonsa at various localities. |
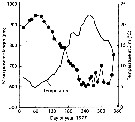 Issued from : C.B. Miller in Biological Oceanography 2004/2005, Blackwell Publishing. [p.155, Fig.7.18]. From Uye, 1982 Issued from : C.B. Miller in Biological Oceanography 2004/2005, Blackwell Publishing. [p.155, Fig.7.18]. From Uye, 1982
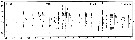
Seasonal variation in body length (prosome: black circles) of adult female Acartia clausi in Onagawa Bay compared to water temperature |
 Issued from : C.B. Miller in Biological Oceanography 2004/2005, Blackwell Publishing. [p.155, Fig.7.19]. From Uye, 1982. Issued from : C.B. Miller in Biological Oceanography 2004/2005, Blackwell Publishing. [p.155, Fig.7.19]. From Uye, 1982.
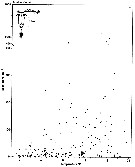
Relationship of dry body weighjt to prosome length (not including the tail or urosome) in Acartia clausi ofv Onagawa Bay. |
 Issued from : C.B. Miller in Biological Oceanography 2004/2005, Blackwell Publishing. [p.156, Fig.7.20]. From Uye, 1982. Issued from : C.B. Miller in Biological Oceanography 2004/2005, Blackwell Publishing. [p.156, Fig.7.20]. From Uye, 1982.
Stage of development vs. development time in Acartia clausi reared in the laboratory with abundant food at temperatures from 2.5 to 23.2°C.
Individuals from Onagawa Bay (Japan).
Miller note that development time in the laboratory as function of temperature is an approximation because the laboratory rate applied to predict stage duration from the temperature is not inhibited even partially by low food levels, but usually for inshore habitats it seems justified. |
 Issued from : C.B. Miller in Biological Oceanography 2004/2005, Blackwell Publishing. [p.157, Fig.7.22]. After Uye, 1982. Issued from : C.B. Miller in Biological Oceanography 2004/2005, Blackwell Publishing. [p.157, Fig.7.22]. After Uye, 1982.
Relationship of daily estimates of production to biomass ratio (P=/B) for Acartia clausi in Onagawa Bay (Japan) to temperature.
Miller note that over the 1.5 year study, the lowest productivity was 0.0374 mgC m-3 day-1. Some of that comes from stock variation, some from growth rate variation (vs. temperature). Total annual production was 163 mgC m-3 yr-1, or about 2.5 gC m2 yr-1.
In a nearshore embayment like this the primary production is very likely of the order of 500 gC m-2 yr-1. If we assume that the gross growth efficiency of these copepods is about 20% (a low-sde estimate), then they use about 12/500 or 3% of the primary production. |
 Issued from : C.B. Miller in Biological Oceanography 2004/2005, Blackwell Publishing. [p.157, Table 7.1]. Issued from : C.B. Miller in Biological Oceanography 2004/2005, Blackwell Publishing. [p.157, Table 7.1].
Acartia clausi dominant zooplankters in coastal waters. Data characterize the season of peak production. Mostly taken from Landry (1978):
From the Black Sea (Petipa, 1967): 15 mgC m-2 day-1.
From Onagawa Bay, Japan (Uye, 1982): 2.5 mgC m-2 day-1.
Miller underlines the difficulties of the production estimations for single species, and virtually none for whole systems, but we would like to know how much food the oceans produces for animals we harvest like herring, anchovy, cod, and pollack. See Huntley & Lopez, 1992: model); Kleppel, Davis & Carter, 1996; Huntley, 1996; Hirst & Sheader, 1997; Hirst & Lampitt, 1998; Vidal, 1980. |
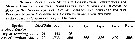
 Issued from : S. Ban, C. Burns, J. Castel, Y. Chaudron & al. in Mar. Ecol. Prog. Ser., 1997, 157. [p.289, Table 1]. Issued from : S. Ban, C. Burns, J. Castel, Y. Chaudron & al. in Mar. Ecol. Prog. Ser., 1997, 157. [p.289, Table 1].
Synopsis of feeding/reproduction experiments. A total of 17 diatom and 16 copepod species, representative of a variety of worldwide temperate and subarctic environments (E: estuarine, C: coastal ocean), were screened.
Data for fecundity and hatching success are average values measured at the start and end of the inciubations in a minimum of 3 replicate batches, showing the variation in time of the effects of diatoms on copepod reproduction.
Level of significance of the diatom effect between treatments and controls (e.g. non-diatom diets) in categories I to III was p < 0.01. No.. rank (for comparison with Table 2, p.290).
For the signification of the categories I to IV (fecundity vs. Hatching success vs. Duration of experiment days-1): See Calanus finmarchicus.
List of the 12 marine or estuarine species studied (fresh water excluded. CR): Acartia clausi, A. grani, A. steueri, A. tonsa, Calanus finmarchicus, C. helgolandicus, C. pacificus, Centropages hamatus, C. typicus, Eurytemora affinis, Temora longicornis, T. stylifera.
|
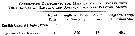
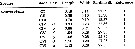
 Issued from : S. Ban, C. Burns, J. Castel, Y. Chaudron & al. in Mar. Ecol. Prog. Ser., 1997, 157. [p.290, Table 2]. Issued from : S. Ban, C. Burns, J. Castel, Y. Chaudron & al. in Mar. Ecol. Prog. Ser., 1997, 157. [p.290, Table 2].
Combinations of copepod and non-diatom diets in controls in concentrations ranging from 104 to 105 cells ml-1. Data for fecundity and hatching success are average values measured at the start and end of incubation in a minimum of 3 replicate batches.
N.A: natural assemblages of phytoplankton at time of incubation were for No 1, 40% diatoms, for No 2, >50% diatoms.
Nos1, 2, 3: Category I, No 30: Category III. |
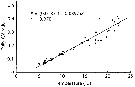
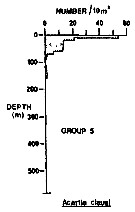 Issued from : R.K. Pipe & S.H. Coombs in J. Plankton Res., 1980, 2 (3). [p.230, Fig.4]. Issued from : R.K. Pipe & S.H. Coombs in J. Plankton Res., 1980, 2 (3). [p.230, Fig.4].
Acartia clausi from Wyville Thomson Ridge (60°03.4' N, 07°03.9' W to 60°08' N, 07°02.9' W) on 24 April 1978: Vertical distribution of this group 1 contained 3 species which are all commonly recorded, surface-living organisms of the North Atlantic and Norwegian Sea. The most abundant was Acartia clausi (82.8% of the animals in the group); it occurred between the surface and 160 m with its highest numbers in the upper 10 m of the water column. Other species: Paracalanus parvus, and Evadne nordmanni (Cladocera).
A computed coefficient of dissimilarity was used in association with a 'group-average' clustering strategy (see Clifford & Stephenson, 1975) to classify the plankton taxa on the basis of their vertical distribution after the indices of similarity and the results arranged diagramatically in the form of a dendogram (Fig.2). Classification was carried out using the Bray-Curtis measure which gives a coefficient of dissimilarity. |
 Issued from : S. Salah, O. Ettahiri, A. Berraho, A. Benazzouz, K. Elkalay & A. Errhif in C.R. Biologies, 2012, 335 [p.164, Fig.5].
Distribution spatiotemporelle de la densité d'Acartia clausi (ind.m3. Issued from : S. Salah, O. Ettahiri, A. Berraho, A. Benazzouz, K. Elkalay & A. Errhif in C.R. Biologies, 2012, 335 [p.164, Fig.5].
Distribution spatiotemporelle de la densité d'Acartia clausi (ind.m3.
Study of the Cap Ghir upwelling filament (31°N) de la côte vers le large.
|
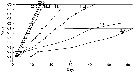
 Issued from : M.R. Landry & V.L. Fagerness in Bull. Mar. Sc., 1988, 43 (3) [p.521, Table 4]. Issued from : M.R. Landry & V.L. Fagerness in Bull. Mar. Sc., 1988, 43 (3) [p.521, Table 4].
Mean horizontal (H) and vertical (V) components of swimming velocity for naupliar and copepodd I stages of Calanus pacificus.
Swimming speeds (mm/s) from 30-s video-recorded observations of N copepods.
See to Calanus pacificus and Pseudocalanus sp. (as figured to P. elongatus for information, several species of this genus in the NE Pacific, see chart in zone 24). |
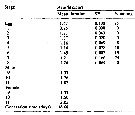
| | | | Loc: | | | Atlant. (N & S), Brazil (Cananéia), Congo, Inory Coast, Ebrié Lagoon, Casamance, Dakar, Bermuda, Chesapeake Bay, Delaware Bay, Long Island Sound, Narragansett Bay, off Woods Hole, Buzzards Bay, Cape Cod, Damariscotta estuary, Halifax, Nova Scotia (E & SW), Shédiac Bay, Northumberland Strait, Bedford Basin, Passamaquoddy Bay, G. of St. Lawrence, Rimouski, W Labrador, Tessiarsuk fjord, S Iceland, off Morocco-Mauritania, Cap Ghir, Canary Is., off Madeira, Portugal, Mondego estuary, Ria de Aveiro, Coruña, off W Cap Finisterre, Vigo, Santander, Bilbao estuary, Bay of Biscay, Arcachon Bay, Gironde estuary, La Pallice roadsteadt, Glenans Islands, Belon estuary, Ireland, Galway Bay, Lough Hyne, Bristol Channel, Millport (Scotland), Roadstead of Brest, English Channel, Roscoff, Morlaix estuary, Granville, Plymouth, Pas de Calais, North Sea, Oslofjord, Skagerrak, Gullmar Fjord, Kattegat, Gullmar Fjord, Helgoland Roads, Bay of Lübeck, Gulf of Mecklenburger, Faroe, Norway Sea, Norway (fjords, Raunefjorden, Kosterfjorden), Wyville Thomson Ridge, Beaufort Sea, White Sea, Barents Sea, Pechora Sea, Kara Sea, Ibero-morocco Bay, off W Tangier, Medit. (Alboran Sea, Habibas Is., Sidi fredj coast, Algier, N Tunisia, Bay of Tunis (laggon), G. of Gabes, Malaga harbour, Mar Menor, Castellon, Baleares, off Barcelona, Banyuls, Thau lagoon, Gulf of Fos, Marseille, Toulon, Villefranche-s-Mer, Ligurian Sea, Lake Faro, Naples, Tyrrhenian Sea, Milazzo, Strait of Messina, NW Tunisia, Sfax, G. of Gabès, Adriatic Sea, Lljet Is., Venice lagoon, Po delta, G. of Trieste, Taranto, Ionian Sea, Aegean Sea, Thracian Sea, Lebanon Basin, Iskenderun Bay, W Egyptian coast, Alexandria, Bardawill Lagoon, Marmara Sea, Black Sea, Agigea (cosat), Sevastopol Bay), Caspian Sea, Port Said, Ballah (Km. 54 from Port Said), Suez Canal, Hurghada, Red Sea, Indian (rare, Pichavaram mangrove), ? China Seas (Bohai Sea, Yellow Sea, East China Sea), S Korea, Japan Sea, Maizuru Bay, Japan (Izu, Tokyo Bay, Non Onagawa Bay, Shijiki Bay, Inland Sea) , ? Aleutian Is., ? Alaska, ? Icy Strait, ? British Columbia: Fjord system (Alice Arm & Hastings Arm), Hecate Strait, ? Vancouver Is., ? off Washington, ? Georgia Strait, Oregon (coast, Yaquina), San Francisco Bay, California, off La Jolla, Baja California (W), Bahia Magdalena, G. of California, La Paz, Acapulco Bay, G. of Tehuantepec, W Costa Rica, ? Australia (Swan River estuary, New South Wales, Great Barrier, SE), Peru, Chile | | | | N: | 548 ? (some being confused) | | | | Lg.: | | | (35) F: 1,12; F,M: 1,02; (38) F: 1,2; M: 1,18-1,08; (46) F: 1,22-1,17; M: 1,07-1; (65) F: 1,15; M: 1; (145) F: ± 1,28; M: ± 1,26; (164) F: 1,307-0,977; M: 1,209-0,99; (167) F: 0,82-0,7 [brackish]; 1,47; M: 0,71 [brackish]; M: 1,31; (237) F: 1.0; (290) F: 0,7-1,2; M: 0,7-1; (325) F: 0,81-1,47; M: 0,71-1,31; (373) F: 1,34-1,06; M: 1,19-0,99; (449) F: 1,22-1,17; M: 1,07-1; (825) F: 0,83-0,74; M: 0,79-0,68; (833)* F: 1-1,264; M: 1,069-1,24; (920) F: 1,30; (1047) F: 0,6; (1302) F: 0,824-1,12; M: 0,802-0,966; (1110) F: 0,96-1,39; M: 0,96-1,34; (1225) F: 1,13; M: 1,16; (1232) F: 0,91-1,8; M: 0,85-1,2; {F: 0,60-1,47; M: 0,68-1,34}
*(833): Body lengths (cephalosome + abdomen only, caudal rami no taken into account).
After Beldescu & al. (1956, in The Black Sea), Lg: M = 1,3-1,5; weight M = 0,043 mg. | | | | Rem.: | Littoral, neritic. 0-160 m (Pipe & Coombs, 1980, Arctic: 60°N, 07°E).
Rare in the open sea and mesopelagic (in Roe, 1984), sometimes bathypelagic (Farran, 1926). For Acha & al. (2020) this species is observed mainly on the coastal in front of Rio de La Plata (Argentina).
According to Østvedt (1955) this species at Weather ship M (Norwegian Sea) made a similar seasonal appearance as Paracalanus parvus.
The forms reported for the Pacific need to be revised (see: Carillo, Miller & Wiebe, 1974 concerning A. hudsonica). According to these authors the atlantic and pacific forms are genetically different, because interbreeding, experimentally realised before, was not possible anymore. Bradford (1976) considers, like more authors, that the wide geographic distribution of A. clausi must mask the existence of distinct species (rejection of the hypothesis of varieties resulting from ecological conditions).
Confused in the NW Pacific and the Arctic seas with A. hudsonica (see: Bradford, 1976; Ueda, 1986); off Korea and Japan with A. omorii and A. hudsonica (Kang & Lee, 1990), with A. ensifera in New Zealand.
Sometimes confounded with other species, like A. margalefi in European brackish waters (the superficial morphological characters do not permit a distinction with A. clausi, if it is not the difference in length; the same goes for Acartia teclae. For E.G. Durbin & al. (1992, p.343) A. hudsonica corresponds to A. clausi in earlier studies from New England coastal waters (cf. Conover, 1956; Deevey, 1960; Durbin & Durbin, 1981).
After Christou a Verriopoulos (1993) the development of A. clausi in Saronikos Gulf (E Mediterranean Sea) is not 'isochronal'.
Seregin & Piontkovski (1998) indicate for this species a salinity tolerance of 5 to 35 g/L.
Occurrence in the China seas confirmed by W. Zhang (comm. pers. 2006).
For Itoh (1970 a, fig.2, from co-ordonates) the Itoh's index value from mandibular gnathobase = 530, and for Schnack (1989) = 814.
Gaudy (1962, p.150) points to 6 generations by year in the Gulf of Marseille (NW Medditerranean Sea).
After Ueda & al., 1983 (p.167, Table 2 & p.169: Table 4) at Shijiki Bay (Japan): (1)- Shape and diameter of swarm, (2)- depth (m), (3)- swarming position, (4)- number of samples examined, (5)- Mean % of adults, (6)- Mean % of females among adults :
(1)- continuous flat swarm; (2)- 14 m; (3)- over sandy flat bottom; (4)- 1; (5)- 52.6; (6)- 72.4.
After C. Razouls (unpublished) observed in one occasion directly on the rocky shore of Banyuls, at mid-day by full sun light in surface layer (irregular swarm of several meters of red color).
Zaika (1968) in the Black Sea, finds a daily ratio P/B = .04 d-1 and an annual P/B yr-1 = 16. Greze & al. (1968), nearshore in the Black Sea, find a daily ratio P/B = .09 d-1 and an annual P/B yr-1 = 32.
Landry (1968), in the coastal lagoon Washington (8-20°C), finds a daily ratio P/B = 012-0.23 d-1 and an annual P/B yr-1 = 57 (calculated from author data by Burkill & Kendall, 1982).
Production :
After Vieira & al., (2003) from Mondego estuary (Portugal): 63.44 mgC per m3 per year. P/B = 25.50.
After observed and calculated developmental time in weeks: 8.0, 8.30 at 62°.00 and 6.0 , 5.40 at 50°15', respectively.
After Benedetti & al. (2018, p.1, Fig.2) this species belonging to the functional group 4 corresponding to small filter feeding herbivorous and mixed feeding omnivorous (mostly broadcasters).
Often confounded with Acartia (Acartiura) omorii in the japanese waters.
The feeding mode after Barton & al. (2013, Table 1) is a mixing between 'ambush' and 'feeding current' (hovering) (See definition in Rem. Centropages typicus.
Cf Calanus pacificus (figs 3, 4 and Table 1, from Lopez-Ibarra & Palomares-Garcia). | | | Last update : 28/10/2022 | |
|
|
 Any use of this site for a publication will be mentioned with the following reference : Any use of this site for a publication will be mentioned with the following reference :
Razouls C., Desreumaux N., Kouwenberg J. and de Bovée F., 2005-2026. - Biodiversity of Marine Planktonic Copepods (morphology, geographical distribution and biological data). Sorbonne University, CNRS. Available at http://copepodes.obs-banyuls.fr/en [Accessed May 06, 2026] © copyright 2005-2026 Sorbonne University, CNRS
|
|
|
|

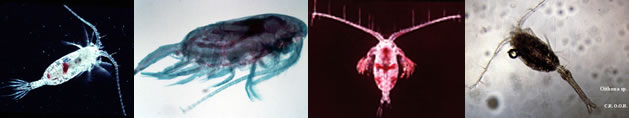


 clausi - Plate 1 of morphological figures',750,500);)
 clausi - Plate 2 of morphological figures',750,500);)
 clausi - Plate 3 of morphological figures',750,500);)
 clausi - Plate 4 of morphological figures',750,500);)
 clausi - Plate 5 of morphological figures',750,500);)
 clausi - Plate 6 of morphological figures',750,500);)
 clausi - Plate 7 of morphological figures',750,500);)
 clausi - Plate 8 of morphological figures',750,500);)
 clausi - Plate 9 of morphological figures',750,500);)
 clausi - Plate 10 of morphological figures',750,500);)
 clausi - Plate 11 of morphological figures',750,500);)
 clausi - Plate 12 of morphological figures',750,500);)
 clausi - Plate 13 of morphological figures',750,500);)
 clausi - Plate 14 of morphological figures',750,500);)
 clausi - Plate 17 of morphological figures',750,500);)
 clausi - Plate 19 of morphological figures',750,500);)
 clausi - Plate 20 of morphological figures',750,500);)
 clausi - Plate 23 of morphological figures',750,500);)
 clausi - Plate 25 of morphological figures',750,500);)
 clausi - Plate 26 of morphological figures',750,500);)
 clausi - Plate 27 of morphological figures',750,500);)
 clausi - Plate 28 of morphological figures',750,500);)
 clausi - Plate 29 of morphological figures',750,500);)
 clausi - Plate 30 of morphological figures',750,500);)
 clausi - Plate 32 of morphological figures',750,500);)
 clausi - Plate 33 of morphological figures',750,500);)
 clausi - Plate 34 of morphological figures',750,500);)
 clausi - Plate 35 of morphological figures',750,500);)
 clausi - Plate 36 of morphological figures',750,500);)
 clausi - Plate 37 of morphological figures',750,500);)
 clausi - Plate 39 of morphological figures',750,500);)
 clausi - Plate 40 of morphological figures',750,500);)
 clausi - Plate 41 of morphological figures',750,500);)
 clausi - Plate 42 of morphological figures',750,500);)
 clausi - Plate 43 of morphological figures',750,500);)
 clausi - Plate 44 of morphological figures',750,500);)
 clausi - Plate 45 of morphological figures',750,500);)
 clausi - Plate 46 of morphological figures',750,500);)
 clausi - Plate 47 of morphological figures',750,500);)
 clausi - Plate 48 of morphological figures',750,500);)
 clausi - Plate 49 of morphological figures',750,500);)
 clausi - Plate 50 of morphological figures',750,500);)
 clausi - Plate 51 of morphological figures',750,500);)
 clausi - Plate 52 of morphological figures',750,500);)
 clausi - Plate 53 of morphological figures',750,500);)
 clausi - Plate 54 of morphological figures',750,500);)

 clausi - Distribution map 3',750,500);)
 clausi - Distribution map 4',750,500);)
 clausi - Distribution map 8',750,500);)
 clausi - Distribution map 10',750,500);)
 clausi - Distribution map 11',750,500);)
 clausi - Distribution map 13',750,500);)
 clausi - Distribution map 14',750,500);)
 clausi - Distribution map 15',750,500);)
 clausi - Distribution map 17',750,500);)
 clausi - Distribution map 18',750,500);)
 clausi - Distribution map 19',750,500);)
 clausi - Distribution map 20',750,500);)
 clausi - Distribution map 21',750,500);)
 clausi - Distribution map 22',750,500);)
 clausi - Distribution map 23',750,500);)
 clausi - Distribution map 24',750,500);)
 clausi - Distribution map 25',750,500);)
 clausi - Distribution map 26',750,500);)
 clausi - Distribution map 27',750,500);)
 clausi - Distribution map 29',750,500);)
 clausi - Distribution map 31',750,500);)
 clausi - Distribution map 32',750,500);)
 clausi - Distribution map 33',750,500);)
 clausi - Distribution map 34',750,500);)
 clausi - Distribution map 41',750,500);)
 clausi - Distribution map 44',750,500);)
 clausi - Distribution map 45',750,500);)
 clausi - Distribution map 46',750,500);)
 clausi - Distribution map 47',750,500);)
 clausi - Distribution map 51',750,500);)
 clausi - Plate 1 of morphological figures)
 clausi - Plate 2 of morphological figures)
 clausi - Plate 3 of morphological figures)
 clausi - Plate 4 of morphological figures)
 clausi - Plate 5 of morphological figures)
 clausi - Plate 6 of morphological figures)
 clausi - Plate 7 of morphological figures)
 clausi - Plate 8 of morphological figures)
 clausi - Plate 9 of morphological figures)
 clausi - Plate 10 of morphological figures)
 clausi - Plate 11 of morphological figures)
 clausi - Plate 12 of morphological figures)
 clausi - Plate 13 of morphological figures)
 clausi - Plate 14 of morphological figures)
 clausi - Plate 15 of morphological figures)
 clausi - Plate 16 of morphological figures)
 clausi - Plate 17 of morphological figures)
 clausi - Plate 18 of morphological figures)
 clausi - Plate 19 of morphological figures)
 clausi - Plate 20 of morphological figures)
 clausi - Plate 21 of morphological figures)
 clausi - Plate 22 of morphological figures)
 clausi - Plate 23 of morphological figures)
 clausi - Plate 24 of morphological figures)
 clausi - Plate 25 of morphological figures)
 clausi - Plate 26 of morphological figures)
 clausi - Plate 27 of morphological figures)
 clausi - Plate 28 of morphological figures)
 clausi - Plate 29 of morphological figures)
 clausi - Plate 30 of morphological figures)
 clausi - Plate 31 of morphological figures)
 clausi - Plate 32 of morphological figures)
 clausi - Plate 33 of morphological figures)
 clausi - Plate 34 of morphological figures)
 clausi - Plate 35 of morphological figures)
 clausi - Plate 36 of morphological figures)
 clausi - Plate 37 of morphological figures)
 clausi - Plate 38 of morphological figures)
 clausi - Plate 39 of morphological figures)
 clausi - Plate 40 of morphological figures)
 clausi - Plate 41 of morphological figures)
 clausi - Plate 42 of morphological figures)
 clausi - Plate 43 of morphological figures)
 clausi - Plate 44 of morphological figures)
 clausi - Plate 45 of morphological figures)
 clausi - Plate 46 of morphological figures)
 clausi - Plate 47 of morphological figures)
 clausi - Plate 48 of morphological figures)
 clausi - Plate 49 of morphological figures)
 clausi - Plate 50 of morphological figures)
 clausi - Plate 51 of morphological figures)
 clausi - Plate 52 of morphological figures)
 clausi - Plate 53 of morphological figures)
 clausi - Plate 54 of morphological figures)
 clausi - Distribution map 3)
 clausi - Distribution map 4)
 clausi - Distribution map 5)
 clausi - Distribution map 6)
 clausi - Distribution map 7)
 clausi - Distribution map 8)
 clausi - Distribution map 9)
 clausi - Distribution map 10)
 clausi - Distribution map 11)
 clausi - Distribution map 12)
 clausi - Distribution map 13)
 clausi - Distribution map 14)
 clausi - Distribution map 15)
 clausi - Distribution map 16)
 clausi - Distribution map 17)
 clausi - Distribution map 18)
 clausi - Distribution map 19)
 clausi - Distribution map 20)
 clausi - Distribution map 21)
 clausi - Distribution map 22)
 clausi - Distribution map 23)
 clausi - Distribution map 24)
 clausi - Distribution map 25)
 clausi - Distribution map 26)
 clausi - Distribution map 27)
 clausi - Distribution map 28)
 clausi - Distribution map 29)
 clausi - Distribution map 30)
 clausi - Distribution map 31)
 clausi - Distribution map 32)
 clausi - Distribution map 33)
 clausi - Distribution map 34)
 clausi - Distribution map 35)
 clausi - Distribution map 36)
 clausi - Distribution map 37)
 clausi - Distribution map 38)
 clausi - Distribution map 39)
 clausi - Distribution map 40)
 clausi - Distribution map 41)
 clausi - Distribution map 42)
 clausi - Distribution map 43)
 clausi - Distribution map 44)
 clausi - Distribution map 45)
 clausi - Distribution map 46)
 clausi - Distribution map 47)
 clausi - Distribution map 48)
 clausi - Distribution map 49)
 clausi - Distribution map 50)
 clausi - Distribution map 51)
 clausi - Distribution map 52)
 clausi - Distribution map 53)
