|
|
 |
|
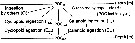
Calanoida ( Order ) |
|
|
|
Calanoidea ( Superfamily ) |
|
|
|
Calanidae ( Family ) |
|
|
|
Calanoides ( Genus ) |
|
|
| |
Calanoides natalis Brady, 1914 (F,M) | |
| | | | | | | Syn.: | Calanoides carinatus : Vervoort, 1963 (p.81); De Decker, 1984 (p.329); Schnack, 1989 (p.142, figs.); ? Timonin, 1997 (p.83, vertical migration, Rem.); Ceballos & al., 2004 (p.739); Blanco-Bercial & al., 2006 (p.802); Samba Diouf, 1991 (p.103, tableau 1);
Calanoides c.f. carinatus: Prusova & al., 2011 (p.29, figs.) | | | | Ref.: | | | Brady, 1914 (p.4, figs.F, M);
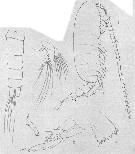
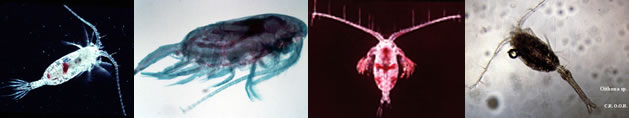
Viñas & al., 2015 (p.97, phylogeography, molecular index), Rem.; Bradford-Grieve & al., 2017 (p.816, F,M, table 1, , fig.2, phylogeny) | 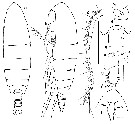 Issued from : J.M. Bradford-Grieve, L. Blanco-Bercial & I. Prusova in J. Nat. Hist., 2017, 51 (13-14). [p.817, Fig. 5]. Female: a-b, habitus (dorsal and lateral, respectively); c, A1; d, genital double-somite (lateral); e, same (dorsal); f, genital operculum (go) and left seminal receptacle (sr); g, caudal eamus (ventral); h, forehead (ventral). Scale bars: 1.0 mm (a-c); 0.1 mm (d-h). Nota: - Anterior margin of forehead triangular in dorsal and lateral views. - Rostrum extends into 2 long posteriorly directed filaments. - Urosome 4-segmented. - Genital double-somite symmetrical in dorsal view, widest part at anterior 1/4, bulges anteroventrally. Pair of seminal receptacles (sr) in lateral view slant anteroventral to posterodorsal at 18° relative to posterior border' of genital double-somite. - Caudal rami seta I absent, setae II and III lateral, setae IV and V terminal, seta VI inner distal (seta V longest neing longer than urosome including caudal rami), seta VII inserted immediately anterior to seta VI; setules decorate inner border'.
|
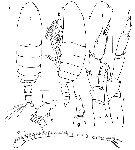
 Issued from : J.M. Bradford-Grieve, L. Blanco-Bercial & I. Prusova in J. Nat. Hist., 2017, 51 (13-14). [p.818, Fig. 6]. Female: a, A1 (ancestral segments I-XIX), b, A1 ( ancestral segments XX-XXVIII; c, A1 (ancestral segments X-XI; d, A1 (ancestral segments XXVII-VVVIII; e, A1 (segments I-XI; f, A1 (ancestral segment XXIII); g, A2. a - aesthetacs; pa - pseudoantennulate seta, va - vestigial aesthetasc. Scale bars = 0.1 mm. Nota: - A1 34-segmented, extending to about posterior border of 2nd urosomite; ancestral segments II-IV, X-XI, XXVII-XXVIII fused. Most setae are naked and of modified type (ms, weatherby & al., 1994; Lernz & al., 1996), aesthetascs (a) or vestigial aesthetascs (va), which are found on quadrithek females; 2 ventral-most setae on ancestral segment I and 1 posterior seta on each of ancestral segments XXIV-XXVI plumose; long setae on segments XXV and XXVI pseudo annulate (pa); - A2 with separate coxa and basis; coxa with 1 long inner plumose seta; basis with 2 long inner setae each with rows of short setules; exopod slightly longer than endopod; endopod 2-segmented (although line of fusion between segment 2 and 3 visible on posterior surface and marked by row of small spinules; segment 1 with 2 inner setae and distal outer patch of outer setules, terminal segment with 8 + 7 setae; exopod with segments I and II fused, segments III-IV fused- fusion line visible; ancestral segments I-VIII each with long plumose seta, terminal segment IX-X with 1 + 3 terminal setae.
|
 Issued from : J.M. Bradford-Grieve, L. Blanco-Bercial & I. Prusova in J. Nat. Hist., 2017, 51 (13-14). [p.820, Fig. 7]. Female: a, Md; b, Mx1; c, Mx2; d, Mxp. Scale bar = 0.1 mm. Nota: - Md coxal gnathobase damaged with opaline teeth missing, largest tooth ventral, separate from adjacent 4 teeth by large gap; 4 small teeth follow and a longer dorsal tooth; lash-like element broken; basis with 4 inner setae; endopod 2-segmented, segment 1 with large inner lobe, 4 distal inner setae and outer distal setules, segment 2 with 11 terminal setae, 2 of them shorter and row of outer setules; exopod 5-segmented with 1, 1, 1, 2 setae. - Mx1 praecoxal arthrite with 15 setae (4 of them on posterior surface, 1 on anterior surface) and 3 or 4large wide spines, and 2 to 5 small spines on posterior surface located midprowimally; coxal endite with 4 terminal setae, epipodite with 9 setae; basal endites 1 and 2 with 4 and 4 setae, respectively; exite with 1 seta; basis and endopod separate; endopod 2-segmented with segments 1 and 2 fused - fusion line visible, with 3, 4, 7 setae and 5 spinules on anterior surface; exopod with 11 setae. - Mx2 praecoxal endites 1 and 2 with 6 + 1 small and 3 setae, respectively; endites 2 and 3 on coxa with 3 and 3 setae, respectively, epipodite with 1 long plumose seta; endite 5 of basis longest with 4 setae (one of them heavier); endopodal segment 1 with well-developed love bearing 2 short + 1 large setae, endopodal segments 2-4 with 2, 2, 3 setae, respectively; inner surfaces of endites 2-5 each with 1 seta that is shorter and more densely lined with long spinules than other setae; endopodal segments 2 and 3 with inner setae shorter than outer setae. - Mxp directed ventrally so that setae on syncoxa and baisi directed into animal's midline; syncoxa (= a double segment derived from fusion of praecoxa and coxa) with 1, 2, 4 setae; basis with 3 setae; endopodal segment 1 partly separate bearing 2 setae, endopodal segments 2-6 with 4, 3, 2, 2 +1, 3 +1 setae, respectively.
|
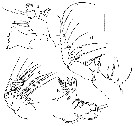
 Issued from : J.M. Bradford-Grieve, L. Blanco-Bercial & I. Prusova in J. Nat. Hist., 2017, 51 (13-14). [p.821, Fig. 8]. Female: a, P1 coxa, basis and endopod; b, P1 exopod; c, P2 (anterior surface); d, P3 (posterior surface); e, P4 (posterior surface); f, P5 (anterior surface). Scale bar = 0.1 mm. Nota: P5 extends beyo,d posterior border of caudal rami, with outer distal corner of endopodal segment 1 pointed; pore openi,gs on anterior surface at base of outer border spines.
|
 Issued from : J.M. Bradford-Grieve, L. Blanco-Bercial & I. Prusova in J. Nat. Hist., 2017, 51 (13-14). [p.820]. Female: Armature formula of the swimming legs P1 to P5. Roman numerals = spines, Arabic numerals = setae; outer border setation listed to the left in each group separated by '';''
|
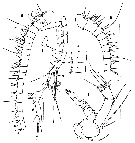
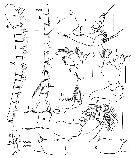
 Issued from : J.M. Bradford-Grieve, L. Blanco-Bercial & I. Prusova in J. Nat. Hist., 2017, 51 (13-14). [p.822, Fig. 9]. Male: a-b, habitus (dorsal and lateral, respectively); c, A1; d, forehead (lateral); e, left caudal ramus (dorsal); f, P5 (posterior view; R = right leg, L = left leg); g, left leg P5 exopod segment 3. Scales: 1.0 mm (a-d); 0.1 mm (e--g). Nota: - Rostrum extends into 2 long, ventroposteriorly directed, tapering filaments that extend as far as labrum. - Cephalic dorsal hump anterior border at about 1/3 the length of cephalosome. - Urosome 5 free somites. - Genital somite short. - Urosomite 2 as long as wide. - Caudal rami extend laterally; seta I absent, setae II and III lateral, setae IV and V terminal (seta V longest), seta VI on inner border, seta VII inserted at inner distal corner. - A1 22-segmented, extends as far as caudal rami, symmetrical, with ancestral segments I-IV, V-VI, XXVII-XXVIII fused, IX-X partly fused on ventral surface, X-XI partly fused on posterodorsal surface. Aesthetascs larger than in female, doubled on segments III, V, VII, IX, XI. Most setae of modified (ms) type or aesthetascs (a); long setae on ancestral segments V, XXV, XXVI are of a 'pseudoannnulate' type (pa) (see Weatherby & al., 1994). The distal-most, non aesthetasc setae of segments X and XI foreshortened and clavate, resoectively (fig.10 d). - P1 to P4 as in female. - P5 asymmetrical. Left leg longest, extends beyond caudal rami; coxa and basis longer than those of right leg: when P5 extended straight, border between exopodal segments 2 and 3 distal to distal border of right leg exopodal segment 2; exopodal segment 2 length/width (C'/c') = 2.55; length of terminal spine of exopodal segment 3 relative to length of its segment ( A\"/B\") = 0.81; exopodal segment 3 length/width (F-b\") = 2.50; exopodal segment 3 with 5 patches of fine setules on anterior surface. Right leg endopod extends slightly short of distal border of exopodal segment 2 (C+D)/E = 1.11; length of exopodal segment 3 relative to terminal spine (B/A) = 1.60. See Table 4 for variability in the proportions of the male P5..
|
 Issued from : J.M. Bradford-Grieve, L. Blanco-Bercial & I. Prusova in J. Nat. Hist., 2017, 51 (13-14). [p.823, Fig. 10]. Male: &, A1 (ancestral segments I-XVII; b, A1 (ancestral segments XVIII-XXVIII); c, A1 (ancestral segments XXVII-)XXVIII, setal numbers refer to numbering system of Weatherby & al., 1994); d, A1 (ancestral segments XX and XI); e, A2; f, Md; g, Mx1; h, Mx2; i, Mxp; J-k, syncoxae from Benguela Current. Scale bars = 0.1 mm. Nota: A1 with ancestral segments I-IV, V-VI, XXVII-XXVIII fused, IX-X partly fused on ventral surface, X-XI partly fused on posterodorsal surface. Aesthetascs larger than in female, doubled on segments III, V, VII, IX, XI. Most setae of modified (ms) type or aesthetascs (a); long setae on ancestral segments V, XXV, XXVI are of a 'pseudoannnulate' type (pa) (see Weatherby & al., 1994). The distal-most, non aesthetasc setae of segments X and XI foreshortened and clavate, resoectively (fig.10 d). The proximal seta of ancestral segment III differs from other short mixed modality setae of most segments in that it is longer and with bluntly terminating tip. - A2, Md, Mx1, Mx2 and Mxp sexually dimorphic with reduced setation. - A2 exopod slightly longer than endopod; endopod 2-segmented - Md coxal gnathobase very reduced with teeth scarcely developed; basis with 1 medium inner seta plus 1 vestigial seta and small process; endopod 2-segmented, segment 1 with inner lobe and 2 distal inner setae, segment 2 with 8 terminal setae; exopod 5-segmented with 1, 1, 1, 1, 2 setae, respectively. - Mx1 praecoxal arthrite reduced with about 6 vestigial spines; coxal endite with 2 or 3 vestigial terminal setae, epipodite with 7 long setae; basal endite 1 with 3 or 4 reduced setae, basal sendite 2 with 4 reduced setae; exite withoit seta; basis and endopod separate; endopod 3-segmented, with 3, 3, 7 reduced setae; exopod with 10 + 1 vestogial setae.
|
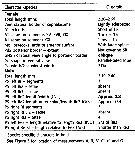
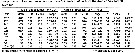 Issued from : J.M. Bradford-Grieve, L. Blanco-Bercial & I. Prusova in J. Nat. Hist., 2017, 51 (13-14). [p.825, Table 4]. Proportions of key features of P5 male of Calanoides natalis from the Arabian Sea and off Namibia. Setal formula: Left leg: Coxa 0-0. Basis 1-0. Exopod I-0; I-0; II, 1, 0. Endopod 0-0; 0-0; 0,I,0. Right leg: Coxa 0-0. Basis 1-0. Exopod I-0; I,1; II, 1,0.Endopod 0-0; 0-0; 0, 2,2. (Roman numerals = spines, Arabic numerals = setae; outer border setation listed to the left in each group separate by ';' Nota: The authors note that among specimens from a single locationh there is a large degree of variability in the proportions of the male P5.
|
 Issued from : J.M. Bradford-Grieve, L. Blanco-Bercial & I. Prusova in J. Nat. Hist., 2017, 51 (13-14) [p.828, Table 5]. Character states distinguished known of Calanoides. A1 = antennule, a = aesthetasc; approx. = approximately; CR = caudal rami; Gns = genital double-somite; Go = genital operculum; ms = modified seta; Pd5 = pedigerous somite 5; P5 = fifth leg; Re = exopod; Ri = endopod; SR = seminal receptacle; St = terminal spine.
|
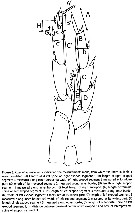 Issued from : J.M. Bradford-Grieve, L. Blanco-Bercial & I. Prusova in J. Nat. Hist., 2017, 51 (13-14) [p.812, Fig. 3]. Calanoides male P5 indicating the measurements made, from which the ratios in Table 4 and 5 were calculated.
|
 Issued from : J.M. Bradford-Grieve, L. Blanco-Bercial & I. Prusova in J. Nat. Hist., 2017, 51 (13-14) [p.827, Fig. 12]. Charactristic to discriminate between females of C. natalis, C. carinatus and C. brevicornis.
|
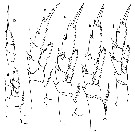
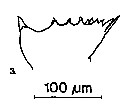 issued from : S.B. Schnack in Crustacean Issue, 1989, 6. [p.143, Fig.6: 3]. 3, As Calanoides carinatus (from off NW Africa, upwelling region): Cutting edge of Md.
|
 issued from : S.B. Schnack in Crustacean Issue, 1989, 6. [p.144, Fig.7: 4]. 4, As Calanoides carinatus (from off NW Africa, upwelling region): Cutting edge of Md.
|
 issued from : S.B. Schnack in Crustacean Issue, 1989, 6. [p.146, Fig.8]. As Calanoides carinatus. Schematic diagram of Mx2. Distance between setae and length of setule not considerd. (Herbivore mode)) Nota: The intersetule spacing on the Mx2 may be used as an index for the feeding habit. Compare with Mx2 of the omnivore Centropages chierchiae.
|
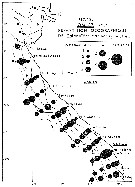
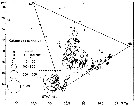
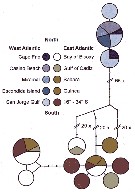 Issued from : M.D. Viñas, L. Blanco-Bercial, A. Bucklin, H. Verheye, J.G.F. Bersano & S. Ceballos in J. Exp. Mar. Biol. Ecol., 2015, 468. [p.101, Fig.2]. TCS Network diagram showing frequencies, relationships and source locations for the 12 haplotypes observed for Calanoides carinatus s.l. The size of the pie indicates relative frequency; color of the slice indicates the collection area (see also Fig.1); samples in legend are ordereds from North to South. Due to the low number of individuals, the SE Atlantic samples from 16° to 34°S (Benguela Current) were pooled. Nota: C. carinatus s.l. collected at 13 sampling locations was analysed (Table 1: localities, , date, number of individuals, sequence identification and GenBank). The TCS network diagram indicated complete isolation between the SW and NE/SE Atlantic populations, with no shared haplotypes between them. In addition, TCS analysis indicated no differentiation between NE and SE populations, with 2 groups of haplotypes found in both regions. Several individuals from the NE Atlantic, at the northern edge of the species distribution, showed very divergent haplotypes. C. carinatus s.s. (SW Atlantic) and C. carinatus s.l. (NE/SE Atlantic) are clearly genetically differentiated from both C. macrocarinatus and C. acutus. Accirdingly, Sabatini & al. (2007) found morphological differences between specimens of C. carinatus s.s. and C. macrocarinatus from new Zealand and concluded that they were different species. They also found that both species may be distinguished from C. acutus by several morphological characters of the female and male.
|
 Issued from : F. Höring in Master Thesis, Alfred Wegener Inst., Universität Bremen (Germany). [p.16, Fig.6] Haplotype network of COI data. Circles present the haplotypes which are connected by mutational steps (blue points). The size of the circle corresponds to the number of individuals that share the same haplotype. The pie charts represent the proportion of origin of the individuals.
|
 Issued from : F. Höring in Master Thesis, Alfred Wegener Inst., Universität Bremen (Germany), 2014. [p.34, Fig.16] Haplotype network of the 484 bp COI fragment. Combined data set of this study and available sequences on GenBank.
|
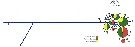
 Issued from : F. Höring in Master Thesis, Alfred Wegener Inst., Universität Bremen (Germany), 2014. [p.8, Fig.4] Stations map for samples of Calanoides natalis from the southwest African coast, the northern and southern Benguela upwelling systems, off Senegal/Mauritania to southwest Spain. The aim of this research is the study of potentiel cryptic species, the spatial patterns in the distribution of genetic variance and identify potential barrriers to gene flow. Analysis of motochondrial (cytochrome c oxydase subunit I; COI) and nuclear (citrate synthase; CS) marker genes revealed a genetically cohesive populayion of C. natais) with a prevalent shift in allele frequencies.
Genetic differenciation between the northern and southern hemisphere was significant, which may point to a potential, but permeable barrier close to the equator.
The genetic analysis shows that horizontal differentiation was more pronounced than vertical structuring..
Retention mechanisms and the oxygen minimum zone did not have a strong impact on genetic differentiation of C. natalis in the Benguela region.
|
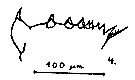
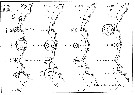
 Issued from : G.S. Brady in Ann. Durban Mus., 1914, Vol. I. [Pl. I, figs. 6-9]. Male (from Durban Bay, Natal): 6, habitus (from right side); 7, Abdomen; 8, A2 female; 6, Md female; 10, P5 male (right side); 11, P5 male (left side). Nota female: - Cephalothorax distinctly separated, and much stouter than the posterior abdominal portion, rounded off in front. - Forehead bearing a pair of slender, curved, tentacular processes; - Abdomen 4-segmented. - Caudal stylets short, scarcely longer than the last abdominal segment, bearing 5 apical setae. - A1 24-segmented, sparingly setiferous, reaching beyond the distal end of the abdomen. - Branches of A2 nearly equal in size; inner branch 2-segmenred, outer indistinctly 4 or 5-segmented. - Md of the usual calanoidd type. All the swimming legs biramose, the branches 3-segmented. Nota male: - Abdomen very slender, 5-segmented. - Biting plate of Md entirely wanting. - P1 to P4 as in female. - P5 very slender and prehensile, destitute of lateral setae; inner branch of the foot of the right side reduced to a very minute ovate, 1-segmented process, outer branch slender, flexile, 3-segmented, its last segment much the shortest; inner branch of the left foot 3-segmented, much reduced in size, reaching only to the middle of the 2nd segment of the outer branch.
| | | | | Compl. Ref.: | | | Bode & al., 2018 (p.840, Table 1, respiration & ingestion rates, depth); Bode & al., 2018 (p.66, fig.5, vertical distribution %, Rem); Bode-Dalby & al., 2026 (p.6-14, figs and tables)
| | | | NZ: | 4 + 1 doubtful | | |
|
Distribution map of Calanoides natalis by geographical zones
|
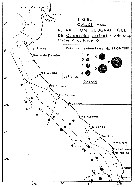
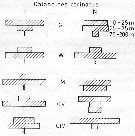
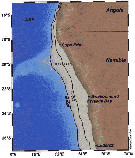
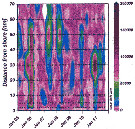
| | | | | | | | |  issued from : C. Courties in Thèse Univ. Bordeaux I., 1978. [Fig.13]. As Calanoides carinatus. issued from : C. Courties in Thèse Univ. Bordeaux I., 1978. [Fig.13]. As Calanoides carinatus.
Seasonal abundance along Congo and Gabon coast during cold season (August).
Number/20 cubic meters after cotation from Frontier (1969): 1 = 1-3 individuals; 2 = 4-17; 3 = 18-80; 4= 80-350; 5 = 350-1500; 6 = 1500-6500; 7 = 6500-30000.
Mesh aperture of the net: 0.330 mm.
Nota:The author pointsto a demographic bloom during the cold season.
Probably = Calanoides natalis. |
 issued from : C. Courties in Thèse Univ. Bordeaux I., 1978. [Fig.8]. As Calanoides carinatus issued from : C. Courties in Thèse Univ. Bordeaux I., 1978. [Fig.8]. As Calanoides carinatus
Seasonal abundance along Congo and Gabon coast during warm season (March).
Number/20 cubic meters after cotation from Frontier (1969): 1 = 1-3 individuals; 2 = 4-17; 3 = 18-80; 4= 80-350; 5 = 350-1500; 6 = 1500-6500; 7 = 6500-30000.
Mesh aperture of the net: 0.330 mm.
Probably = Calanoides natalis |
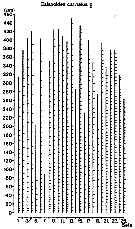
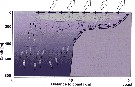
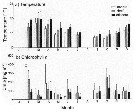
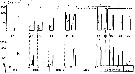 Issued from : C. Courties in Thèse 3ème Cycle, N°1432, Univ. Bordeaux I, juin 1978. [Fig.38]. As Calanoides carinatus. Issued from : C. Courties in Thèse 3ème Cycle, N°1432, Univ. Bordeaux I, juin 1978. [Fig.38]. As Calanoides carinatus.
Seasonal variations of abundance. Number of generations from 1 to 6. at two stations a (120 milles) and b (160 milles) during the colder season 1974 off Pointe Noire (Congo)
Sampling by WP2 (mesh aperture 200 µm).
Station ''a'': 22°5 C and 35.86 p.1000 at 10 m; 18°6 C and 35.88 p.1000 at 30 m. Station ''b'': 22°9 C and 35.88 p.1000 at 10 m; 18°.8 C and 35.88 p.1000 at 30 m.
Histograms indicate the cephalothoracic measures.
Nota: During the colder season friom 1974 C. carinatus show 6 generations.
Probably Calanoides natalis |
 Issued from : C. Courties in Thèse 3ème Cycle, N°1432, Univ. Bordeaux I, juin 1978. [Fig.45]. As Calanoides natalisBiological cycle. Issued from : C. Courties in Thèse 3ème Cycle, N°1432, Univ. Bordeaux I, juin 1978. [Fig.45]. As Calanoides natalisBiological cycle.
Pronably = Calanoides natalis. |
 issued from : J.-P. Ehrhardt in Cah. Oceanogr., 1967 (9). [Fig.10]. issued from : J.-P. Ehrhardt in Cah. Oceanogr., 1967 (9). [Fig.10].
Occurrence of Calanoides carinatus (= C. natalis collected at 14 stations on 39 stations between the southern Tyrrhenian Sea, Tunisia-Sardinia Strait and Cap Bon-west Sicily.
Nota: The species represents 0.3 % of adult copepods in the waters from salinity between 37.3 and 37.8 p.1000 (more frequently between 37.59-37.72), and between 4.35-5.93 cm3/l oxygen (more frequently between 4.69-5.50 cm3/l), probably under influence of the atlantic superficial water current.
Probably C.alanoides natalis |
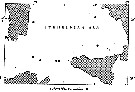
 issued from : R. Stephen in Pelagic Biogeography ICoPB II. Proc. 2nd Int. Conf. Final report of SCOR/IOC working group 93. 9-14 July 1995. Workshop Rep. No.142. UNESCO, 1998. issued from : R. Stephen in Pelagic Biogeography ICoPB II. Proc. 2nd Int. Conf. Final report of SCOR/IOC working group 93. 9-14 July 1995. Workshop Rep. No.142. UNESCO, 1998.
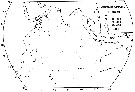
P.343, Fig.7: Distribution of Calanoides carinatus (= Calanoides natalis) in the Indian Ocean.
Perhaps other species in the eastern part of the Indian Ocean. [CR] |
 issued from : U. Brenning in Wiss. Z. Wilhelm-Pieck-Univ. Rostock - 30. Jahrgang 1981. Mat.-nat. wiss. Reihe, 4/5. [p.6, Fig.8]. As Calanoides natalis. issued from : U. Brenning in Wiss. Z. Wilhelm-Pieck-Univ. Rostock - 30. Jahrgang 1981. Mat.-nat. wiss. Reihe, 4/5. [p.6, Fig.8]. As Calanoides natalis.
Spatial distribution for Calanoides carinatus from 8° S - 26° N; 16°- 20° E, for different expeditions (V1: Dec. 1972-Jan. 1973; V2: Feb./Mar. 1973; IV: Jun.-Jul. 1972; VI: May 1974.
Legend of circles in T-S diagram.
Nota: Taking into account the seasonal temperature variations, the number of generations to be expected in a given region when the duration of upwelling in the region concerned is known, we have: 7-8 generations at Nouachott (Mauritania), 5-6 at Cap Vert (Dakar) and 3 at Cap Roxo (Casamance).
Probably = Calanoides natalis. |
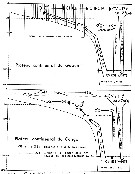
 issued from : U. Brenning in Wiss. Z. Wilhelm-Pieck-Univ. Rostock - 30. Jahrgang 1981. Mat.-nat. wiss. Reihe, 4/5. [p.7, Fig.9]. issued from : U. Brenning in Wiss. Z. Wilhelm-Pieck-Univ. Rostock - 30. Jahrgang 1981. Mat.-nat. wiss. Reihe, 4/5. [p.7, Fig.9].
T-S Diagram for Calanoides carinatus (= Calanoides natalis (all copepodid stages) from 8° S - 26° N; 16°- 20° E, and Namibia (SW Africa) for different expeditions (V1: Dec. 1972-Jan. 1973; V2: Feb./Mar. 1973; IV: Jun.-Jul. 1972; VI: May 1974; VIII: 21 Sept.-17 Dec. 1976).
SO: Southern Surface Water (S °/oo: 34,50; T°C: 29,0); ND: Northern Water of the Surface Layer (S °/oo: 37,5; T°C: 21,0); SD: Southern Deep Water of the surface layer (S °/oo: 35,33; T°C: 13,4).
Water types basing on the works of Sverdrup & al. (1942), Wolf (1978) and Wolf & Kaiser (1978) distinguishing various quasi-permanent water types in the top 200 m of the water column in the NW Africa upwelling region. The water type SD, which usually forms the upper limit of the SACW (South Atlantic Central water: S °/oo: 34,35-35,33 & T°C: 5,15-13,4), can enter the surface layer as a result of upwelling, so that water types ND, SD and SO can be expected in this layer in upwelling regions. The boundary separating the NACW (North Atlantic Central Water: S °/oo: 35,10-37,35; T°C: 8,0-21,0) and SACW water masses is situated in the region between Bahia de Gorrei and Cap Blanc (Mauritania) throughout the whole year. The distribution of the water types SACW in the surface layer off North West Africa varies with the season and the meridional migration of the wind field. See in Brenning (1985 a, p.6).
Probally = Calanoides natalis. |
 issued from : U. Brenning in Wiss. Z. Wilhelm-Pieck-Univ. Rostock - 30. Jahrgang 1981. Mat.-nat. wiss. Reihe, 4/5. [p.8, Fig.10, f-g]. issued from : U. Brenning in Wiss. Z. Wilhelm-Pieck-Univ. Rostock - 30. Jahrgang 1981. Mat.-nat. wiss. Reihe, 4/5. [p.8, Fig.10, f-g].
T-S Diagram for Calanoides carinatus (= Calanoides natalis) females and males.
Probably = Calanoides natalis. |
 issued from : U. Brenning in Wiss. Z. Wilhelm-Pieck-Univ. Rostock - 30. Jahrgang 1981. Mat.-nat. wiss. Reihe, 4/5. [p.9, Fig.11]. issued from : U. Brenning in Wiss. Z. Wilhelm-Pieck-Univ. Rostock - 30. Jahrgang 1981. Mat.-nat. wiss. Reihe, 4/5. [p.9, Fig.11].
Vertical distribution for Calanoides carinatus (= Calanoides natalis) from 8° S - 26° N; 16°- 20° E.
T: daylight; N; night; G: all copepodis stages; W; females; M; males.
Probably = C.alanoides natalis. |
 Issued from : F. Höring in Master Thesis, Alfred Wegener Inst., Universität Bremen (Germany). [p.5, Fig.3] Issued from : F. Höring in Master Thesis, Alfred Wegener Inst., Universität Bremen (Germany). [p.5, Fig.3]
Life cycle of Calanoides carinatus (= C. natalis) associated to the upwelling system (drawing after H Auel).
After Bradfoed-Grieve & al. (2017, p.803) C. natalis is known as an 'upwelling specialist' (Ceballos & al., 2004). Peterson (1998) considers such species to be pre-adapted to wind-driven upwelling situations where water circulation ensures that surface water is taken off shore, that deeper water drifts onshore, whereas, over the continental shelf, the drift is usually equatorward at the surface a,d polewards over the continental slope. Peterson (1998) summarizes the reasons why species such as C. natalis are able to maintain their position in an upwelling region through differing behaviour at different life stages. That is, diapause stage copepodids (CV) are carried at depth (> 200 m) polewards and, during upwelling, are carried inshore onto the continental shelf. When CV reach productive surface waters they exit dapause, mature males and females mate, and eggs are laid. The developing nauplii and copepodid stages remain within surface waters, drifting further offshore as they develop and equatorward as they mature to CV. If upwelling continues, CV stages, by migrating deeper in the water column, are again carried shoreward and may undergo several generations depending on the length of the upwelling season. The timing of this cycle differs depending on geographic region, the timing of the upwelling season and its length. |
 Issued from : M. Bode, R. Koppelmann, L. Teuber, W. Hagen & H. Auel inGlobal Biogeochemical Cycles, 2018, 32. [p.844, Table 1). Issued from : M. Bode, R. Koppelmann, L. Teuber, W. Hagen & H. Auel inGlobal Biogeochemical Cycles, 2018, 32. [p.844, Table 1).
Calanoides natalis copepodite V from the Eastern Atlantic Ocean between 24°N and 21°S (see map fig. 2) : Body mass (DM), respiration rates, ingestion rates, sampling depth of occurrence and experimental temperature (T°C) .
Nota: << Metabolic rates are correlated with body mass, habitat temperature and the general activity level (Bode & & al., 2013; Ikeda & al., 2001).
DM were calculated from individuals median total length.: Ln DM = 2.74 x ln TL- 16.41.
A regression model was applied after Bode & al. (2013). The equation is applied, where R is the individual respiration rate for a fast-moving copepod (Rf), DM in mg and T temperature at mid depth of the sampling interval in °C :
ln Rf (µl O2 ind-1 hr-1 = -0.890 + 0.646 ln (DM) + 0.094 (r2 = 0.53).
Conversion to the copepod's minimum food requirements (Ikeda & al., 2001) were excluded from ingestion estimates because the diapausing stage of yhe copepodite V, using internal lipid reserves.
Minimum food requirements : In situ respiration rates (R = µl O2 ind -1 day-1 of copepod species were converted to carbon units (µg C ind-1 day-1 assuming that 1 ml O2 equals 0.44 mg of organic carbon with a respiration quotient (RQ) of 0.82 for a mixed diet (Gnaiger, 1983; Winberg, 1956).
Ingestion ( I ) and egestion (E) rates (µg C ind-1 day-1 were calculated according to Ikeda & Motoda (1978) assuming an average digestive efficiency of 70% (U = 0.7) and a gross growth efficiency of 30% (K1 = 0.3) in marine zoopplankton, regardless of species and food availability :
I = (R x C x RQ x 1/ U-K1.
E = 0.3 x I
Where C equals carbon mass per mole volume (12 g C per 22.4 L). I and E were calculated per day converted to total community requirement of copepods at each station and depth interval.
The particulate organic carbon (POC) flux to each sampling layer was calculated using the primary production (PP) values for each station applying the equation (Suess, 1980):
Cflux = Cprod / 0.0238Z + 0.212 where Cflux is the POCflux (mg m-2 day-1 at depth Z, Cprod is the PP (mg C m-2 day-1, and Z is the water depth (≥ 50 m), PP equals the average depth -integrated carbon uptake rate at each station (see figure 5a in Fonseca-Batista & al., 2017).
To quantify the impact of copepod ingestion and egestion on the vertical carbon flux, a box model similar to that of Sasaki & al. (1988) and Yamaguchi & al. (2002) was applied. (See Fig. 1: Scheme of the carbon budget within a depth layer). >> |
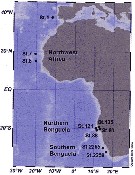
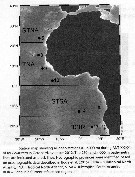 Issued from : M. Bode, R. Koppelmann, L. Teuber, W. Hagen & H. Auel inGlobal Biogeochemical Cycles, 2018, 32. [p.846, Fig.2). Issued from : M. Bode, R. Koppelmann, L. Teuber, W. Hagen & H. Auel inGlobal Biogeochemical Cycles, 2018, 32. [p.846, Fig.2).
Station map during ANT-XXIX/1 of RV Polarstern Expedition in October/November 2012, in the Eastern Atlantic Ocean (between 24°N and 21°S).
Nota: << Detailed hydrographic data sets down to 200 and 2000 m (Bode & al., 2015; 2018) and Chla distributions (Bode & al., 2015).Station 5 (23°7N) was located in the subtropical North Atlantic (STNA) with high sea surface salinity (SSS) of 36.6 and high sea surface temperature (SST) of 25°C. According to the fluorescence signal, Chla concentration was low, and the primary production was lowest (445 mg C m-2 day-1) compared to the other stations. Stations 8, 9 and 10 (15°N-2°N) were situated in the tropical North Atlantic (TNA). These stations were characterized by the highest SST ranging from 27°C at station 10 to 29°C at station 9 and relatively low SSS of 35.6 (stn.8 and 10) and 35.0 (stn.9). The primary production was relatively high with 650 mg C m-2 day-1 at station 8, 563 mg C m-2 day-1 at station 9, and 907 mg C m-2 day-1 at station 10; Station 14 (14°S) was located in the subtropical South Atlantic (STSA) in direct vicinity ofd the Angola Gyre with lower SST (21°C) but higher SSS of 36.5 compared to the TNA. The intermediate Chla maximum was located between 50 and 100 m, while the primary production was moderately high with 665 mg m-2 day-1. Station 17 (21°S) was situated in the Benguela Current influenced region (BCIR) and characterized by relatively low SST (18°.5°C) and low SSS (35.6) There was only weak stratification by temperature or salinity down 150 m depth. Chla concentration were highest in this region, as was the primary production with 930 mg C m-2 day-1.
Total copepod community (with a Hydrobios Multinet, mesh aperture 150 µm) consumption integrated over the entire 0-2000 m water column varied from 202 mg C m-2 day-1 at station 14 to 604 mg C m-2 day-1 at station 8, potentially ingesting 30-93% of the carbon produced by the primary production.
Highest ingestion rates of calanoid communities integrated from 0-2000 m were found in the TNA (323-541 mg C m-2 day-1, 45-83% of the primary production), consumption was intermediate in the BCIR (301 mg C m-2 day-1, 32% of the primary production) and lowest in the STNA (266 mg C m-2 day-1, 60% of the primary production) and STSA (151 mg C m-2, 23% of the primary production).
The total net loss of particulate organic carbon (POC) by copepods, defined as gross consumption minus fecal pellet egestion integrated from 0 to 2000, varied from 142 mg C m-2 day-1 in the STSA to 423 mg C m-2 day-1 in the TNA.
The relative impact of net copepod ingestion (= consumption - egestion) on the primary production (PP) was highest in the TNA (37-65% PP) and in the STNA (50% PP) and lowest in the BCIR (28% PP). Of these, 16-58% of PP could be attributed to calanoid copepods and 5-9% of PP to cyclopoids .
A total of 28 calanoid copepods species were studied: DM-specific (calculated from median total length) respiration rates ranged from 0.3 µl O2 mg DM-1 hr-1 for deep-dwelling females of Rhincalanus cornutus and CV of Gaetanus brevicornis and Pareucalanus spp. to 16 µl O2 mgDM-1 hr-1 for epipelagic Undinula vulgaris. Large differences in adjusted metabolic rates (AMRs; 15°C and 0.7 mg DM) were determined between species. All eucalanid species, diapausing CV of Calanoides natalis, and females of Paraeuchaeta aequatorialis and Metridia princeps had lowest mean AMRs between 0.5 and 0.8 µl O2 mg DM-1 hr-1.
Typical mesopelagic species such as Scottocalanus securifrons, Chirundina stretsii, Euchirella pulchra, E. splendens, E. curticauda, Gaetanus pileatus, G. kruppii, Megacalanus princeps showed generally low AMRs of 1-2 µl O2 mgDM-1 hr-1.
Highest mean AMRs of > 4 µl O2 mg DM-1 hr-1 were measurd for epipelagic Undinula vulgaris, Candacia pachydactyla, C. ethiopica, Euchaeta marina.
Only males of C. ethiopica and U. vulgaris showed significantly lower respiration rates than females.
Epipelagic Euchirella splendens and Euchaeta marina exhibited significantly higher AMRs than specimens collected at mesopelagic depths.
Individual in situ oxygen consuoption rates were converted to carbon units approximating minimum food requirements and thus potential ingestion for each species and community.
Individual carbon demands were 0.7 and 0.9 µg C ind-1 day-1 for CV and females of Rhincalanus cornutus, respectively and 1.1 mg C ind-1 day-1 for diapausing CV of Calanoides natalis.
Highest carbon fdemands of > 20 µg C ind-1 day-1 were measured in the upper 100 m for Euchirella splendens, Undinula vulgaris, Candacia pachydactyla, Euchaeta marina, Pleuromamma xiphias, Neocalanus robustior. Euchirella splendens collected in the upper 100 m showed a maximum mean daily ingestion rate of 115 µg ind-1 day-1, while females of Undinella vulgaris, Candacia pachydactyla, Euchaeta marina from the epipelagic zone ingested on average 70-75 µg C ind-1 day-1.
Minimum daily ingestion rates of < 10 µg C ind-1 day-1 were determined for deep-dwelling females of Euchirella pulchra, Candacia curticauda, Eucalanus hyalinus, Rhincalanus nasutus, Pareucalanus spp., and copepodids of Gaetanus pileatus, G. brevicornis, with minima of 1.7 and 2.3 µg C ind-1 day-1 for CV and females, respectively, of Rhincalanus cornutus. >> |
 Issued from : M. Bode, R. Koppelmann, L. Teuber, W. Hagen & H. Auel inGlobal Biogeochemical Cycles, 2018, 32. [p.845, Fig.1). Issued from : M. Bode, R. Koppelmann, L. Teuber, W. Hagen & H. Auel inGlobal Biogeochemical Cycles, 2018, 32. [p.845, Fig.1).
Scheme of the carbon budget within a depth layer.
To quantify the impact of copepod ingestion and egestion on the vertical carbon flux, a box model similar to that of Sasaki & al. (1988) and Yamaguchi & al. (2002) was applied.
The authors assumed: << (1) incoming particulate organic carbon (POCin) id the available POC by primary production (PP) measured for the top layer or the sedimented POC for lower layers estimated according to the Suess (1980; (2) the amount of organic carbon lost within a depth layer (L = POCin - POCout is either consumed by calanoid copepods (Ical derived from respiration measurements), or is available for others inhabiting this depth layer, either by direct consumption or after disaggregation as suspended POC (O = L - Lcal - Lcyc + Ecal + Ecyc); (3) the assimilation efficiency of copepods (70%) was assumed to be constant throughout the water column; (4) the carbon egested by copepods (E = 0.3 x I) within a layer potentially contributes to the outgoing POC (POCout) into the depth layer below. (5) residual POC (POCrest = POCout - E) may aggregating POC not ingested, thus directly sinking, or POC egested by other consumers inhabiting the respective depth layer; (6) the carbon respired by copepods (R) is lost as dissolved inorganic carbon in the respective depth layer.
The particulate organic carbon (POC) flux to each sampling layer was calculated using the primary production (PP) values for each station applying the Suess' equation (1980) :flux = Cprod/(0.0238 Z + 0.212)
Where Cflux is the POC flux (mg m-2 day-1 at depth Z, Cprod is the PP (mg C m-2 day-1, and Z is the water depth (≥ 50 m). PP equals the average depth-integrated carbon uptake rate at each station (see Fonseca-Batista & al., 2017: Fig.5a). >> |
 Issued from : M. Bode, R. Koppelmann, L. Teuber, W. Hagen & H. Auel inGlobal Biogeochemical Cycles, 2018, 32. [p.847, Fig.3). Issued from : M. Bode, R. Koppelmann, L. Teuber, W. Hagen & H. Auel inGlobal Biogeochemical Cycles, 2018, 32. [p.847, Fig.3).
Net loss of particulate organic carbon (POC) via copepod ingestion (= total net copepod ingestion) at each station from 0 to 2000 m given in total numbers (mg C m-2 day-1 and in relation to primary production in the Eastern Atlantic Ocean (October/November 2012).
Nota: << Variability of copepod feeding impact on incoming POC (POCin) was most pronounced in the epipelagic and mesopelagic zone (13-69% POCin, whereas in bathypelagic layers, impacts of copepods were more uniform ranging from 11 to 22% net loss of incoming POCflux.
In the epipelagic zone, the greatest relative impact of net copepod ingestion of Primary Production and potential contribution of copepod egestion to POCout was found in the TNA (mean 44%PP and 93% POCout resp.). This was in contrast to the northern- and southernmost stations 5 and 17 (see map), where the largest impact of net copepod ingestion on incoming and copepod egestion on outgoing POC was determined in the mesopelagivc zone with 69% POCin and 141% POCout respectively.
In the upper 200 m, the net loss rate of POC by calanoids was highest in the TNA with 200-351 mg C m-2 day-1 (29-54% PP), while lowest rates were found in the BCIR and STSA with 92 and 86 mg C m-2 day-1 (10 and 13% of PP, respectively)
The net loss by calanoids in the mesopelagic zone was 19-25 mg C m-2 day-1 in the TNA and STA (12-22% POCin, 47 mg C m-2 day-1in, and 116 mg m-2 day-1 in the BCIR (62% POCin. In contrast, net loss mediated by cyclopoids was lower and uniform ranging from 20 to 33 mg C m-2 day-1, that is, 3-6% PP in the epipelagic and 211-15 mg C m-2 day-1(6-17% POCin in the mesopelagic zone.
In the bathypelagic zone, net loss of POC by calanoid ingestion was rather stable varying from 1.8 to 3.2 mg C m-2 day-1 (6-16% POCin, while cyclopoids accounted for 1.1-2.0 mg m-2 day-1 (5-8% POCin) of t§he net loss at these depth zones. >> |
 Issued from :M. Bode, W. Hagen, A. Schukat, L. Teuber, D. Fonseca-Batista, F. Dehairs & H. Auel in Prog. Oceanogr., 2015, 138. [p.271, Fig.2]. Issued from :M. Bode, W. Hagen, A. Schukat, L. Teuber, D. Fonseca-Batista, F. Dehairs & H. Auel in Prog. Oceanogr., 2015, 138. [p.271, Fig.2].
(a) Sea surface temperature (SST) and surface salinity (SSS). (b) temperature; (c) salinity and (d) relative chlorophyll a values of the upper 200 m along the cruise track during ANT-XXIX/1 from 37°49'N to 20°59'S in October/November 2012.
The lines represent respective station numbers marked above as asterisks, stations in gray only contributed CTD data.
STNA = Subtropical North Atlantic, TNA = tropical North Atlantic, STSA = subtropical South Atlantic, BCIR = Benguela Current influenced region. |
 Issued from :M. Bode, W. Hagen, A. Schukat, L. Teuber, D. Fonseca-Batista, F. Dehairs & H. Auel in Prog. Oceanogr., 2015, 138. [p.273, Table 1]. Issued from :M. Bode, W. Hagen, A. Schukat, L. Teuber, D. Fonseca-Batista, F. Dehairs & H. Auel in Prog. Oceanogr., 2015, 138. [p.273, Table 1].
As Calanoides carinatus.
C and N isotopic ratio, C:N atom ratio and trophic level of calanoid copepod in the different regions (see map: STNA, TNA, STSA and BCIR).
Nota: << To assess trophic levels of different copepods within the food web, an isotopic baseline was established from particulate organic matter (POM) natural concentration and isotopic composition: δ15N-PN for particulate nitrogen and δ13C-POC for particulate organic carbon. Weighted averages of POM-δ15N (d15Nbase were determined for each station in the upper 100 m stratum, taking into account particulate nitrogen content and sampling depth. d15Nbase was defined as trophic level 1. The species-specific trophic level was calculated from station-specific d15Nbase as :
Trophic level = 1 + (d15Nconsumer - d15Nbase) / Dn
where Dn is the enrichment of d 15 N per trophic level, applying an enrichment factor of 3.4% (Minagawa & Wada, 1984; Vander Zanden & Rasmussen, 2001; Post, 2002). |
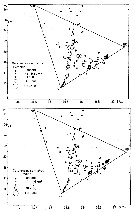
 Issued from : M. Bode, W. Hagen, A. Schukat, L. Teuber, D. Fonseca-Batista, F. Dehairs & H. Auel in Prog. Oceanogr., 2015, 138. [p.278, Fig.4]. Issued from : M. Bode, W. Hagen, A. Schukat, L. Teuber, D. Fonseca-Batista, F. Dehairs & H. Auel in Prog. Oceanogr., 2015, 138. [p.278, Fig.4].
As Calanoides carinatus (probably C. natalis).
Carnivory index and trophic level.
Cf. other species cited. |
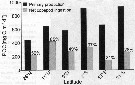
 Issued from : M. Bode, A. Schukat, W. Hagen & H. Auel in J. Exp. Mar. Biol. Ecol., 2013, 444. [p.3, Table 1]. Issued from : M. Bode, A. Schukat, W. Hagen & H. Auel in J. Exp. Mar. Biol. Ecol., 2013, 444. [p.3, Table 1].
As Calanoides carinatus (probably C. natalis).
Dry mass, individual respiration rate and ETS activity from the northern Benguela Current upwelling system along transects at 23°S and 26°40'S, off Walvisbay and Lüderitz (Namibia).
CV: 0.11 ± 0.03 µl O2 h-1 ind-1 (T = 8°C); 0.23 ± 0.11 (T = 13°C) in the Benguela upwelling region and northern Benguela, respectively; for Arashkevich & Drits (1997): 0.12 (T = 8°C) in the Benguela upwelling region; and for Kosobokova & al; (1988): 0.16 ± 0.10 (T = 14°C) in Northern Benguela; For Auel & al. (2005): 0.21 ±0.08 (156 µg) at 8°C in the Angola frontal zone and northern Benguela and female: 6.90 (118µg) at 22°C.
ETS activity were measured with Packard's method (1971), modified by Owens & King (1975). |
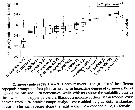
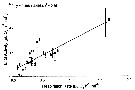 Issued from : M. Bode, A. Schukat, W. Hagen & H. Auel in J. Exp. Mar. Biol. Ecol., 2013, 444. [p.4, Fig.3]. Issued from : M. Bode, A. Schukat, W. Hagen & H. Auel in J. Exp. Mar. Biol. Ecol., 2013, 444. [p.4, Fig.3].
Relationship between individual ETS activities and individual respiration rates.
Mean ETS activities with standard deviations are plotted again mean respiration rates.
The letter besides each point identifies the associated species in Table 1 (j for this species, stage V) in the same authors.
The equation of the regression line is shown (p = 0.0001).
Cf. Table 1: Dry mass, individual respiration rate and ETS activity from the northern Benguela Current upwelling system along transects at 23°S and 26°40'S, off Walvisbay and Lüderitz (Namibia). |
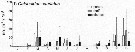 Issued from : M. Bode, A. Kreiner, A.K. van der Plas, D.C. Louw, R. Horaeb, H. Auel & W. Hagen in PLoS ONE, 2014, 9 (5). [p.5, Fig.4f]. As Calanoides carinatus (= Calanoides natalis) Issued from : M. Bode, A. Kreiner, A.K. van der Plas, D.C. Louw, R. Horaeb, H. Auel & W. Hagen in PLoS ONE, 2014, 9 (5). [p.5, Fig.4f]. As Calanoides carinatus (= Calanoides natalis)
Monthly means (±SD) of number of individuals (no) m-2 x 10³.
Copepods samples collected along transect at 20°S off Namibia starting in March 2005 (see map fig.1), using a WP2 net (200 µm mesh aperture) from 200 m (or less) to the surface from offshore to inshore.
See Fig.4 : correlation between temperature and chlorophyll a with the abundance spatial variations of the species by the same authors.) |
 Issued from : M. Bode, A. Kreiner, A.K. van der Plas, D.C. Louw, R. Horaeb, H. Auel & W. Hagen in PLoS ONE, 2014, 9 (5). [p.2, Fig.1]. Location of the monitoring transect at 20°S off Namibia and approximate position of the Angola Benguela Front (ABF). Issued from : M. Bode, A. Kreiner, A.K. van der Plas, D.C. Louw, R. Horaeb, H. Auel & W. Hagen in PLoS ONE, 2014, 9 (5). [p.2, Fig.1]. Location of the monitoring transect at 20°S off Namibia and approximate position of the Angola Benguela Front (ABF).
Zooplankton samples collected along transect at 20°S off Namibia in March 2005.
Nota: << The Benguela Current upwelling region, extending along the South West African coast from 17 to 34°S is one of the most productive marine ecosystems reaching an average annual primary production of about 400-900 g C m-2 yr-2. >>
Among the larger calanoid copepods, Calanoides carinatus (= C. natalis), Metridia lucens and Nannocalanus minor dominated. (See Fig.9). |
 Issued from : M. Bode, A. Kreiner, A.K. van der Plas, D.C. Louw, R. Horaeb, H. Auel & W. Hagen in PLoS ONE, 2014, 9 (5). [p.5, Fig.4 a, b]. Issued from : M. Bode, A. Kreiner, A.K. van der Plas, D.C. Louw, R. Horaeb, H. Auel & W. Hagen in PLoS ONE, 2014, 9 (5). [p.5, Fig.4 a, b].
Monthly means (±SD) of a) temperature at 10 m, and b) chlorophyll a.
Nota: << At 20°S transect, temperature and salinity showed a seasonal cycle with highest temperature in march and April and lowest in September/October.
In March/April, at 10 mdepth temperature ranged from 15° to 22°C;
Coastal upwelling generally started in May or June with temperatures dropping below 15°C.
From July to November temperatures were below 14°C, and coastal upwelling was strongest from September to November (<13°C).
Cold, upwelled water was characterized by low salinities between 35.0 and 35.3, while maximum temperature above 20°C were associated with salinities ≥ 35.7.
Temperature generally increased from inshore to offshore stations by 3-4°C; however, ther were substantial interannual variations in upwelling intensity and intrusions of tropical warm waters.
Extensive warm-water intrusions of the Angola Current in late summer and autumn occurred in the same years as strong upwelling in spring. Therefore, years could be characterized according to the temperature amplitude with either high or low temperature gradients between spring and autumn. >> |
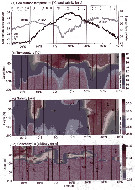
 Issued from : M. Bode, A. Kreiner, A.K. van der Plas, D.C. Louw, R. Horaeb, H. Auel & W. Hagen in PLoS ONE, 2014, 9 (5). [p.3, Fig.2]. Issued from : M. Bode, A. Kreiner, A.K. van der Plas, D.C. Louw, R. Horaeb, H. Auel & W. Hagen in PLoS ONE, 2014, 9 (5). [p.3, Fig.2].
Horizontal and distribution of the temperature, salinity, oxygen concentration at 10 m and mean chlorophyll a concentration in the upper 30 m along the monitoring line at 20°S, 12-14°E from March2005 until September 2011.
Nota: << The years 2005/06 and 2010/11 showed comparatively wide temperature amplitudes.
In contrast, 2008/09 showed a rather weak gradient, with less intense upwelling in July and September 2008 accompagned by weak warm-water intrusions in April 2009.
The years 2006/07, 2007/08 and 2009/10 cannot be clearly assigned to either of these categories.
Because due to technical failure the intensity of Angola Current intrusions in autumn 2007 is uncertain, but upwelling intensity was strong in spring 2006 and temperature were below average in September and November 2006. In contrast, the upwelling intensity in spring 2007 was not recorded reliably, but the intrusion of tropical water in autumn 2008 was weak. However, temperature in July 2007 were above average, whereas December 2007 and April 2008 were cold than usual.
Oxygen concentration was generally low within the first 10 nm on the shelf and the permanent oxygen minimum zone (OMZ) (< 1.4 ml L-1) was more pronounced during quiescent months due to intrusions of low-oxygen Angola Current waters. The OMZ was usually observed between 40 and 60 m water depth, but oxygen concentrations below 1.4 ml L-1 even occurred at 10 m depth at station 2 nm in March, September and November 2005, February 2007, April 2009 and November 2010.
Chlorophyll a concentration in the upper 30 m was usually lower during years 2005/06 and 2006/07, except for the peak value at stations 2 and 5 nm from shore in April 2006 of 540 mg Chla m-2.
From the year 2007/08 onwards maximum concentrations of > 200 mg Chl a m-2 were measured on the shelf in July 2007, April, May and July 2008, September 2009 throughout April 2010, September 2010 and March/April 2011. In contrast, such high concentrations were present in the offshore region only in December2007, September 2009 and April 2010.
In general, chlorophyll a concentration was higher in the inshore or shelf region compared to the offshore region, and showed highest monthly means in February and April (see in Fig.4, by the same authors). >> |
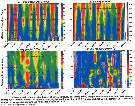
 Issued from : M. Bode, A. Kreiner, A.K. van der Plas, D.C. Louw, R. Horaeb, H. Auel & W. Hagen in PLoS ONE, 2014, 9 (5). [p.6, Fig.5 a, b, d, e]. As Calanoides carinatus (= Calanoides natalis). Issued from : M. Bode, A. Kreiner, A.K. van der Plas, D.C. Louw, R. Horaeb, H. Auel & W. Hagen in PLoS ONE, 2014, 9 (5). [p.6, Fig.5 a, b, d, e]. As Calanoides carinatus (= Calanoides natalis).
Log-transformed monthly anomalies between 2005 and 2011 of a) temperature at 10 m, b) chlorophyll a, d/ total copepods, and e) abundance of the species (no. m2.
Cf. map and figs. 1, 2, 4, from the same authors.
Compare with Metridia lucens and Nannocalanus minor from the same authors.
Nota: The majority of C. natalis was observed in patches between inshore and off shore (Cf. p.9, Fig.9 from the same authors). |
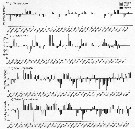
 Issued from : M. Bode, A. Kreiner, A.K. van der Plas, D.C. Louw, R. Horaeb, H. Auel & W. Hagen in PLoS ONE, 2014, 9 (5). [p.9, Fig.9, a]. As Calanoides carinatus (= Calanoides natalis). Issued from : M. Bode, A. Kreiner, A.K. van der Plas, D.C. Louw, R. Horaeb, H. Auel & W. Hagen in PLoS ONE, 2014, 9 (5). [p.9, Fig.9, a]. As Calanoides carinatus (= Calanoides natalis).
Monthly abundances (no. m-2 along transect from inshore (0 nm) to offshore (70 nm) (See map: p.2, Fig.1; nm: distances of stations expressed in nautical mile = 1852 m).
Note patches in the spatial distributions from inshore to offshore.
Compare with Metridia lucens, Nannocalanus minor, Rhincalanus nasutus from the same authors. |
| | | | Loc: | | | SW South Africa, Namibia, Senegal-Mauritania, SW Spain, ? W Medit.
Type locality: SW Indian (Durban Bay) | | | | N: | ? because confusion with Calanoides carinatus | | | | Lg.: | | | (1319) F: 2,2-2,6; M: 2,1-2,41; (1320) F: 2,55; M: ?; {F= 2,20-2,60; M: 2,10-2,41} | | | | Rem.: | Confounded by numerous authors with Calanoides carinatus before 2017.
After Brady (1914, p.4), Giesbrecht (1892) has figured the P5 male, a form which he identifies with Calanus brevicornis Lubbock, his figure agreeing very exactly with P5 male of Calanoides natalis; but this lomb is neither figured nor described by Lubbock, and C. brevicornis is in other respects quite unlike the African species here described. It is, possible that Giesbrecht's figure may apply to C. natalis , in which case the reference to C. brevicornis is certainly erroneous.
For Bradford-Grieve & al. (2017, p.827)Calanoides natalis females are distinguished morphologically from the western south Atlantic species Calanoides carinatus stricto sensu by the setation of ancestral antennular segments XV, XVII, XIX and XXI. C. natalis has the setation of all these segments with 1 ms + 1a, whereas in C. carinatus the setation is 2 ms + 1a (see in Table 5). In this respect C. natalis is the same as C. brevicornis (as macrocarinatus) (Bradford-Griece, 1994. It is confirmed that the anterior surface of the praecoxal arthrite of Mx1 of C. carinatus does not have a group of large spines, whereas such spines are present on C. natalis (Fig.7b) and C. brevicornis (as macrocarinatus (Vyshkvartzeva, 1977). In males, the difference between C. natalis and C. carinatus is in the left P5: C. natalis (from the Arabian Sea) had the ratio of the length of the outer distal spine of exopodal segment 2 relative to the length of the inner border of exopodal segment 3 (G/B) had a mean of 0.54 (range 0.47-0.67) (Table 4) whereas, in C. carinatus this ratio has a mean of 0.96 (Sabatini & al., 2007). Similarly, the length of the inner border of exopodal segment 2 relative to the maximum width of this segment (C/c') has a mean of 2.85 (range 2.53-3.30) (Table 4), whereas, in C. carinatus this ratio has a mean of 4.06 (Sabatini & al., 2007).
It is more difficult to distinguish female C. natalis from C. brevicornis, as their antennumar setation is the same. Their distributions overlap off southern Africa and no males were available of the latter species for re-examination.
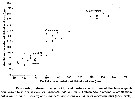
Measurements of the female genital double-somite maximum width and posterior width were plotted against one another (Fig.12): the measurements for each species did not overlap in two dimensional space. Comparisons of these measurements were all significantly different, but the two populations of C. natalis (Arabian Sea and off Namibia) did not differ significantly (p > 0.1). It is known that C. natalis and C. brevicornis are genetically distinct (Viñas & al., 2015), but there are further subtle differences in shape and proportions that are difficult to quantify. See in Remarks for Calanoides brevicornis.
Bode & al. (2018) note this species in Table 1, and not Calanoides carinatus, stricto sensu, in the west Africa, it last species being mainly in the brezilian zone. | | | Last update : 11/03/2026 | |
|
|
 Any use of this site for a publication will be mentioned with the following reference : Any use of this site for a publication will be mentioned with the following reference :
Razouls C., Desreumaux N., Kouwenberg J. and de Bovée F., 2005-2026. - Biodiversity of Marine Planktonic Copepods (morphology, geographical distribution and biological data). Sorbonne University, CNRS. Available at http://copepodes.obs-banyuls.fr/en [Accessed June 27, 2026] © copyright 2005-2026 Sorbonne University, CNRS
|
|
|
|


;)
;)
;)
;)
;)
;)
;)
;)
;)
;)
;)
;)
;)
;)
;)

;)
;)
;)
;)
;)
;)
;)
;)
;)
;)
;)
;)
;)
;)
;)
;)
;)
;)
;)
;)
;)
