|
|
 |
|
Calanoida ( Order ) |
|
|
|
Calanoidea ( Superfamily ) |
|
|
|
Calanidae ( Family ) |
|
|
|
Calanus ( Genus ) |
|
|
| |
Calanus hyperboreus Kröyer, 1838 (F,M) | |
| | | | | | | Syn.: | Calanus magnus Lubbock,1854;
Calanus plumosus Lubbock,1854;
no C. hyperboreus : Wilson, 1942 a (p.173) | | | | Ref.: | | | Kröyer, 1838 (in Damkaer & Damkaer, 1979, p.20); Giesbrecht, 1892 (p.91, 128, figs.F); Giesbrecht & Schmeil, 1898 (p.15); Sars, 1901 a (1903) (p.12, figs.F,M); Mràzek, 1902 (p.506); Farran, 1908 b (p.20); Lysholm, 1913 (p.5); With, 1915 (p.30, figs.F); Sars, 1925 (p.6); Rose, 1929 (p.6); 1933 a (p.57, figs.F,M); Jespersen, 1934 (p.34, Rem.); 1940 (p.7); Lysholm & al., 1945 (p.6); Brodsky, 1950 (1967) (p.86, figs.F,M); Farran & Vervoort, 1951 (n°32, p.3, fig.F); Wiborg, 1954 (p.103); 1955 (p.24); Tanaka, 1956 (p.258, Rem.); Conover, 1965 (p.153, figs.F,M, Rem. intersex.); 1965 a (p.308, figs.juv.5); Vinogradov, 1968 (1970) (p.45, 61, 63, 65, 86, 90, 95, 96, 112, 234, 262, 266); Shih & al., 1971 (p.36, 202); Vidal, 1971 a (p.11, 20, 113, figs.F,M); Marshall & Orr, 1972 (p.8); Brodsky, 1972 (1975) (p.9, 68, 84, 117, figs.F,M); Vyshkvartzeva, 1972 (1975) (p.188, figs.); Bradford & Jillett, 1974 (p.6); Vyshkvartzeva, 1976 (p.14); 1977 a (p.97, figs.); Kos, 1976 (Vol. II, figs.F, M, Rem.); Brodsky & al., 1983 (p.174, figs.F,M, Rem.); McLaren & Marcogliese, 1983 (p.721, cell nucleus); Fleminger, 1985 (p.275, 285, Table 1, 4, fig.M), Rem.: A1); Bradford, 1988 (p.76, Rem.); Schnack, 1989 (p.137, fig.7: Md); Bucklin & al., 1995 (p.658); Harris, 1996 (p.95, 98); Melle & Skjoldal, 1998 (p.211, Rem.); Lindeque & al., 1999 (p.91, Biomol.); Bartthélémy, 1999 a (p.10, Fig.19); Hill & al., 2001 (p.279, fig.2: phylogeny); G. Harding, 2004 (p.6, figs.F,M); Dalpadado & al., 2008 (p.2266, Fig.2: Md, Table 2, 3); Parent & al., 2011 (p.1654, Table II: overlaping prosome size ranges, figs.2, 3, 4, 5, Table 4: molecular identification vs size range); Kim S. & al., 2013 (p.64, mitochondrial genome); Choquet & al., 2017 (p.506, fig.1, phylogeny). | 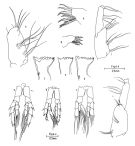 issued from : R.J. Conover in Crustaceana, 1965, 8. [p.154, Fig.1]. Comparison of head appendages and fifth legs of normal male and female and the intersex (from Long Island, USA): a, P5 (normal female); b, idem (normal male; c, idem (intersex); d, mandible blade (normal female); e, idem (normal male); f, idem (intersex); g, precoxal gnathobase on Mx1 (male; h, idem (intersex); i, coxa and basipod of Mxp (male); j, idem (female); k, idem (intersex). Nota: In normal animals, the inner margin of the coxae of P5 usually bears from 19 to 31 teeth which are not continuous to the distal end of the segment. There seems to be no sexual difference in the number of teeth, but the inner margin bearing them is straight or convex in the female and concave in the male. The exopod and endopod consist of 3 segments each in the adult of both sexes. The P5 male are slightly asymmetrical, particularly the most distal segment of the left exopod which is concave along the inner margin and lined with short, stiff bristles. The P5 interxex were abnormal, with the exopod and endopod of left leg both 2-segmented, as was also the exopod of the right leg. The coxae of the intersex's P5 appear to be of the female type (compare figs. 1a and c), with coxal teeth counts of 19 and 20 on the left and right sides, respectively. In normal adult, the mouth parts of C. hyperboreus are similar to those of C. finmarchicus, but because of the differences in feeding behavior between the sexes a more detailed study was made of those of C. hyperboreus: 1- A2 consists of an exopod 7-segmented and an endopod 2-segmented, each differing only slightly between sexes except in relative size; both rami are proportionally longer in males than in either stage V or adult females, suggesting allometric enlargement in the last molt. 2- Md blabe is of the typical Calanus type described by Beklemishev (1959), but there is a marked reduction in width of the chewing surface in the male, the entire blade in the male is relatively soft and the teeth lack a heavy sclerotic coat; also missing in the males are the short stiff bristles found in both stage V copepodids and females along the ventral edge of the blade near its narrowest dimension. 3- the anterior labrum is soft and has reduced musculature in the male. 4 - The length of Mx2 is relatively less than in males and the setation is somewhat reduced. 5 - Mxp was the only mouthpart measured taht failed to show allometric growth between the stages; the basal 2 segments (coxa and basipod) also show considerably reduced setation in the male as compared with the female. In the intersex, the mouthparts were largely of the female type. On dissection, the genital system showed both male and female characteristics (see figure 2, below).
|
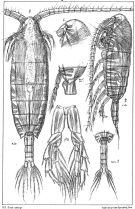 issued from : G.O. Sars in An Account of the Crustacea of Norway. Vol. IV. Copepoda Calanoida. Published by the Bergen Museum, 1903. [Pl. V]. Female & Male.
|
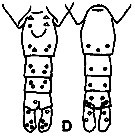 issued from K. Hulsemann in Invert. Taxon., 1994, 8. [p.1477, Fig.28, D]. Female: D, urosome (left: ventral); right: dorsal). Pore signature schematic by pooled samples (symbols are considerably larger than pores): Filled circle: 100 % presence; open circle: 95-99 % presence; triangle: 50-89 % presence. n = 15.
|
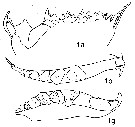 issued from : N.V. Vyshkvartzeva in Issled. Fauny Moreï, 1972, 12 (20). [p.166, Fig.5, i, a, b, g]. Femele Md (masticatory edge):1a, lateral aspect; 1b, left Md (bove view); 1g, right Md (above view)
|
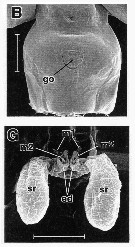 issued from : R.-M. Barthélémy in These Doct. Univ. Provence (Aix-Marseille I), 1999. [Fig.19, B, G]. Female (from W coast of Greenland: Arctic): B, external ventral view genital double-somite; G, internal dorsal view genital area. go = genital operculum; m1operculum muscle; m2 = muscles of egg-laying ducts; ed = egg-laying ducts; sr = seminal receptacles. Scale bars: 0.200 mm (F); 0.100 mm. (G)
|
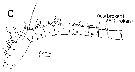 issued from : A. Fleminger in Mar. Biol., 1985, 88. [p.283, Fig.5 C]. As Calanus s.l. hyperboreus. Male (from N Pacific, subarctic): Left A1 proximal segments (ventral view); Nota: see remarks in Calanus s.l. pacificus californicus (Fleminger, 1985, p.275) concerning the dimorphism in the female A1.
|
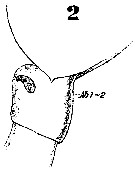 Issued from : W. Giesbrecht in Systematik und Faunistik der Pelagischen Copepoden des Golfes von Neapel und der angrenzenden Meeres-Abschnitte. - Fauna Flora Golf. Neapel, 1892, 19 , Atlas von 54 Tafeln. [Taf.6, Fig.2]. Female: 2, thoracic segment 5 and genital segment (lateral).
|
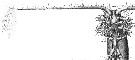 Issued from : W. Giesbrecht in Systematik und Faunistik der Pelagischen Copepoden des Golfes von Neapel und der angrenzenden Meeres-Abschnitte. - Fauna Flora Golf. Neapel, 1892, 19 , Atlas von 54 Tafeln. [Taf.6, Fig.6]. Female (pro parte): 6, cephalosome and thoracic segment 1 (ventral). Ce =cephalosome; Th1 = thoracic segment 1; Vord. Ant. = A1; Hint. Ant. = A2; Man = MdMax. = Mx1; Vord. Mxpd = Mx2;Hint. Mxpd. = Mxp.; 1-Schwimm-fuss = swimming leg 1 (P1).
|
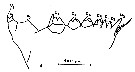 issued from : S.B. Schnack in Crustacean Issue, 1989, 6. [p.144, Fig.7: 1]. 1, Calanus hyperboreus (from Arctic): Cutting edge of Md. V = ventral teeth; C = central teeth; D = distal teeth. Nota: Schnack underlines the geographic differences in the development of the ventral teeth (see alsoin Beklemishev, 1959; Sullivan & al., 1975 and Vyshkvartseva, 1975. In polar regions, the 2nd ventral tooth is well developed, whereas it is small or absent in copepods of warmer regions, in relation wiith the size of diatoms, whereas in warmer regions, where small flagellates and coccolithophorids are more abundant, a 2nd well-developed ventral tooth would be unnecessary (see in the Md of Calanus carinatus).
|
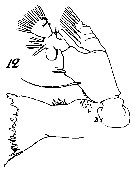 Issued from : W. Giesbrecht in Systematik und Faunistik der Pelagischen Copepoden des Golfes von Neapel und der angrenzenden Meeres-Abschnitte. - Fauna Flora Golf. Neapel, 1892, 19 , Atlas von 54 Tafeln. [Taf.7, Fig.12]. Female: 12, Md (anterior view).
|
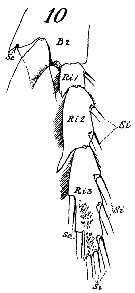 Issued from : W. Giesbrecht in Systematik und Faunistik der Pelagischen Copepoden des Golfes von Neapel und der angrenzenden Meeres-Abschnitte. - Fauna Flora Golf. Neapel, 1892, 19 , Atlas von 54 Tafeln. [Taf.8, Fig.10]. Female: 10, endopod of P1 (anterior view).
|
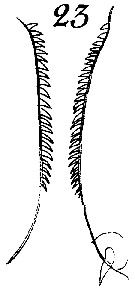 Issued from : W. Giesbrecht in Systematik und Faunistik der Pelagischen Copepoden des Golfes von Neapel und der angrenzenden Meeres-Abschnitte. - Fauna Flora Golf. Neapel, 1892, 19 , Atlas von 54 Tafeln. [Taf.8, Fig.23]. Female: 23, P5 (inner margin of B1 for two individuals). B1 = coxa.
|
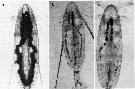 issued from : H.-J. Hirche & B. Niehoff in Polar Biol., 1996, 16. [p.216, Fig.6]. Gonads of female Calanus hyperboreus. Examples of mature females from the field and from females collected in August 1992. a: collected in June 1991; b: gonad with mature oocytes, which, however, were not deposited; c: Note the large oil sac in the anterior cephalothorax region in a and the thin remnants of the oil sac in b and c.
|
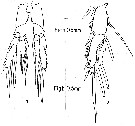 Issued from : R.J. Conover in Crustaceana, 1965, 8 (3). [p.313, Fig.1] Calanus hyperboreus (from SE Cape Cod, Massachusetts): a, P5 of a normal stage V (sex undetermined); b, outer ramus of the left P5 of incomplete molt showing the formation of the male type P5 within the stage V structure.
|
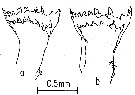 Issued from : R.J. Conover in Crustaceana, 1965, 8 (3). [p.314, Fig.2] Calanus hyperboreus (from SE Cape Cod, Massachusetts): Mandible blades of incomplete molts showing the adult structure whithin the stage V test. a, stage V to female, b, stage V to male.
|
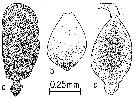 Issued from : R.J. Conover in Crustaceana, 1965, 8 (3). [p.315, Fig.3] Calanus hyperboreus (from SE Cape Cod, Massachusetts): a, ovary from stage V in medium stage of development; b, testis from stage V at medium stage of development; c, testis of recently molted male. Nota : In his study, Conover points to a number of characters have been considered as possible criteria to distinguish the sex of living stage V copepodids. In addition to urosome shape and the head length-body ratio, the appearance of the immature gonad as seen through the dorsal surface, the shape and color of the oil sac, and the pigmentation of the base of the first urosomal segment were used. Dissection of preserved animals showed that the immature gonad was usually a reliable means of distinguishing sex during the fall and winter months. Early in its development, the immature gonad, probably in both sexes, cponsisted of a small cluster of spherical cells of uniform size (± 15µ) visible under high power of dissecting microscope. As the female gonad developed, the oogonia could be seen to grade gradually into larger developing oocytes (a). The immature male gonad was distinguishable by its more dense, fine-grained appearance and its more nearly oval- or pear-shape (b, c).
|
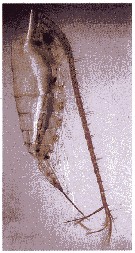 Issued from : S. Falk-Petersen & al. in Deep-Sea Res. II, 2008, 55. [p.2282, Fig.9]. Arctic Ocean: the lipid-rich Calanus hyperboreus with a green gut and a well-developed lipid sac, collected at the Ice station 1 (82°N, 11°E) on 2 September
|
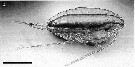 Issued from : B.J. Hansen, K. Degnes, I.B. Øverjordet, D. Altin & T.R. Størseth in Polar Biol., 2013, 36. [p.1578, Fig.1, A]. Calanus hyperboreus Stage V from Kongsfjorden, Svalbard (79°N, 12°E). Scale bar = 2 mm.
|
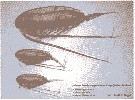 Issued from : J. Berge, T.M. Gabrielsen, M. Moline & P.E. Renaud in J. Plankton Res., 2012, 34 (3). [p.192, Fig.1]. The three Arctic calanus spp.: C. hyperboreus (top), C. glacialis and C. finmarchicus (bittom). The relative larger size, longer life and larger lipid sac of the high Arctic C. glacialis, compared to that of the more boreal C. finmarchicus, are generally assumed to be adaptative traits evolved in response tiwards the strong seasonality of the high Arctic. Nota: For the authors the predation pressure by the now nearly extinct baleen whales was an important diriving force in the evolution of fife history diversity in the Arctic Calanus complex. The argument centers on the principle that evolution of short life cycles and/or higher fecundity may be an adaptative response to increased predation pressures (See Stearns, 1992). It is assumed an overall predation risk that is lower in the Arctic Ocean compared with more moderate latitudes where large populations of visual predators such as pelagic fish are common (See Kaartvedt, 2008). Life history theory predicts larger, longer-lived species to be most abundant in areas of low predation risk (See Stearns & Koella, 1986). This is, in fact, what we observe today with C. hyperboreus and C. glacialis dominating areas recently inhabited by baleen whales. Even under high predation pressures, short life cycles and high fecundity may maintain high standing stocks of prey despite considerable removal of biomass. A similar, contemporary relationship was hypothesized for the Southern Ocean, focusing on the interaction between whales and krill (see Smetacek, 2008). Another evidence supporting our alternative view comes from comparison of regions of different levels of whale harvesting. A contemporary ecological changes may be detected when comparing the Svalbard area with the Disko Bay (western coast of Greenland). The former area, where whales are strongly depleted and seabirds dominate (See Steen & al., 2007) stands in stark contrast with Disko bay where Bowhead whales are still numerous (See Heide-Jørgensen & al., 2007) and little auks, are comparably very few in numbers (Berge, pers. observ.).
|
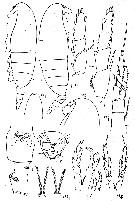 Issued from : K.A. Brodsky, N.V. Vyshkvartzeva, M.S. Kos & E.L. Markhaseva in Opred. Faune SSSR, 1983, 135. [p.175, Fig.76]. Female and male (after Sars, 1903; Brodsky, 1950 and 1972).
|
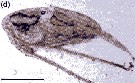 Issued from : M. Daase, Ø. Varpe & S. Falk-Petersen in J. Plankton Res., 2013, 36 (1). [p.135, Fig.1 d].
d: carcass of CIV of Calanus hyperboreus with broken carapace and lipid sac (above the gut).
Scale bar = 1 mm.
| | | | | Compl. Ref.: | | | T. Scott, 1902 (p.450); Damas & Koefoed, 1907 (? part., p.352, tab.II, III); Sars, 1909 b (p.16); Ostenfeld, 1913 (p.113, respiration); Sømme, 1934 (p.1, life-span, production); Jespersen, 1939 (p.26, Rem., Table 25, 26, 27, 28, 29, 30); Barnes, 1949 (p.429, statistical variations); C.B. Wilson, 1950 (part., p.178, non stations Pacif.); Gundersen, 1953 (p.1, 15, seasonal abundance); Østvedt, 1955 (p.14: Table 3, p.17, 35, 55); Lacroix, 1960 (p.11, 25); Conover, 1960 (p.399, Table I, respiratory rate); Raymont & Conover, 1961 (p.154, carbohydrate content); Grice, 1962 a (p.101, 102); Marshall & Orr, 1962 (tab.3); Conover, 1962 (p.190, metabolism-growth); Grice & Hart, 1962 (p.287, table 3: rare); Grainger, 1963 (p.66, fig.10, 12, chart, size); Grice, 1963 a (p.495); M.W. Johnson, 1963 (p.89, Table 1, 2); Mullin, 1963 (p.239, grazing rate vs. diet); Brodsky, 1964 (p.105, 107); Conover, 1964 (p.81, Table 2, fig.1, nutrition, assimilation); 1965 a (p.308, moulting cycle, sexual characters, sex ratio); Grice & Hulsemann, 1965 (p.223); Conover, 1966 (p.338, Table I, 2, assimilation, fecal pellets-bacteria); 1966 a (p.346, feeding, assimilation); 1966 b (p.187, feeding on large particles); Harding, 1966 (p.17, 65, 66, 71); Matthews, 1967 (p.159, Table 1, Rem.); Maclellan D.C., 1967 (p.101, 102: occurrence); Conover, 1967 (p.61, egg, development time, fecundity); Corner & Cowey, 1968 (p.393, Table 7, 8, respiration rate, assimilation); Conover & Corner, 1968 (p.49, 53, 65, respiration & nitrogen excretion); Dunbar & Harding, 1968 (p.319); Itoh, 1970 a (p.1, tab.2); Corkett, 1972 (p.171, eggs: development rate); Matthews & Sands, 1973 (p.19, Table 4); Beaudouin J., 1973 (p.69); Harding, 1974 (p.141, tab.2, gut contents); Lee R.F., 1974 a (p.313, lipids); Landry, 1975 a (p.434, Rem.: p.437, fig.3); Bousfield & al., 1975 (p.1, estuary); Sargent, 1976 (p.149, lipids); Skjoldal & Bamstedt, 1977 (p.197, adenosides); Deevey & Brooks, 1977 (p.256, Table 2, Station "S"); Matthews & al., 1978 (p.277, annual cycles); Dawson, 1978 (p.950, vertical distribution, generation length); Poulet & Marsot, 1980 (p.198, Table 1, feeding); Kosobokova, 1980 (p.84, caloric value); Bamstedt & Skjoldal, 1980 (p.304, weight-RNA); Pipe & Coombs, 1980 (p.223, figs. 1, 2, table 1, vertical distribution); Hebert & Poulet, 1980-81 (p.121, feeding v.s. oil polluant); Huntley, 1981 (p.831, ingestion rate vs. food concentration); Gagnon & Lacroix, 1981 (p.401, Table 1, tidal effect); [Kovalev & Shmeleva, 1982 (p.82)]; Buchanan & Sekerak, 1982 (p.41, vertical distribution); Gagnon & Lacroix, 1982 (p.9, fig.4); 1983 (p.289, tidal estuary); Head & Conover, 1983 (p.219, digestive enzymes); Huntley & al., 1983 (p.143, Table 2, 3); McLaren & Marcogliese, 1983 (p.721, body size vs. nucleus counts); Bamstedt, 1983 (p.291, RNA variation); Herman A.W., 1983 (p.709, vertical abundance vs. Chl.a); Rudyakov, 1983 (p.249, vertical distribution); Tremblay & Anderson, 1984 (p.4); Sameoto, 1984 (p.213, Table 1, fig.3, 7, 8); 1984 a (p.767, vertical migration); Head & Harris, 1985 (p.99, feeding activities, digestive enzymes); Head & al., 1985 (p.281, gut pigment analysis); Smith & al., 1985 (p.693); Hargrave & al., 1985 (p.221, annual abundance); Bamstedt, 1985 (p.607, excretion rate); Bamstedt & Tande, 1985 (p.259, Table 2: literature data respiration & excretion); Groendahl & Hernroth, 1986 (tab.1); Head & al., 1986 (p.271, grazing); Conover & al., 1986 (p.878, Table1, filtration rate); Mikhailovsky, 1986 (p.83, Table 1, ecological modelling); Hirche, 1987 (p.347, activity, respiration v.s. temperature); 1987 a (p.431, spatial distribution, enzyme activities, nutrition); Falk-Petersen & al., 1987 (p.115, lipid composition); Huntley, 1988 (p.83, Table 1, feeding history); Conover & al., 1988 (p.267, 268); Head & al., 1988 (p.333, Table 1, 2, gut analysis, defecation rate); McLaren & al., 1988 (p.275, DNA content, development rate: egg-nauplius); S.L. Smith, 1988 (p.145, feeding, respiration, ammonium, excretion ice-edge effect); Bamstedt, 1988 (p.15, protein content); McLaren & al., 1989 (p.560, life history, annual production); Kattner & al., 1989 (p.473, Table 1, 2, 3, dry weight, lipids); Kosobokova, 1989 (p.27); Hirche, 1989 (p.431, spatial distribution, enzyme activity); Ikeda & Skjoldal, 1989 (p.173, oxygen consumption, N & P excretion, O:N vs. body weight); Citarella, 1989 (p.123, abundance); S.L. Smith, 1990 (p.59, egg production, lipid, gut content); Estep & al., 1990 (p.235, grazing); Hansen B. & al., 1990 (p.5, grazing); Fransz & al., 1991 (p.9); Conover & al., 1991 (p.177); Hirche, 1991 (p.351); Hirche & al., 1991 (p.477, Fig.7, 8, Table 2); Conover & Huntley, 1991 (p.1, fig.2, 3, 4, 5, Table 2, 3, 9, 10, 11, polar seas comparison); Head, 1992 (p.583, gut pigment destruction); Hirche & Mumm, 1992 (p.485, geographic distribution); Herman, 1992 (p.395, fig.9 a, size distribution by OPC); Huntley & Lopez, 1992 (p.201, Table 1, A1, eggs, egg-adult weight, temperature-dependent production); Conover & al., 1993 (p.303, Table 2, figs. 7 , 8, 10, dry weight, %); Mumm, 1993 (tab.1, fig.2); Richter, 1994 (tab.4.1a); Vinogradov & al., 1994 (tab.1); Petryashov & al., 1995 (tab.1); Ashjian & al., 1995 ( p.4371, Fig.4, 5, 6, Table 2, 4); Hays, 1995 (p.301, fig.1, Table 1, vertical migration); Hirche & Niehoff, 1996 (p.209, vertical distribution, reproduction); DFO, 1996 (p.1, fig.6, interannual abundance); Albers & al., 1996 (p.347, lipids vs. diet); Zauke & al., 1996 (p.141, Table 7, metal bioaccumulation); Hanssen, 1997 (tab.3.1); Hirche, 1997 (p.607, abundance, vertical distribution, life cycle); Hirche & Kwasniewski, 1997 (p.299, Table 1, 4, 5, Fig.4, 10, 12, 13); Falkenhaug & al., 1997 (p.449, spatio-temporal pattern); Daly, 1997 (p.319, Table 4, fecal pellet); Ashjian & al., 1997 (p.279, Table 1, 2, Figs. 2, 3, 4A,F); Weslawski & Legezynska, 1998 (p.1238); Kosobokova & al., 1998 (tab.2); Mauchline, 1998 (tab.21, 26, 33, 45, 46, 47, 48, 58, 63); Mumm & al., 1998 (p.189, Figs.3, 4); Niehoff, 1998 (p.53, gonad maturation); Melle & Skjoldal, 1998 (p.211, egg production, development); Sameoto & al., 1998 (p.1, 7, figs. 8, 9, spatial distribution, interannual variation); Hirche, 1998 (p.359, dormancy); Conover & Gustavson, 1999 (p.41, tab.6); Halvorsen & Tande, 1999 (p.284, tab.2, 3, Rem.: p.281); B.W. Hansen & al., 1999 (p.233, seasonal abundance & biomass); Thibault & al., 1999 (p.1391); Kosobokova & Hirche, 2000 (p.2029, tab.2); Huggett & Richardson, 2000 (p.1843, tab.2); White & McLaren, 2000 (p.751, tab.1); Musaeva & Gagarin, 2000 (p.534, tab.1); Beare & al., 2000 (p.1545, Arctic index indicatot); DFO, 2000 a (p.1, Rem.: p.8, fig., interannual variations); Musaeva & Suntsov, 2001 (p.511); Lischka & al., 2001 (p.186); Sameoto, 2001 (p.749, Table 4, Rem.: decadal changes); Johns & al., 2001 (p.2121, Rem.: long-term series); Madsen & al., 2001 (p.75, development & production vs. annual); Fortier M. & al., 2001 (p.1263, fig.6, 7, diel vertical migration); Pasternak & al., 2001 (p.1141, seasonal changes in feeding, gonad & lipid stores);Holmes, 2001 (p.37); Beaugrand & al., 2002 (p.1692); Beaugrand & al., 2002 (p.179, figs.5, 6); Auel & Hagen, 2002 (p.1013, tab. 2, 3); Wexels Riser & al., 2002 (p.175, fecal pellets); Pasternak & al., 2002 (p.147, Table 4, feeding activity vs. egg production, faecal pellets); Ringuette & al., 2002 (p.5081, Table 1, 2, Fig.6, population dynamic); Sameoto & al., 2002 (p.12); Astthorsson & Gislason, 2003 (p.843); Hirche & Kosobokova, 2003 (p.769, Fig.3, 9, Table 2, 3); Kahle & Zauke, 2003 (p.409, metals concentration); Ashjian & al., 2003 (p.1235, figs.); Karnovsky & al., 2003 (p.289, Appendix 1, 2, auks relation/copepods); Lindeque & al., 2004 (p.121, fig.2); Gislason & Astthorsson, 2004 (p.472, tab.1, fig.4); CPR, 2004 (p.50, fig.140); Miller C.B., p.218, Rem.); Veistheim & al., 2005 (p.382, tab.2, fig.1); Dmoch & Walczowski, 2005 (p.102 + poster); Thor & al., 2005 (p.341); Hirche & al., 2005 (p.310); Somoue & al., 2005 (Table I: p.66); Arnkvaern & al., 2005 (p.528, dynamic); Frangoulis & al., 2005 (p.254, Table I: C/N/P fecal pellet composition); Hopcroft & al., 2005 (p.198, table 2); Blachowiak-Samolyk & al., 2006 (p.101, tab.1); Lindeque & al., 2006 (p.221); Basedow & al., 2006 (p.1186: Table II); Hop & al., 2006 (p.182, Table 4, 5: inter-annual variability); Willis & al., 2006 (p.39, Table 2, advection vs changes in community structure); Olli & al., 2007 (p.84, Rem.: ice drift); Daase & al., 2007 (p.903, abundance/T°S); Deibel & Daly; 2007 (p.271, Table 1, 2, 3, 5, Rem.: Arctic polynyas); Blachowiak-Samolyk & al., 2007 (p.2716, Table 2); Falk-Petersen & al., 2007 (p.147, Table 9.1); Head & Sameoto, 2007 (p.2686, abundance vs interdecadal variability); Kattner & al., 2007 (p.1628, Table 1, Rem.: p.1634, seasonal pulsing phytoplankton vs dominance); Lane & al., 2008 (p.97, Tab.4, 6, fig.6); Søreide & al., 2008 (p.2225, feeding strategy); Ota & al., 2008 (p.215, nauplii); Darnis & al., 2008 (p.994, Table 1, figs.8, 9); Tamelander & al., 2008 (p.2330, Table 1, organic matter); Gaard & al., 2008 (p.59, Table 1, N Mid-Atlantic Ridge); Jensen & al., 2008 (p.100); Pasternak & al., 2008 (p.2245, Table 1, 2, 3, grazing); Falk-Petersen & al., 2008 (p.2275, depth distribution); Blachowiak-Samolyk & al., 2008 (p.2210, Table 2, 3, 5, fig.4, biomass, composition vs climatic regimes); Walkusz & al., 2008 (p.1, Table 3, abundance); Pepin & al., 2008 (p.1, 9, figs. 21, 26, 31, 34, interannual variations); Dvoretsky & Dvoretsky, 2009 a (p.11, Table 2, abundance); Harvey & Devine, 2009 (p.5, interannual variation); Campbell & al., 2009 (p.1274, Table 2, 3, fig.3, grazing); DFO, 2009 (p.1, Rem. p.12, fig. 13, seasonal variability); Norrbin & al., 2009 (p.1945, Table 4, 5, abundance); Kosobokova & Hirche, 2009 (p.265, Table 4, fig.7: chart, biomass); Sampei & al. , 2009 (p.1894, in moored trap); Kosobokova & Hopcroft, 2010 (p.96, Table 1, fig.7); Head & Pepin, 2010 (p.1633, inter-decadal variability); Arendt & al., 2010 (p.49, Rem.: p.43); Bucklin & al., 2010 (p.40, Table 1, Biol mol.); Dünweber & al., 2010 (p.11, biomass, gut content); Hsiao & al., 2010 (p.179, Table III, trace metal concentration); Dvoretsky & Dvoretsky, 2010 (p.991, Table 2); 2011 a (p.1231, Table 2: abundance, biomass); Templeman, 2010 (p.1, 15: fig.12, interannual variations); Kwasniewski & al., 2010 (p.72, Table 2, abundance vs hydrography); Vogedes & al., 2010 (p.1471, lipid sac area vs lipid content); Dvoretsky V.G., 2011 (p.361, abundance, stage composition); Kosobokova & al, 2011 (p.29, Table 2, figs.4, 6, Rem.: Arctic basins); Tang & al., 2011 (p.77, composition & biomass); Pomerleau & al., 2011 (p.1779, Table III, IV, V, VI, VII); Swalethorp & al., 2011 (p.429, grazing, egg production and life strategies); Hirche & Kosobokova, 2011 (p.2359, Table 3, abundance, biomass %); Pepin & al., 2011 (p.273, Table 2, seasonal abundance); Forest & al., 2011 (p.161, biomass, chemical composition); 2011 a (p.11418); 2012 (p.1301, figs.7, 8); Tang K.W. & al., 2011 (p.666, Figs.1, 2, 3, gut pH & O2 profiles by microelectrodes); Matsuno & al., 2012 (Table 1, 2, 3, fig.4, 7); Laakmann & al., 2012 (p.535, Table 1, fig.2, Rem.: mol. Biol.); Carstensen & al., 2012 (p.951, Fig.2, 10, biomass); McMeans & al., 2012 (p.1095, seasonal patterns vs fatty acid); Tammilehto & al., 2012 (p.165, nutition, algal toxicity); Dalpadado & al., 2012 (p.1, abundance vs. climate change); Johnson C & al., 2012 (p.1, 15, fig. 23a, 24a, interannual variarions); Davies & al., 2012 (p.614, energy content vs methods); Ji & al., 2012 (p.40, Table 1, fig.2: development, life history, biogeography); Sampei & al., 2012 (p.90, Table 1, abundance in sediment trap); Berge & al., 2012 (p.191, evolution vs predation pressure by extinct baleen whales); Demontigny & al., 2012 (p.221, Table II, fig.5, abundance, prey by ichthyoplankton); Alvarez-Fernandez & al., 2012 (p.21, Rem.: Table 1); Henriksen M.V. & al., 2012 (p.109, egg production, fecal pellet vs temperature & food); Hansen B.H. & al., 2013 (p.1577, metabolism); Hsiao & Fang, 2013 (p.175, Table 2: Hg bioaccumulation); Questel & al., 2013 (p.23, Rem. p.31); Hirche, 2013 (p.2469, lifespan, reproduction); Pepin, 2013 (p.119, fig.3, abundance vs transect); Kwasniewski & al., 2013 (p.83, Table 2, 3, abundance); Saiz & al., 2013 (p.17, Rem.: p.23, abundance); Dvoretsky & Dvoretsky, 2013 a (p.205, Table 2, % abundance); Arendt & al., 2013 (p.105, fig.3, abundance); Barton & al., 2013 (p.522, Table 1: metabolism, diapause, population dynamic, feeding mode, biogeo); Zamora Terol, 2013 (p.97: fig.3, abundance, biomass); Daase & al., 2014 (p.129, fig.1, 2 mortality, carcasses, Table III, IV: abundance vs depth); Batnes & al., 2015 (p.51, Rem.); Schmid & al., 2016 (p.129, fig.3, identification vs imaging system); Smoot & Hopcroft, 2016 (p.1, Rem.: p.7); Albouy-Boyer & al., 2016 (p.589, Table II, fig.3, life cycle model vs. environmental factors); Aarflot & al., 2017 (p.2342, biomass); Baumgartner & Tarrant, 2017 (p.387, Table 1, fig.4, diapause); El Arraj & al., 2017 (p.272, table 2); Record & al., 2018 (p.2238, Table 1: diapause); Varpe & Ejsmond, 2018 (p.623, diapause model); Møller & Nielsen, 2019 (p.1, biomass vs. sea ice cover changing). | | | | NZ: | 5 + 1 doubtful | | |
|
Distribution map of Calanus hyperboreus by geographical zones
|
| | | | | |  Chart of 1996 Chart of 1996 | |
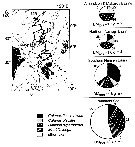 issued from : N. Mumm, H. Auel, H. Hanssen, W. Hagen, C. Richter & H.-J. Hirche in Polar Biol., 1998, 20. [p.192, Fig.1, p.194, Fig.3] issued from : N. Mumm, H. Auel, H. Hanssen, W. Hagen, C. Richter & H.-J. Hirche in Polar Biol., 1998, 20. [p.192, Fig.1, p.194, Fig.3]
Fig.1 after Diepenbroek & al., 1997; Station map, the dark line connects stations of different expeditions to a transpolar transect (AB: Amundsen Basin, BS: Barents Sea; GL: Greenland; GS: Greenland Sea; LR: Lomonov Ridge; MB: Makarov Basin; MJP: Morris Jessup Plateau; NB: Nansen Basin; NG: Nansen-Gakkel Ridge; SB: Spitsbergen; WSC: West Spitsbergen Current; YP: Yermak Plateau
Fig.3: Biomass share (% of total mesozooplankton dry mass) of Calanus finmarchicus, C. glacialis, C. hyperboreus, Metridia longa and other taxa in 0- to 500 m depth of different Arctic regions (DM total: mean total dry mass).
Note the co-occuring of the three species, but the the different abundance according to the basins.
C. finmarchicus reached a maximum abundance in the WSC, this form was the dominant species in the West Spitsbergen Current and south of the central Nansen Basin.
Note C. hyperboreus is more important towards the north and less common in the West Spitsbergen Current. |
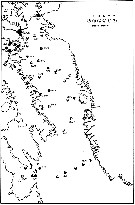 issued from : E.H. Grainger in R. Soc. Canada, Spec. Publs., 1963, 5. [p.87, Fig.10]. issued from : E.H. Grainger in R. Soc. Canada, Spec. Publs., 1963, 5. [p.87, Fig.10].
Baffin Bay and Davis Strait. Circles indicate ocurrence of C. hyperboreus , darkened segments showing copepodite stages present.
Numbers of stations are shown. |
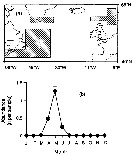 issued from : G.C. Hays in Mar. Ecol. Progr. Ser., 1995, 127. [p.302, Fig. 1]; issued from : G.C. Hays in Mar. Ecol. Progr. Ser., 1995, 127. [p.302, Fig. 1];
a: Areas (shaded) from which details of the temporal occurrence of copepodite stages V-VI Calanus hyperboreus in the CPR samples were examined.
b: Mean abundance of CV-VI (specimens per sample ± 1 SE) in different months. |
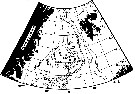 issued from : H.-J. Hirche & B. Niehoff in Polar Biol., 1996, 16. [p.210, Fig.1]. issued from : H.-J. Hirche & B. Niehoff in Polar Biol., 1996, 16. [p.210, Fig.1].
Calanus hyperboreus: Multinet sampling locations in the Greenland Sea. |
 issued from : H.-J. Hirche & B. Niehoff in Polar Biol., 1996, 16. [p.212, Fig.2]. issued from : H.-J. Hirche & B. Niehoff in Polar Biol., 1996, 16. [p.212, Fig.2].
Vertical distribution of female and male Calanus hyperboreus in the Greenland Sea.
In November data from three stations were pooled (613, 616, 653), in February and March stations 118 and 130a data were pooled. No males or very few after March. |
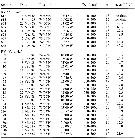 issued from : H.-J. Hirche & B. Niehoff in Polar Biol., 1996, 16. [p.215, Table 3]. issued from : H.-J. Hirche & B. Niehoff in Polar Biol., 1996, 16. [p.215, Table 3].
Egg production of Calanus hyperboreus in the Greenland Sea (n number of females in experiments).
Nota: Surprisingly, spawning of C. hyperboreus in the central Greenland Sea seems to take place earlier than in both more southern and northern latitudes. The reproductive cycle may relate to the timing of food abundance. Thus the spring bloom in the ice-free parts of the Greenland Sea occurs 2-3 months earlier than in the ice-covered Northwest Paasge (see Conover & Siferd, 1993). |
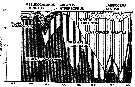 issued from : B.T. Hargrave, G.C. Harding, K.F. Drinkwater, T.C. Lambert & W.G. Harrison in Mar. Ecol. Prog. Ser., 1985, 20. [p.227, Fig.7]. issued from : B.T. Hargrave, G.C. Harding, K.F. Drinkwater, T.C. Lambert & W.G. Harrison in Mar. Ecol. Prog. Ser., 1985, 20. [p.227, Fig.7].
Major species of zooplankton present at the central station in St. Georges Bay (45°45'N, 61°45'W) during 1977.
Nota: All zooplankton collections were made after sunset. The net towed obliquely throughout the water column (± 34 m in depth). |
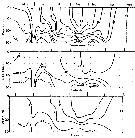 issued from : B.T. Hargrave, G.C. Harding, K.F. Drinkwater, T.C. Lambert & W.G. Harrison in Mar. Ecol. Prog. Ser., 1985, 20. [p.223, Fig.2]. issued from : B.T. Hargrave, G.C. Harding, K.F. Drinkwater, T.C. Lambert & W.G. Harrison in Mar. Ecol. Prog. Ser., 1985, 20. [p.223, Fig.2].
Seasonal profiles of water temperature and salinity in St. Georges Bay (45°45'N, 61°45'W) near the central station during 1977. |
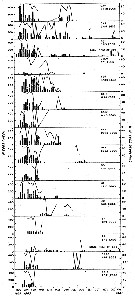 Issued from : R.J. Conover in Crustaceana, 1967, 13 (1). [p.67, Fig.2]. Issued from : R.J. Conover in Crustaceana, 1967, 13 (1). [p.67, Fig.2].
Record of weekly egg laying by sixteen typical females of Calanus hyperboreus taken from the plankton in immature condition and maintened with food in the laboratory.
Letters and numbers in right corner of each individual graph represent the laboratory code name. Beneath is total egg production. Histograms indicate number eggs produced per week. Solid line represents percentage developing hatching.
C. hyperboreus was taken at depths greater than 200 m either in the Gulf of Maine or in the slope water to the east or southeast of Caope Cod (Massachusetts), and fed with the diatom Thalassiosira fluviatilis, in concentration of 5 to 10 x 10power 6 cells/l.
Nota: In the Gulf of Maine C. hyperboreus produces 1 generation a year. Molting to the adult stage is generally concentrated in the late fall and early winter, but gravid females have been found from September to May.
Fecundity:
The largest batch of eggs known to have been produced by a single female at one laying was 388. An average batch produced at the height of the breeding season by a healthy female contained 150 to 250 eggs.
The reproductive career of 33 individual females taken from the plankton as immature adults, followed in the laboratory. The weekly egg laying history of 16 of these is shown in fig.2. The average female produced about 1340 eggs in laboratory lifetime of which 58% on the average developed to hatching. The most fecund female was in GB7 (fig.2) which laid about 3800 eggs in a five-month period, more than 95% of which developed. In general, females produced from laboratory molts were smaller and less fecund than those taken from the plankton, the highest career production of eggs being somewhat more than 500. |
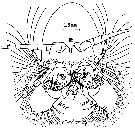 issued from : R.J. Conover in Some Contemporary Studies in Marine Science; Harold Barnes, Ed., 1966 b. [p.188, Fig.1]. issued from : R.J. Conover in Some Contemporary Studies in Marine Science; Harold Barnes, Ed., 1966 b. [p.188, Fig.1].
Anterior and slightly ventral view of Calanus hyperboreus female (from NW Atlantic) showing limbs in feeding position.
Stippled margin surrounds the area within which contact with a large particle can result in a successful capture.
A: second antenna (Antenna: A2); B: first maxilla (Maxillule: Mx1); C: second maxilla (Maxilla: Mx2); D: maxilliped (Mxp). L: labrum; E: interdigitated setae originating from the second maxillae and maxillipeds; F: tips of swimming legs.
Nota: Food sources included the copepod’s own eggs (about 200 µ in diameter), the diatom Coscinodiscus sp. (about 330-355 µ indiameter, 100-150 µ high) and Artemia salina nauplii (500-1000 µ long).
The large food particles passed posteriorly over the labrum and were introduced into the ‘filter chamber’ under the tips of the lowered swimming feet. The Mxp prevented vertical and lateral escape of particles and brought cells into a position where they could be seized by Mx2. Some particles excaped dorso-laterally between the maxillary palps and the base of the Mxp, but most on entering the refion outlined in figure 1 were at least temporarily. Although Mx2 serve primarily as a passive filter when food particles are small, they could also be moved forward and backward. The baxckward motion increased the distance between the setae on the two opposing Mx2 allowing a larger particle to slip between them and be grasped. Forward movement closed the setae and drove the object toward the mouth (see fig.2). A sudden backward movement lifted and spread the setae, causing an unwanted object to be flicked away, often aided by a quick flip of the swimming feet.
Also important in handling larger food particles are a set of five shorter, robust setae, one on the inner margin of each of the proximal four segments of Mx2 and one on the distal segment (see fig.3).
Once a large particle was contacted, i twas manipulated by co-ordinated effort of Mxp, Mx2, and Mx1 so that the greatest dimension was parallel to the long dimension of the copepod’s body.
Movement of Mx1 caused ventrally directed setae on the endopod to oppose the forward motion imparted to the particle by the shorter inner setae on the Mx2 and Mxp until the particle was ‘juggled’ into proper orientation. It was then driven forwards and dorsally until it could be reached by the endites of Mx1, which pressed it against the Md blades until consumed.
Muscular movement of the anterior diverticulum of the midgut apparently sucked the cell fragments inside the body as they were shredded by the Md.
A Coscinodiscus cell could be captured and eaten in as little as 4 seconds.
In most instances the diatom test was entirely consumed, occasionally the copepod discarded or lost a partially eaten cell.
An actively feeding animal would ingest an empty diatom frustule almost as readily as intact cells. On the other hand, semi-liquid cell contents could be partially lost and feeding appendages sometimes became coated with sticky cell sap. Even when feeding on small cells a portion of the cell contents was probably lost in feeding. Fifteen percent of the particulate carbon removed from suspension by C. hyperboreus feeding on Thalassiosira fluviatilis (15-20 µ diameter) re-appeared as dissolved organic substances, having been leached from damaged cells and excreted by the copepods (Helleburst & Conover).
Even in animals which fed most successfully, feeding was not a continuous process. Vigorously feeding animals might consume Coscinodiscus cells at nearly 1 per minute for 30 to 40 minutes, but eventually they would start to reject everything offered. Other animals would take several to half a dozen cells in short succession and then rejects cells for 10 to 30 minutes before feeding again.).
Even in animals which fed most successfully, feeding was not a continuous process. Vigorously feeding animals might consume Coscinodiscus cells at nearly 1 per minute for 30 to 40 minutes, but eventually they would start to reject everything offered. Other animals would take several to half a dozen cells in short succession and then rejects cells for 10 to 30 minutes before feeding again.
The Artemia nauplii were handled by the copepods somewhat differently from Coscinodiscus. The presence of the moving nauplius was apparently sensed from few millimetres away and the feeding response, lowering of the tips of the swimming feet and vigourous movement of the Mxp, was instituted before actual contact. The nauplius was seized in much the same way as a large cell and was then oriented by Mxp and both Mxp2 so that either the head or anal end entered the moth first. The actual ingestion was relatively slow process taking from 30 seconds to several minutes.
The endites of Mx1 would push the nauplius forward; then all movement of the head appendages would cease except for that of the mandibular blades. After a few seconds, the maxillae would again push the nauplius forward and the mandibular ‘chewing’ would be repeated. This alternation of processes was continued, sometimes with a brief interruption, until the nauplius was entirely consumed.
Among the more than fifty female and stage V animals examined, there was considerable variation in the hability to handle different particles.
Animals that had been feeding heavily on a unialgal culture of small cells were particularly inclined to reject large particles.
Other food preferences were also exhibited. One female layed eggs prior to the start of the observations and had been feeding on them. When offered Coscinodiscus she consistently rejected the cell, but readily ate her eggs when presented. Several other copepods, which had been feeding on Coscinodiscus, rejected the eggs after first bringing them to the mouth. If a fecal pellet was encountered, i twas usually oriented so that one end was ‘tasted’ and then i twas flicked away ; examination of the pellet showed that the peritrophic membrane had been torn open and the contents exposed.
After a brief period of feeding, the anterior portion of the midgut contained an abundance of rather fluid, greenish cell debris which was pushed back and forth by opposing waves of peristalsis. At least 40 minutes elapsed from the start of feeding before the first fecal pellet was ejected. Subsequent pellets might be produced at more frequent intervals, but not less than 15 or 20 minutes apart.
C. hyperboreus might assimilate about 0.06 µg carbon from each Coscinodiscus cell eaten. The maximum respiratory rate of female during the fall and early winter (when these observations were made) was about 25 µl O2/copepod/day oxidized if fat was the primary energy substrate or 13 µg C if carbohydrate was metabolized. Somewhere between 150 and 220 Coscinodiscus cells would have to be eaten daily to satisfy this requirement. |
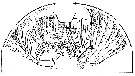 issued from : R.J. Conover in Some Contemporary Studies in Marine Science; Harold Barnes, Ed., 1966 b. [p.189, Fig.2]. issued from : R.J. Conover in Some Contemporary Studies in Marine Science; Harold Barnes, Ed., 1966 b. [p.189, Fig.2].
Diagrammatic representation of the range of movement shown by the feeding appendages when handling large particles.
A, Mx1; B, Mx2; C, Mxp. D, setae on inner margin of Mx2; E, setae on basal segment of Mxp; L, labrum. |
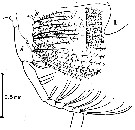 issued from : R.J. Conover in Some Contemporary Studies in Marine Science; Harold Barnes, Ed., 1966 b. [p.190, Fig.3]. issued from : R.J. Conover in Some Contemporary Studies in Marine Science; Harold Barnes, Ed., 1966 b. [p.190, Fig.3].
Idealized lateral view of the left Mx2 and left Mxp showing the interdigitated setae on both structures. A, Mxp; B, Mx2; L, labrum. |
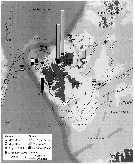 Issued from : J.E. Søreide, S. Falk-Petersen, E.N. Hegseth, H. Hop, M.L. Carroll, K.A. Hobson & K. Blachowiak-Samolyk in Deep-Sea Res., II, 2008, 55. [p.2228, Fig.1]. Issued from : J.E. Søreide, S. Falk-Petersen, E.N. Hegseth, H. Hop, M.L. Carroll, K.A. Hobson & K. Blachowiak-Samolyk in Deep-Sea Res., II, 2008, 55. [p.2228, Fig.1].
Study sites in the Svalbard region. The biomass (dry-weight b/m2) of the population of Calanus hyperboreus, C. glacialis and C. finmarchicus (CI-adult) is shown for the main sampling locations (data from Stn. NK2 is missing) and the Atlantic and Arctic water masses are indicated by arrows (WCS: west Spitsbergen Current). The location of the ice edge (defined as 30% ice concentrations) is indicated for selected dates.Issued from : J.E. Søreide, S. Falk-Petersen, E.N. Hegseth, H. Hop, M.L. Carroll, K.A. Hobson & K. Blachowiak-Samolyk in Deep-Sea Res., II, 2008, 55. [p.2228, Fig.1].
Study sites in the Svalbard region. The biomass (dry-weight b/m2) of the population of Calanus hyperboreus, C. glacialis and C. finmarchicus (CI-adult) is shown for the main sampling locations (data from Stn. NK2 is missing) and the Atlantic and Arctic water masses are indicated by arrows (WCS: west Spitsbergen Current). The location of the ice edge (defined as 30% ice concentrations) is indicated for selected dates.
Nota: Stable isotope and fatty acid trophic marker techniques were employed together to assess trophic level, carbon sources (phytoplankton vs. ice algae), and diet of the three Calanus species.
Patterns in absolute fatty acid and fatty alcohol composition revealed that diatoms were the most important food for C. hyperboreus and C. glacialis, followed by Phaeocystis, whereas diatoms, Phaeocystis and other small autotrophic flagellates were equally important for C. finmarchicus. |
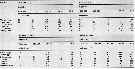 Issued from : S. Falk-Petersen & al. in Deep-Sea Res., 2008, 55. [p.2282, Table 5]. Issued from : S. Falk-Petersen & al. in Deep-Sea Res., 2008, 55. [p.2282, Table 5].
Arctic Ocean, Ice Stations 1 (82°N, 11°E) on 2 September 2004, and 2 (82°30'N, 21°E) on 4 September 2004: Depth distribution of mesozooplankton in the upper 1200 m. |
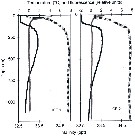 Issued from : S. Falk-Petersen & al. in Deep-Sea Res., 2008, 55. [p.2281, Fig.8]. Issued from : S. Falk-Petersen & al. in Deep-Sea Res., 2008, 55. [p.2281, Fig.8].
Arctic Ocean, Ice Stations 1 (82°N, 11°E) on 2 September 2004, and 2 (82°30'N, 21°E) on 4 September 2004: Temperature (black profile), relative fluorscence values (red line), salinity (dotted line). |
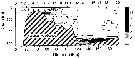 Issued from : K.W. Tang, T.G. Nielsen, P. Munk, J. Mortensen, E.F. Møller, K.E. Arendt, K. Tönnesson, T. Juul-Pedersen in Mar. Ecol. Prog. Ser., 2011, 434. [p.83, Fig.4] Issued from : K.W. Tang, T.G. Nielsen, P. Munk, J. Mortensen, E.F. Møller, K.E. Arendt, K. Tönnesson, T. Juul-Pedersen in Mar. Ecol. Prog. Ser., 2011, 434. [p.83, Fig.4]
Calanus hyperboreus (from the continental slope off Fyllas Bank to the inner part of Godthabsfjord, SW Greenland, corresponding to stations 0 to 20) in the summer (2008).
Contour plots of biomass (mg C/m3) of all developmental stages collected from 4 to 9 strata with a multinet samples (300 µm mesh aperture)
Dots are mid-points of sampling intervals. Numbers on top are stations. Hatched area = bottom topography.
Compare this distribution with the other dominant large zooplankton species Calanus glacialis, Calanus finmarchicus and Metridia longa for the same transect. |
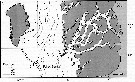 Issued from : K.W. Tang, T.G. Nielsen, P. Munk, J. Mortensen, E.F. Møller, K.E. Arendt, K. Tönnesson, T. Juul-Pedersen in Mar. Ecol. Prog. Ser., 2011, 434. [p.79, Fig.1] Issued from : K.W. Tang, T.G. Nielsen, P. Munk, J. Mortensen, E.F. Møller, K.E. Arendt, K. Tönnesson, T. Juul-Pedersen in Mar. Ecol. Prog. Ser., 2011, 434. [p.79, Fig.1]
Station positions along Godthabsfjord in southwestern Greenland. |
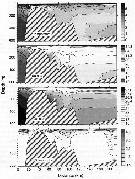 Issued from : K.W. Tang, T.G. Nielsen, P. Munk, J. Mortensen, E.F. Møller, K.E. Arendt, K. Tönnesson, T. Juul-Pedersen in Mar. Ecol. Prog. Ser., 2011, 434. [p.81, Fig.2] Issued from : K.W. Tang, T.G. Nielsen, P. Munk, J. Mortensen, E.F. Møller, K.E. Arendt, K. Tönnesson, T. Juul-Pedersen in Mar. Ecol. Prog. Ser., 2011, 434. [p.81, Fig.2]
Contour plots of water temperature (°C), salinity, density (kg/m3) and chlorophyll a (mg/m3) along the transect of Godthabsfjord.
Distances were measured from Station o. Note the different contour line scales for different panels.
Hatched area in each panel represents bottom topography. |
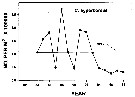 Issued from : DFO in DRO Sci. Stock Status Rep. G3-02 (2000). [p.8]. Issued from : DFO in DRO Sci. Stock Status Rep. G3-02 (2000). [p.8].
Abundance of C. hyperboreus in Emerald Basin (Nova Scotia) during the years 1982 to 1998.
Nota: Compare with Calanus finmarchicus and Calanus glacialis.
See in Sameoto & al., 1997. |
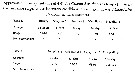 Issued from : R.J. Conover in Crustaceana, 1967, 13 (1). [p.65, Table I]. Issued from : R.J. Conover in Crustaceana, 1967, 13 (1). [p.65, Table I].
Specimens sampled from in the Gulf of Maine or in the slope water to the east or southeast of Cape Cod (Massachusets). In studies on egg laying and naupliar development, females were kept separately in 200 ml of culture at 5 ±1°C.
Naupliar stages 1 and 2 do not fed and still contain the red pigment found in the egg.
In naupius ,, the proctodeum apparently opens into the mid-gut and green cells can be observed internally when food is offered even though red pigment and oil droplets are still present in the gut region.
Once the feeding stages are reached, development becomes irregular and many nauplii do not molt beyond nauplius 4. The percentage of animals reaching the early copepodid stages was less than 1% of the number initially hatched.
Under laboratory conditions 3 to 4 months were required to reach copepodid stage 3.
In the Gulf of Maine C. hyperboreus produces one generation a year. Molting to the adult stage is generally concentrated in the late fall and early winter, but gravid females have been found from September to May (see Conover, 1965). |
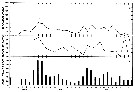 Issued from : R.J. Conover in Crustaceana, 1967, 13 (1). [p.68, Fig.3]. Issued from : R.J. Conover in Crustaceana, 1967, 13 (1). [p.68, Fig.3].
Seasonal egg production by laboratory population of calanus hyperboreus.
A, average number of eggs per breeding female and week; B, percentage of eggs developing to hatching (pecked line doubtful since only two females were laying); C, percentage of total laboratory population of females in breeding condition. |
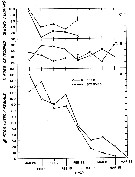 Issued from : R.J. Conover in Crustaceana, 1967, 13 (1). [p.70, Fig.5]. Issued from : R.J. Conover in Crustaceana, 1967, 13 (1). [p.70, Fig.5].
Egg production by fed and starved females of Calanus hyperboreus taken from the slope water in a gravid condition.
A, weekly egg production; B, percentage eggs developing to hatching; C, percentage eggs which were less dense than sea water.
The question mark ? indicates sample too small to be reliable.
Nota: Once breeding was initiated the presence or absence of food seemed to have little effect on the fecundity. In the sea, even with food scarce or absent, at least 400 or 500 eggs could be produced which should be adequate to produce the next generation. |
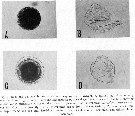 Issued from : R.J. Conover in Crustaceana, 1967, 13 (1). [Pl III, Fig.1]. Issued from : R.J. Conover in Crustaceana, 1967, 13 (1). [Pl III, Fig.1].
Eggs are squeezed from the genital aperture in pairs, apparently by waves of muscular contraction similar to peristalsis. They stick together initially forming a ribbon several millimeters long, but within 5 minutes the distal eggs begin to round up and become separated from each other.
On the two occasions that the laying process was timed, eggs were produced at a rate of 30 to 25 per minute. Therefore, 2 eggs are passing through the vaginal region every 4 seconds during which time they must be fertilized. The sperm are round or oval bodies about 6.3 µm in longest dimension and without obvious means of locomotion. How fertilization is accomplished in such a short time is not clear.
The egg when first laid is bright orang-red and about 170 to 190 µm in diameter. Sømme (1934) found the living eggs from Lofoten region ranged from 200 to 340 µm, and quite irregular in shape. Eggs from the Gulf of Maine were somewhat more variable in size after the membranes had lifted off the egg surface, ranging from 190 to 244 µm.
The membranes appeared several hours after the eggs were laid. Sometimes a single membrane appeared slightly raised from the egg surface (fig.1A), but a second inner membrane was apparently present as shown by examination of the membranes after hatching (fig. 1B). In eggs produced by a few females another membrane appeared to rise off the egg surface and become noticeably thickened (fig.1C), but was apparently not distinct from the first. After hatching there was only a single, thick outer membrane enclosing the inner membrane (fig.1D).
Sømme (1934) observed that the eggs floated. In the Gulf of Maine material, certain females produced floating eggs while others did not.Commonly the first one or two batches of eggs from a freshly caught female tended to float while later batches sank.
The average dry weight for an egg with an average diameter 209 µm was 1.4 µg. |
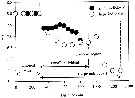 Issued from : K.W. Tang, R.N. Glud, A. Glud, S. Rysgaard & T.G. Nielsen in Limnol. Oceanogr., 2011, 56 (2). [p.668, Fig.2]. Issued from : K.W. Tang, R.N. Glud, A. Glud, S. Rysgaard & T.G. Nielsen in Limnol. Oceanogr., 2011, 56 (2). [p.668, Fig.2].
Gut pH profiles of Calanus hyperboreus (n = 2) that had been feeding on Thalassiosira weissflogii. Distance was measured from ambient water into the gut.
The dashed lines indicate the positions of the anal opening and the approximate urosome-metasome transition. |
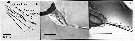 Issued from : K.W. Tang, R.N. Glud, A. Glud, S. Rysgaard & T.G. Nielsen in Limnol. Oceanogr., 2011, 56 (2). [p.667, Fig.1]. Issued from : K.W. Tang, R.N. Glud, A. Glud, S. Rysgaard & T.G. Nielsen in Limnol. Oceanogr., 2011, 56 (2). [p.667, Fig.1].
a: Calanus hyperboreus showing the different gut regions as defined in the study; b: direct insertion of a pH microelectrode through the anal opening of a thethered C. hyperboreus; c: An oxygen microelectrode reaching the metasome region.
All copepods were alive and in some experiments actively feeding. All scale bars are 2000 µm.
Experiments in May 2009 collected in Disko Bay (western Greenland) |
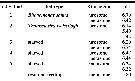 Issued from : K.W. Tang, R.N. Glud, A. Glud, S. Rysgaard & T.G. Nielsen in Limnol. Oceanogr., 2011, 56 (2). [p.668, Table 1]. Issued from : K.W. Tang, R.N. Glud, A. Glud, S. Rysgaard & T.G. Nielsen in Limnol. Oceanogr., 2011, 56 (2). [p.668, Table 1].
Gut pH of Calanus hyperboreus under different diet yreatments.
The microelectrode was positioned at approximately half-way up the urosome or the metasome region.
In some cases, multiple measurements were made on a single copepod.
One of the starvede individuals was fed Rhodomonas salina for a fewx hours and remeasured for its metasome region pH.
Ambient water' temperature was 6.5°C and ambient water pH was 8.00.
These experiments were conducted to test whether the copepod's feeding history influenced the gut pH. |
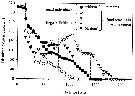 Issued from : K.W. Tang, R.N. Glud, A. Glud, S. Rysgaard & T.G. Nielsen in Limnol. Oceanogr., 2011, 56 (2). [p.669, Fig.3]. Issued from : K.W. Tang, R.N. Glud, A. Glud, S. Rysgaard & T.G. Nielsen in Limnol. Oceanogr., 2011, 56 (2). [p.669, Fig.3].
Gut oxygen profiles of Calanus hyperboreus (n = 5) that had been feeding on Rhodomonas salina or Thalassiosira weissflogii (diatoms), without or with visible food remains in the gut.
Distance was measured from ambient water into the gut.
The left dashed line indicates the position of the alal opening. The middle and right dashed lines indicate the approximate positions of urosome-metasome transition for the small and large individuals, respectively.
Ambient temperature was 7°C and salinity 34; 100% dissolved oxygen saturation was at 304 µmol per L. |
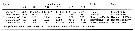 Issued from : M. Daase, J.E. Søreide & M. Martynova in Mar. Ecol. Peog. Ser., 2011, 429. [p.119, Table 6]. Issued from : M. Daase, J.E. Søreide & M. Martynova in Mar. Ecol. Peog. Ser., 2011, 429. [p.119, Table 6].
Length distribution (mm) of total length of nauplii of North Atlantic and Arctic Calanus spp. Comparison between C. glacialis, C. finmarchicus, C. hyperboreus.
nd: no data. |
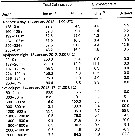 Issued from : M. Daase, Ø. Varpe & S. Falk-Petersen in J. Plankton Res., 2013, 36 (1). [p.137, Table III]. Issued from : M. Daase, Ø. Varpe & S. Falk-Petersen in J. Plankton Res., 2013, 36 (1). [p.137, Table III].
Estimated abundance (individuals per m3) of Calanus spp. and for Calanus hyperboreus in each depth layer at both stations
Nota: Samples were taken at Rijpfjorden (80°15.5' N, 22°15.7' E), Svalbard), depth 280 m, and at the ice edge at Sofiadjupet, a deep basin in the southern part of the Arctic Ocean (81°42' N, 14°16' E) depth 2290 m. Zooplankton sampled by vertical hauls from close to the bottom to the surface using a multiple opening/closing net (mesh aperture 200 µm).
Compare with Calanus glacialis and Calanus finmarchoicus at the same locations. |
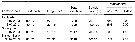 Issued from : M. Daase, Ø. Varpe & S. Falk-Petersen in J. Plankton Res., 2013, 36 (1). [p.139, Table IV]. Issued from : M. Daase, Ø. Varpe & S. Falk-Petersen in J. Plankton Res., 2013, 36 (1). [p.139, Table IV].
Abundance of Calanus hyperboreus obseved in net hauls taken in Rijpfjorden and at off-shelf locations in the pack ice north of Svalbard in July 2012.
Nota: Samples were taken at Rijpfjorden (80°15.5' N, 22°15.7' E), Svalbard), depth 280 m, and at the ice edge at Sofiadjupet, a deep basin in the southern part of the Arctic Ocean (81°42' N, 14°16' E) depth 2290 m. Zooplankton sampled by vertical hauls from close to the bottom to the surface using a multiple opening/closing net (mesh aperture 200 µm).
Compare with Calanus glacialis and Calanus finmarchicus at the same locations. |
 Issued from : H. Saito & A. Tsuda in Deep-Sea Res. I, 47. [p.2146, Table I]. Issued from : H. Saito & A. Tsuda in Deep-Sea Res. I, 47. [p.2146, Table I].
Egg diameter and prosome length (PL) of females of Calanus hyperboreus after McLaren & al., 1988.
Nota: Compare with N. cristatus, N. tonsus and N. flemingeri and others species in genus Calanus. |
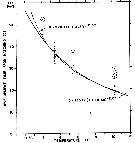 Issued from : C.J. Corkett, I.A. McLaren & J.-M. Sevigny in Syllogeus, 1986, 58. [p.542, Fig. 4]. Issued from : C.J. Corkett, I.A. McLaren & J.-M. Sevigny in Syllogeus, 1986, 58. [p.542, Fig. 4].
Belehràdek's temperature functions for development to CI in C. hyperboreus.
The dashed curve is the function with all parameters fitted.
The solid curve assumes that the function for embryonic duration (Fig. 1) is applicable to CI, differing only in proportionality (a).
Individualls within dashed circles were assumed to be abnormally delayed, were not used in fitting the function. |
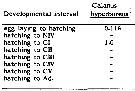 Issued from : C.J. Corkett, I.A. McLaren & J.-M. Sevigny in Syllogeus, 1986, 58. [p.545, Table I]. Issued from : C.J. Corkett, I.A. McLaren & J.-M. Sevigny in Syllogeus, 1986, 58. [p.545, Table I].
Relative times to reach various stages of C. hyperboreus, assuming equiproportional development.
All times expressed relative to time between hatching and molting to CI.
1 : From Fig. 1.
Nota: Compare with Calanus glacialis, C. finmarchicus , C. helgolandicus and C. pacificus. |
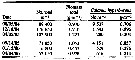 issued from : R.J. Conover & T.D. Siferd in Arctic, 1993, 45 (4). [p.307, Table 2]. issued from : R.J. Conover & T.D. Siferd in Arctic, 1993, 45 (4). [p.307, Table 2].
Numbers and dry weight biomass for the total water column (frpm Barrow Strait), before, during, and after the dark period 1984-1985 and 1985-1986 (Conover, Sifred and Harris, unpubl.).
Compare with Calanus glacialis, Metridia longa and Pseudocalanus acuspes in the same area of Barrow Strait.
For the authors, in C. hyperboreus from Resolute, C4 is the dominant overwintering stage and there does not appear to be much change in population structure during the dark period. However, there is continuous molting at a low rate from C5 to mature males and females all winter. Reproduction takes place in deep water using primarily lipid (wax ester) stored during the previous ice-free season, together with the female's bodily protein, and newly laid buoyant eggs float to the under-ice surface as they develop so that naupliar stages (N4-N6) are proximal to the sympagic algae on which they feed (M.D.G. Lopez, 1988, pers. comm.).
Most young have reached C1 by breakup. From this stage, there is still considerable confusion anout the most common pattern of development. Although C3 and C4 do not seem to store much lipid, both can overwinter, but it is not clear when C3 molt. It seems doubtful that C4 can be achieved in one growth season. Some C4 probably molt early in spring to C5 and others somewhat later, but C5 generally store considerable lipid in the open-water season.
These C5 mostly overwinter and produce short-lived, non-feeding males and smaller females, which reproduce after their third growthj season;
More difficult to explain are the large females found at the end of the summer bloom. They could be females that molted too late in the spring to reproduce and so fattened all summer, perhaps spawning for the first time in mid-winter after their fourth growth season, or conceivably they could be iteroparous individuals preparing to spawn for the second time.
The authors have emphasized lipid storage for later use as an energy and materials pool during starvation as an important survival strategy for zooplankton at high latitudes. As a second and perhaps equally important strategy, many zooplankton species have adopted some form of resting stage. At lower latitudes, a number of coastal species produce ''diapause'' eggs, which can survive long periods of harsh environmental conditions, usually in the bottom mud (see Grice & Marcus, 1981; Marcus, 1990), but such adaptations are not known for polar zooplankton. Diapause was defined by Andrewartha (1952) as '' a stage in the development of certain animals during which morphological growth and development is suspended or greatly retarded". The term has been applied to fresh water cyclopoid copepods that remain inactive, with or without encystment, in the sediment over winter or during other unsuitable periods (Elgmork, 1955) and to marine calanoids (Carlisle & Pitman, 1961), who obtained some evidence for hormonal control of metabolism in Calanus finmarchicus and Euchaeta norvegica. Evidence for some form of seasonally induced ''resting'' stage has been obtained for the arctic species Calanus hyperboreus (Conover & Corner, 1968; head & Conover, 1983; Head & Harris, 1985) and Calanus glacialis (Arashkevich & Kosobokova, 1988 such as seeking deep water, regulaying buoyancy, reducing activity and metabolism, changing the metabolic substrate oxidised during respiration, and lowering levels of digestive enzymes and gut peristalsis.
On the basis of these limited obsevations of polar zooplankton communities in the dark season, there is nonetheless considerable evidence of biological activity in winter, much of which we do not fully understand.
|
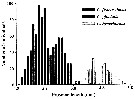 Issued from : G.J. Parent, S. Plourde & J. Turgeon in J. Plankton Res., 2011, 33 (11). [p.1658, Fig. 2]. Prosome length overlap among three Calanus species, stage V, along the Canadian Arctic and Atlantic Coasts when all stations from both years are pooled (N = 1159) . Issued from : G.J. Parent, S. Plourde & J. Turgeon in J. Plankton Res., 2011, 33 (11). [p.1658, Fig. 2]. Prosome length overlap among three Calanus species, stage V, along the Canadian Arctic and Atlantic Coasts when all stations from both years are pooled (N = 1159) .
See Stations' chart to Calanus finmarchicus. |
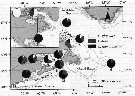 Issued from : G.J. Parent, S. Plourde & J. Turgeon in Limnol. Oceanogr., 2012, 57 (4). [p.1059, Fig. 1]. Issued from : G.J. Parent, S. Plourde & J. Turgeon in Limnol. Oceanogr., 2012, 57 (4). [p.1059, Fig. 1].
Map of the Arctic and North Atlantic Ocean showing the frequency of parental species and hybrids (as determined with mtDNA markers) at each station. |
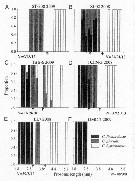 Issued from : G.J. Parent, S. Plourde & J. Turgeon in J. Plankton Res., 2011, 33 (11). [p.1659, Fig. 3]. Issued from : G.J. Parent, S. Plourde & J. Turgeon in J. Plankton Res., 2011, 33 (11). [p.1659, Fig. 3].
Spatial variability in the extent of prosome length overlap among Calanus species.
Arrows indicate ODPL (the optimized discriminant prosome length). For each station, the number of individuals (N) are given, respectively, for C. finmarchicus, gnacialis, hyperboreus (See Chart , fig.1).
Rem.: At each station, the authors used discriminant analyses to define prosome lengths that minimize species misidentification. Discriminant analysis aims at establishing rules for allocating individuals to a priori defined groups (here, species based on molecular-based identyification) using information provided by one or several characteristics (here, prosome length) of each individual (see Der & Everitt, 2002). ODPL is used to assess concordance between molecular-based and size-based identification and calculate the species diagnosis error rate. |
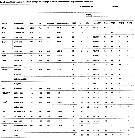 Issued from : G.J. Parent, S. Plourde & J. Turgeon in J. Plankton Res., 2011, 33 (11). [p.1657, Table II]. Issued from : G.J. Parent, S. Plourde & J. Turgeon in J. Plankton Res., 2011, 33 (11). [p.1657, Table II].
Sampling specifications and Calanus hyperboreus prosome length (PL mm) at each station based on genetic species identification overlap between Calanus hyperboreus (H) Calanus glacialis (G), C. fiunmarchicus (F), as FG, GH and FH.
For each pair of species PL overlap (%) is the ratio of PL overlap (mm) over the total PL range (mm) of both species. FG, GH and FG indicate pairwise species PL overlap.
Samp depth, sampling depth; N/S, species PL range was not subsampled; N/A, species was absent from the sample.
a Stations used to test inter-annual variability.
b Stations TCEN-2 (2009) and RCEN-3 (2008) are 19 km apart and were used as temporal replicates. |
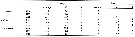 Issued from : E.F. Møller & T.G. Nielsen in Limnol. Oceanogr., 2019, 9999. [p.8, Table 5]. Issued from : E.F. Møller & T.G. Nielsen in Limnol. Oceanogr., 2019, 9999. [p.8, Table 5].
Average biomass (mgC m-3) of Calanus finmarchicus, C. glacialis and C. hyperboreus in May and June 1996, 1997, and 2008 in Disko Bay (W Greenland).
SD = standard deviation and n is number of samples.
Note the increase of the small species (C. finmarchicus contrary to the greatest (C. hyperboreus with the time due to the Atlantic waters inflow.
Nota; The target is the study of the climatic change with less sea ice and a modification of the copepod species' composition, therefore the food-web modifications.
See in the same authors Calanus finmarchicus and Calanus glacialis. |
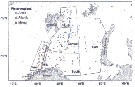 Issued from : J.M. Aarflot, H.R. Skjoldal, P. Dalpadado & M. Skern-Mauritzen in ICES J. Mar. Sc., 2018, 75 (7). [p.2344, Fig.1]. Issued from : J.M. Aarflot, H.R. Skjoldal, P. Dalpadado & M. Skern-Mauritzen in ICES J. Mar. Sc., 2018, 75 (7). [p.2344, Fig.1].
Geographical distribution of samples analysed in this study (n = 616). The Barents Sea was divided into five oceanographic regions with dominating water mass and bottom depth (mean of sampling stations in m) (West: 70-75°N, 15.5-21°E : Atlantic; South: 70-73.5°N, 21-40°E : Atlantic; Central: 74-78°N, 21-38°E : Arctic/mixed; North: 78-80°N, 25-36°E : Arctic/mixed; East: 71-80°N, 41-61°E : Arctic/mixed.
Outer bounds of the polygons are included as a visual aid. Samples were defined as Artic (T >0°C), Atlantic (T >3°C), or mixed (0°CThe Fugløya-Bear transect (FB transect: grey line in the figure) is a standard oceanographic transect in the western region covered five to eight times each year. Samples are regularly processed for species identification, and have consistent seasonal coverage since 1995.
For the authors, Calanus spp. are crucial prey for fishes, seabirds and mammals in the Barents Sea ecosystems, as in the Northwern Atlantic. The objective is to determine the respective contribution of the main pelagic copepods, Calanus finmarchicus, C. hyperboreus, C. glacialis collected over 30-year period. These copepods constitute around 80 % of the total. Though the Calanus species co-occur in most regions, C. glacialis dominates in the Artic waters, while C. finmarchicus dominates in Atlantic waters. The larger (in size) C. hyperboreus has considerably lower biomass in the Barents Sea, than the other Calanus species
In the western area of the Barents Sea , the authors observe indications of an ongoing borealization of the zooplankton community, with a decreasing proportion of C. glacialis over the past 20 years, and the Atlantic C. finmarchicus have increased during the same period.
See figures and Tables in the same authors for C. finmarchicus an and C. glacialis. |
| | | | Loc: | | | Arct. (all polar Basins), Fletcher's Ice Is., Resolute Passage, Devon Island, Nansen Basin, Pechora Sea, Kara Sea, Laptev Sea, Lomonosov Ridge, Chukchi Sea, SE Beaufort Sea, Amundsen Gulf, Canada Basin, Foxe Basin, Amundsen Gulf, Barrow Strait, Fram Strait, Jones Sound, Canadian abyssal plain, Barrow Strait, N Baffin Sea, Nuuk, Disko Bay, off shore Godthabsfjord, Labrador Sea, Davis Strait, Newfoundland, Greenland Sea, Fram Strait, Wyville Thomson Ridge, Kongsfjorden (Spitzbergen), Iceland, Faroe, Bear Island, Rijpfjordden, Norway Sea, W Norway (Korsfjorden, Malangen fjord), Barents Sea, Franz Josef Land, off W Ireland, Shetland Is., North Sea, NW Atlant., off Woods Hole, Gulf of Maine, Bay of Fundy, off SE Nova Scotia, Roseway Basin, Northumberland Strait, Browns Bank, Emerald Bank, St Georges Bay, Baie des Chaleurs, G. of St. Lawrence, upper St. Lawrence estuary, Sargasso Sea (in Grice & Hart, 1962; Deevey & Brooks, 1977: depth range 500-1000 m at Station "S": 32°10'N, 34°30'W); off E Cape Cod (42*N, 64°30'W) Harding, 1974, off coast of southern Morocco (in Somoue & al, 2005 and El Arraj & al, 2017, but needs confirmation) | | | | N: | 290 ? | | | | Lg.: | | | (7) F: 9-7,5; (22) F: 10-7; M: 7-5; (47) F: 9,6-6,9; (65) F: 9; M: 6,5; (131) F: 10-7; M: 7-5; (328) F: ± 6,77; (790) F: 8,7-5,3; M: 6,77-5,55; (1099) F: 6,25-10,0; {F: 5,30-10,00; M: 5,55-7,00}
The mean female size is 8.073 mm (n = 14; SD = 1.5763), the mean male size is 6.387 mm (n = 6; SD = 0.9379. The size ratio (male : female) is 0.79. | | | | Rem.: | epi-bathypelagic. Overall Depth Range in Sargasso Sea: 500-1500 m (Deevey & Brooks, 1977, Station "S': Rem: submergent species at Station "S"); 2000-1000 m (slope) Harding, 1974..
No doubt mistakenly reported in the Mediterranean Sea and in the Pacific.
Reported far south from its natural area, its abundance seems to have increased in the NW Atlantic by 39°N (Johns & al., 2001). Observed at 11 coastal stations in March from the southern Morocco.
After Hirche (2013, p.2469) females collected in October produced up to 1,000 eggs and had a maximum lifespan of 164 days without feeding, whereas fed females produced up to ca. 6,000 eggs and survived up to 806 days. These females are multiannual-iteroparous, i.e. capable to spawn in successive years, which would be unique for calanoid copepods. There was no difference in the timing of reproductive activity between females from the West Spitsbergen Current and the Greenland Sea Gyre. Fed and starved females collected in May and June began to spawn circa 2 and 4 months after collections, respectively, whereas females collected in August and October started spawning at the same time, in the middle of October. This indicates initiation of reproductive activity in the field in August, coincident with the descent into deep waters. The large size of females, robutness and combination of different types of diapause in their life cycle make C. hyperboreus a good model organism to study diapause controm mechanisms.
For Grice & Hart (1962, p.295) this cold-water form has seldom been reported from neritic waters south of Cape Cod, appeared in the surface slope waters only during the winter cruise (March).
For Marshall & Orr (1972, p.8) this species is considerably larger than C. finmarchicus (female 7-9 mm) and the corners of the last metasome segment are pointed. The row of teeth on the inner margin of the coxa of P5 does not reach the distal end of the segment. The eggs are large, 200-300 µm and orange-red in colour.
For Ostenfeld (1913) the oxygen consummated by adult was 0.68 µl /animal/hour.
Caution:
After Batnes & al (2015, p.60) the recent investigations have described large rates of misidentification using prosome length (see Kwasniewski & al., 2003; Lindeque & al., 2004; Parent & al., 2011; Gabrielsen & al., 2012). These arctic species of Calanus have been found to have a high frequency of hybridisation (see Parent & al., 2012).
After Karnovsky & al., 2003 (p.289, Appendix 2) from Arctic, the mean dry mass (mg) female is 3.293; CV: 1.137; CIV: 0.350. The mean length prosome (mm): female: 6.72; CV: 4.92; CIV: 3.52.
The feeding mode after Barton & al. (2013, Table 1) is 'feeding current' (hovering) (See definition in Rem. Centropages typicus). | | | Last update : 25/10/2022 | |
|
|
 Any use of this site for a publication will be mentioned with the following reference : Any use of this site for a publication will be mentioned with the following reference :
Razouls C., Desreumaux N., Kouwenberg J. and de Bovée F., 2005-2026. - Biodiversity of Marine Planktonic Copepods (morphology, geographical distribution and biological data). Sorbonne University, CNRS. Available at http://copepodes.obs-banyuls.fr/en [Accessed July 12, 2026] © copyright 2005-2026 Sorbonne University, CNRS
|
|
|
|




;)
;)
;)
;)
;)
;)
;)
;)
;)
;)
;)
;)
;)
;)
;)
;)
;)
;)
;)
;)
;)
;)
;)
;)
;)
;)
;)
;)
;)
;)
;)
;)
;)
;)
;)
;)
;)
;)
;)
;)
;)
;)
;)
;)
;)
;)
;)
;)
;)
;)
;)
;)
;)
;)
;)
;)
;)
;)
;)
;)
;)
;)