|
|
 |
|
Calanoida ( Order ) |
|
|
|
Calanoidea ( Superfamily ) |
|
|
|
Calanidae ( Family ) |
|
|
|
Calanus ( Genus ) |
|
|
| |
Calanus marshallae Frost, 1974 (F,M) | |
| | | | | | | Syn.: | ? Calanus finmarchicus : ? Minoda, 1958 (p.253, Table 1); M.W. Johnson, 1961 (p.311, Table 2); | | | | Ref.: | | | Frost, 1974 (p.77, figs.F,M); Gardner & Szabo, 1982 (p.136, figs.F,M); Brodsky & al., 1983 (p.158, figs.F,M, Rem.); van der Spoel & Heyman, 1983 (p.62, fig.78); Bradford, 1988 (p.76, Rem.); Bucklin & al., 1995 (p.658); Chihara & Murano, 1997 (p.738, Pl.66: F,M); Sundt & Melle, 1998 (p.207, fig.2, 3, Rem: mitochondrial sequence); Hill & al., 2001 (p.279, fig.2: phylogeny) | 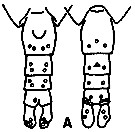 issued from K. Hulsemann in Invert. Taxon., 1994, 8. [p.1477, Fig.28, A]. Female: A, urosome (left: ventral); right: dorsal). Pore signature schematic by pooled samples (symbols are considerably larger than pores): Filled circle: 100 % presence; open circle: 95-99 % presence; triangle: 50-89 % presence. n = 95.
|
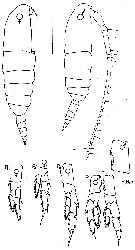 issued from : G.A. Gardner & I. Szabo in British Columbia Pelagic Marine Copepoda. Canadian Spec. Publ. Fish. Aquat. Sc., 1982, 62. [p.137]. After Woodhouse, 1971. Female and Male. P5Bp1 : basipodite 1 of P5 ( with inner margin denticulate)
|
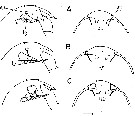 issued from : B.W. Frost in Mar. Biol., 1974, 26. [p.79, Fig.2]. Female: Forehead (right lateral and ventral view), showing accessory ohotoreceptor (ap) and lateral gland (lg) in lateral views only. Nauplius eye is indicated (in ventral views only) by dotted lines. Comparison between Calanus finmarchicus (A), Calanus glacialis (B) and Calanus marshallae (C). Scale bar: 0.1 mm. Nota: The size of the accessory photoreceptor in both sexes is relatively much larger in Calanus marshallae; this diagnostic diffarence is evident in immature stages (Copepodid III-V).
|
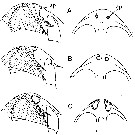 issued from : B.W. Frost in Mar. Biol., 1974, 26. [p.79, Fig.3]. Male: Forehead (right lateral and ventral view), showing accessory photoreceptor (ap). Comparison between Calanus finmarchicus (A), Calanus glacialis (B), and Calanus marshallae. (C). Scale bar: 0.1 mm.
|
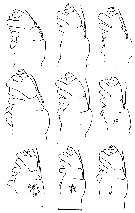 issued from : B.W. Frost in Mar. Biol., 1974, 26. [p.92, Fig.18]. Female: Right Mx2 (right lateral view). Comparison between Calanus finmarchicus (top row), Calanus glacialis (middle row) and Calanus marshallae (bottom row). Scale bar: 0.1 mm. Nota: Mx2 of Calanus marshallae nearly always (50 of 51 randomly selected specimens) has a circular cluster of wide, flat, hyaline spinules on the outer proximal surface; this surface on Mx2 of C. finmarchicus and C. glacialis is usually devoid of spinules (43 of 51 specimens, 37 of 45 specimens, respectively) or if present, the spinules are slender and minute..
|
 issued from : B.W. Frost in Mar. Biol., 1974, 26. [p.91, Fig.17]. Female: Anal segment and caudal rami (cr, dorsal view). Comparison between Calanus finmarchicus (A), Calanus glacialis (B) and Calanus marshallae (C). Scale bar: 0.1 mm. Nota: The caudal ramus length in Calanus marshallae is approximately twice the caudal ramus width, but less than the width of the anal segment; in both Calanus finmarchicusCalanus glacialis the length of the caudal ramus is usually more than twice the width of the caudal ramus and about equal to the width of the anal segment.
|
 issued from : B.W. Frost in Mar. Biol., 1974, 26. [p.80, Fig.4]. Female: Posterolateral margin of thoracic segment 5 and genital segment (gs) (right lateral view). Comparison between Calanus finmarchicus (A), Calanus glacialis (B) and Calanus marshallae (C). Scale bar: 0.1 mm.
|
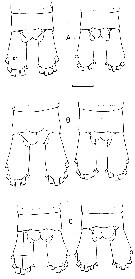
 issued from : B.W. Frost in Mar. Biol., 1974, 26. [p.87, Fig.10]. Female: basipod and endoodite 1 of left P5 (anterior view). Comparison between Calanus finmarchicus (A), Calanus glacialis (B) and Calanus marshallae (C). Scale bar: 0.1 mm. Nota: In all 3 species, the denticulate medial margin of basipodite 1 of P5 has a variable number, spacing and size of denticles, so that the species cannot be routinely identified by the characters; nevertheless, there is a clear statistical trend in the number of denticles on the basipodite 1, with C. marshallae having the lowest average number and C. finmarchicus having the highest. m = mean number of denticles, se = standard error, n = number of specimens examined. C. finmarchicus: m = 34,71, se = 0,40, n = 139. C. glacialis: m = 30,20, se = 0,34, n = 131. C. marshallae: m = 26,15, se = 0,43, n = 81. C. marshallae exhibits the medial denticulate margin of the basipodite 1 usually markedly concave, so that the species is indistinguishable fro C. glacialis in this. Also, like C. glacialis, the spiniform process on the distal anterior margin of basipodite 2 of is thick and blunt on the right or left leg and the outer distal corner of endopodite 1 is usually narrowly tapered and sharply pointed. However, in contrast to C. glacialis, the medial margin of basiopdite 2 in C. marshallae tends to be convex, although not so curved as in C. finmarchicus. Thus, the P5 index (deviation of basipodite 2 - deviation of basipodite 1) for C. marshallae is intermediate between those of C. finmarchicus and C. glacialis, so that the average C. marshallae female is intermediate in size between them (see table 3 below)
|
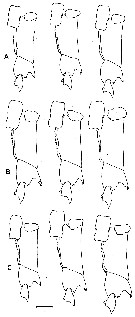
 issued from : B.W. Frost in Mar. Biol., 1974, 26. [p.89, Fig.14]. Male: left P5 (anterior view). Comparison between Calanus finmarchicus (A), Calanus glacialis (B) and Calanus marshallae (C). Scale bar: 0.1 mm. Nota: The structure of the P5 of C. marshallae is intermediate between C. finmarchicus and C. glacialis, although tending toward the former, but the lengths of exopodite 1 and exopodite 2 fall along dixtinct regression lines when plotted against prosome length (Fig. 20A,B). The significance of these differences in lengths of exopod 1 and exopod 2 among the 3 species is highlighted by the lack of similar displacements in length measurements of any other basipodal, exopodal or endopodal segment of the right or left P5 when plotted against prosome length (Fig.20C). Because in Fig.20A,B the lengths of exopod 1 and exopod 2 of C. marshallae overlap both C. finmarchicus and C. glacialis, there is no mesural characteristic of the P5 which can be used absolutely to distinguish adult males of C. marshallae from the two species.. As in the female, the length range of the male of C. marshallae broadly overlaps those of C. finmarchicus and C. glacialis (Table 3).
|
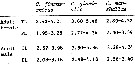 issued from : B.W. Frost in Mar. Biol., 1974, 26. [p.87, Table 3]. Female and Male. Range of total length (TL, mm) and prosome length (PL, mm). These data represent extremes of length measurements found in all material examined. Total length measured laterally from the anterior margin of the head to the posterior margin of the caudal ramus (excluding setae)
|
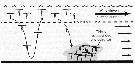
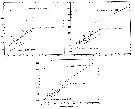 issued from : B.W. Frost in Mar. Biol., 1974, 26. [p.93, Fig.20]. A: length of exopodite 1 of male left P5 plotted against prosome length (open squares, C. marshallae) B: length of exopodite 2 of male left P5 plotted against prosome length (symbols as in A) C: length of exopodite 3 of male right P5 plotted against prosome length (symbols as in A). In all three graphs, thin lines are regression lines for C. finmarchicus (lower line) and C. glacialis (upper line). Prosome length measured laterally from the anterior margin of the head to the posterolateral margin of 5th thoracic segment.
| | | | | Compl. Ref.: | | | Sullivan & al., 1975 (p.176); Peterson & Miller, 1976 (p.14, Table 1, 2, 3, abundance vs interannual variations); 1977 (p.717, Table 1, seasonal occurrence); Peterson & al., 1979 (p.467, Table 1, 2, fig.12, 13,14, 15); Peterson, 1980 (p.1, life history); Nishiyama & Hirano, 1983 (p.159, Table 4: length-weight); Springer & al., 1989 (p.359, Fig.5, 10, 12, 15, 16, Table 1, 2) , Mackas & Sefton, 1982 (p.1173, Table 1); Springer & Roseneau, 1985 (p. 231, tab.1, 2, 3); Vidal & Smith, 1986 (p.523, Table 1, biomass); Smith & Vidal, 1986 (p.215, Table 6, 7, fig. 9, abundance): Mackas & Anderson, 1986 (p.115, Table 2); Peterson, 1986 (p.61, growth, development); 1988 (p.229, egg production); McLaren & al., 1988 (p.275, DNA content, development rate: egg-nauplius); Ellis & Small, 1989 (p.175, gut evacuation rates); Coyle & al., 1990 (p.763); Shih & Marhue, 1991 (tab.2, 3); Huntley & Lopez, 1992 (p.201, Table 1, A1, eggs, egg-adult weight, temperature-dependent production); Osgood & Frost, 1994 (p.627, life history, vertical migration); Mauchline, 1998 (tab.27, 33, 45, 47, 48, 51, 58, figs.66, 68); Tsuda & Miller, 1998 (p.713, mate-behaviour); Gomez-Gutiérrez & Peterson, 1999 (p.637, Table I, II, III, VI, figs.4, 5, 6, 7, abundance, egg production); Russell & al., 1999 (p.77, tab.1); Huggett & Richardson, 2000 (p.1843, tab.2); Lenz & al., 2000 (p.338); Mackas & al., 2001 (p.685, Tab. 3, 6, fig.3: interannual changes in species composition); Peterson & al., 2002 (p.353); Peterson & al. (p.381, Table 2, fig.6, interannual abundance); Mackas & Galbraith, 2002 (p.725, tab.2a, 2b); 2002 a (p.423 (Table 2; Coyle & Pinchuk, 2002 (p.177, figs. 2, 3, 4, Table 4, 5, annual variation); Napp & al., 2002 (p.5991, Table 1, fig.5, interannual variation); Baier & Napp, 2003 (p.771); Peterson & Keister, 2003 (p.2499, interannual variability); Keister & Peterson, 2003 (p.341, Table 1, 2, abundance, cluster species vs. hydrological events); Park, W & al., 2004 (p.464, tab.1); Mackas & al., 2004 (p.875, Table 2); Baier & Terazaki, 2005 (p.1113, fig.4); Lamb & Peterson, 2005 (C10); Plourde & al., 2005 (p.3411, egg production vs. season and region); Coyle, 2005 (p.77, fig.7,9, tab.2,3,4); Mackas & Coyle, 2005 (p.707, fig.7, 8); Mackas & al., 2005 (p.1011, 1021, tab.2); Miller C.B., 2005 (p.142, Box Fig. 7.4.1.: gut pigment content, p.163: mate behavior); Mackas & al., 2006 (L22S07, Table 2); Hooff & Peterson 2006 (p.2610); Ware & McQueen, 2006 (p.28, Table B1, weight ranges); Lewis & al., 2006 (p.501, Table I); Deibel & Daly; 2007 (p.271, Table 4, Rem.: Arctic polynyas); Mackas & al., 2007 (p.223, climatic change index); Titelman & al., 2007 (1023, Table I, Rem: mating); Humphrey, 2008 (p.83: Appendix A); Liu & Hopcroft, 2008 (p.930: fig.7); Coyle & al., 2008 (p.1775, Table 3, 4, 5, 6, 7, 8, fig.11, abundance): Walkusz & al., 2008 (p.1, Table 3, abundance); Darnis & al., 2008 (p.994, Table 1, figs.8, 9); Miller C.B., 2008 (p.332, fig.3: growth vs. time); Peterson, 2009 (p.73, Rem.: p.74, 78, indicator of long-term changes); Hopcroft & al., 2009 (p.9, Table 3); Galbraith, 2009 (pers. comm.); Lewis & al., 2010 (p.695, Table I); Homma & Yamaguchi, 2010 (p.965, Table 2); Hopcroft & al., 2010 (p.27, Table 1, 2); Matsuno & al., 2011 (p.1349, Table 1, abundance vs years); Batten & Walne, 2011 (p.1643, Table I, abundance vs temperature interannual variability); Keister & al., 2011 (p.2498, interannual variation); Homma & al., 2011 (p.29, Table 2, 3, 4, abundance, feeding pattern: suspension feeders); Bi & al., 2011 (L12607, time series vs decadal oscillation); Matsuno & al., 2012 (Table 2); Ji & al., 2012 (p.40, Table 2, fig.5, 6 life history, biogeography); DiBacco & al., 2012 (p.483, Table S1, ballast water transport); Volkov, 2012 (p.474, Table 6, fig.7, 15, abundance, distribution, interannual variation); Takahashi M. & al., 2012 (p.393, Table 2, water type index); Irvine & Crawford, 2013 (p.1, Rem.: p.59, anomaly time series); Batchelder & al., 2013 (p.34, Rem.: p.42, 44); Barton & al., 2013 (p.522, Table 1: metabolism, diapause, population dynamic, feeding mode, biogeo); Baumgartner & al., 2013 (p.267, abundance vs whale nutrition, vertical distribution, patchiness); Coyle & al., 2014 (p.97, table 7, 9, 14, 15); Chiba S. & al., 2015 (p.968, Table 1: length vs climate); Ohtsuka & Nishida, 2017 (p.583, Rem.); Record & al., 2018 (p.2238, Table 1: diapause); Hirai & al., 2020 (p.1, Fig. 5: cluster analysis (OTU), spatial distribution).
| | | | NZ: | 3 | | |
|
Distribution map of Calanus marshallae by geographical zones
|
| | | 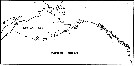 issued from : B.W. Frost in Mar. Biol., 1974, 26. [p.94, Fig.21]. issued from : B.W. Frost in Mar. Biol., 1974, 26. [p.94, Fig.21].
Occurence of Calanus marshallae in plankton samples. |
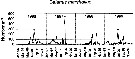 Issued from : W.T. Peterson, J.E. Keister & L.R. Feinberg in Prog. Oceanogr., 2002, 54. [p.390, Fig.6]. Issued from : W.T. Peterson, J.E. Keister & L.R. Feinberg in Prog. Oceanogr., 2002, 54. [p.390, Fig.6].
Abundance (number per cubic meter) of C. marshallae at the station NH5 (off Newport, Oregon, at depth 30 m) from May 1996 through September 1999, during El Niño event in 1997-98, the largest of the century.
Nota: The radical changes in community composition observed with the onset of the El Niño were driven in part by the dramatic declines in the abundance of two of the dominant local boreal copepod species, C. marshallae and Pseudocalanus mimus (see fig.), from September 1997 through July 1998. Prior to the beginning of the El Niño in 1997, these two boreal species began to increase in abundance in April and by May, the marshallae population had reached 150 ind/m3, and mimus 2500 ind/m3. These values are higher than our 8-year climatology values of 75 and 1500/m3, respectively. Their abundances declines during May/June 1997 downwelling event, rebounded during the brief July/August upwelling period, but then declined to near zero with the onset of downwelling in late-August1997. Their abundances remained persistently low throughout the winter of 1997/98 and most 1998.
Another factor contributing to changeds in community structure during the El Niño period was that C. marshallae and P. mimus were replaced by two warm-water species, C. pacificus (an offshore California Current species) and Paracalanus parvus (a subtropical neritic species). Several other warm-water copepod species occurred commonly during the El Niño period; two of these species, Ctenocalanus vanus and Corycaeus anglicus became common after late August 1997, and were among the most abundant species in the Oregon coastal zone. The boreal coastal copepod species began to recover in July/August of 1998, 11 months after the onset of the El Niño event. C. marshallae numbers began to increase in July and the population appeared to have recovered from the effects of the El Niño by August 1998.
During El Niño events, the position of the California Current appears to have shifted northward by several hundred kulometers. Thus at the northern end of the Current (Oregon north to Vancouver Island) warm water species displaced boreal species and at the southern end (Baja California) tropical/equatorial species displaced subtropical species. |
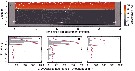 Issued from : M.F. Baumgartner, N.S.J. Lysiak, H.C. Esch, A.N. Zerbini, C.L. Berchok & P.J. Clapham in Mar. Ecol. Prog. Ser., 2013, 490. [p.280, Fig.7]. Issued from : M.F. Baumgartner, N.S.J. Lysiak, H.C. Esch, A.N. Zerbini, C.L. Berchok & P.J. Clapham in Mar. Ecol. Prog. Ser., 2013, 490. [p.280, Fig.7].
Calanus marshallae and Eubalaena japonica (right whale). (a) Dive profile (white line) of the single tagged right whale shown with temperature sampled at 3 stations along the whale's swim track in the southeastern Bering Sea during early August 2008 . The sea floor is indicated by the heavy black line.
(b-d) OPC-derived vertical distribution of C. marshallae (gray bars) and chlorophyll fluorescence (purple line in relative units) at the 3 stations along the tagged whale's swim track; each station location was chosen near the tagged whale at the corresponding time indicated just above the sea floor in (a). |
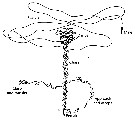
 Issued from : M.F. Baumgartner, N.S.J. Lysiak, H.C. Esch, A.N. Zerbini, C.L. Berchok & P.J. Clapham in Mar. Ecol. Prog. Ser., 2013, 490. [p.282, Fig.8]. Issued from : M.F. Baumgartner, N.S.J. Lysiak, H.C. Esch, A.N. Zerbini, C.L. Berchok & P.J. Clapham in Mar. Ecol. Prog. Ser., 2013, 490. [p.282, Fig.8].
Calanus marshallae. Hypothesized aggregation of individuals at depth.
Copepods discover and remain within discrete resuspended ('clouds' of settled phytoplankton (phytodetritus) during vertical forays from the surface layer. Because the wind-driven surface currents are faster than those at depth, a continuous supply of copepods is available in the surface layer to populate the cloud. |
 Issued from : T. Yoshiki, B. Yamanoha, T. Kikuchi, A. Shimizu & T. Toda in Mar. Biol., 2008, 156. [p.104, Table 4]. Issued from : T. Yoshiki, B. Yamanoha, T. Kikuchi, A. Shimizu & T. Toda in Mar. Biol., 2008, 156. [p.104, Table 4].
Egg development time and egg sinking rate of three Calanus species. |
 Issued from : H. Saito & A. Tsuda in Deep-Sea Res. I, 47. [p.2146, Table I]. Issued from : H. Saito & A. Tsuda in Deep-Sea Res. I, 47. [p.2146, Table I].
Egg diameter and prosome length (PL) of females of Calanus marshallae after McLaren & al., 1988, N.
Nota: Compare with N. cristatus, N. tonsus and N. flemingeri and others species in genus Calanus. |
 Issued from : C.B. Miller in Biological Oceanography 2004/2005, Blackwell Publishing. [p.163, Fig.8.1]. After Tsuda & Miller, 1998. Issued from : C.B. Miller in Biological Oceanography 2004/2005, Blackwell Publishing. [p.163, Fig.8.1]. After Tsuda & Miller, 1998.
Mate finding behavior in Calanus marshallae.
The female slowly sinks, leaving a vertical trail of pheromone. The male searches horizontally for trails. When he finds one, he does a lively dance in a space about 12 cmm across, then follows the trail down to the female. He bumps her, she moves, he follows, eventually there is an embrace and spermatophore transfer. |
| | | | Loc: | | | Spitsbergen, St. Lawrence Island, Chukchi Sea, Bering Sea (slope and shelf), Anadyr Strait, Shpanberg Strait, Chucki Sea, SE Beaufort Sea, Banks Is., Bering Sea, S Aleutian Basin, S Aleutian Is., G. of Alaska, British Columbia, Fjord system (Alice Arm & Hastings Arm), Portland Inlet, Dabob Bay, Hecate Strait, Vancouver Is., off Washington coast, Oregon (coast, off Newport). | | | | N: | 70 | | | | Lg.: | | | (329) F: 4,52-2,89; M: 4,24-3,28; (1041) F: 3,27; {F: 2,89-4,52; M: 3,28-4,24}
Chiba S. & al., 2015 (p.971, Table 1: Total length female (June-July) = 4.0 mm [optimal SST (°C) = 5.3]. | | | | Rem.: | For Frost (1974, p.90) this species is most easily vharacterized by descibing it in direct comparison with Calanus finmarchicus and Calanus glacialis. The new species and Calanus glacialis are very similar in body form, including the outline of the ventral surface of the genital segment in lateral view and the shape of the posterolateral margin of the 5th thoracic segment. These features immediately distinguish C. marshallae from C. finmarchicus. C. marshallae and C. finmarchicus do not co-occur, although there are a few reliable records of adult females of C. finmarchicus in the central Arctic Ocean and C. marshallae may be transported north of the Bering Strait. Woodhouse (1971) found that C. marshallae and C. pacificus (a species of the C. helgolandicus group) co-occur along the west coast of North America approximately between Latitudes 40° and 50° N.
The feeding mode after Barton & al. (2013) is 'feeding current' (hovering) (see definition in Rem. Centropages typicus). | | | Last update : 02/01/2021 | |
|
|
 Any use of this site for a publication will be mentioned with the following reference : Any use of this site for a publication will be mentioned with the following reference :
Razouls C., Desreumaux N., Kouwenberg J. and de Bovée F., 2005-2026. - Biodiversity of Marine Planktonic Copepods (morphology, geographical distribution and biological data). Sorbonne University, CNRS. Available at http://copepodes.obs-banyuls.fr/en [Accessed June 17, 2026] © copyright 2005-2026 Sorbonne University, CNRS
|
|
|
|


;)
;)
;)
;)
;)
;)
;)
;)
;)
;)
;)
