|
|
 |
|
Calanoida ( Order ) |
|
|
|
Calanoidea ( Superfamily ) |
|
|
|
Calanidae ( Family ) |
|
|
|
Neocalanus ( Genus ) |
|
|
| |
Neocalanus plumchrus (Marukawa, 1921) (F,M) | |
| | | | | | | Syn.: | Calanus plumchrus Marukawa, 1921 (p.10, figs.F); Motoda & al., 1950; Nakai, 1955 (p.12, chemical composition); Tanaka, 1956 (p.255, figs.F, Rem.); 1956 a (p.49, figs.F, Rem.); Minoda, 1958 (p.253, Table 1, 2, abundance); Tanaka, 1960 (p.14: Rem.); Heinrich, 1962 (p.465, life history, production); Brodsky, 1962 c (p.97); Brodsky, 1964 (p.105, 107); Kitou, 1965 (p.95, Tables 1-5); Furuhashi, 1966 a (p.295, vertical distribution vs mixing Oyashio/Kuroshio region, Table 10); Fleminger, 1967 a (tabl.1); Minoda & Osawa, 1967 (p.9, vertical distribution); Jillett, 1968 (p.27, Rem.); Lubny-Gertzyk, 1968 (p.275); Corner & Cowey, 1968 (p.393, Table 6, fatty acid composition); Vinogradov, 1968 (1970) (p.32, 49, 51, 52, 56, 60, 61, 65, 86, 91, 94, 109, 221-222, 234, 243, 244, 256, 291); Park, 1968 (p.532, Rem.); Heinrich, 1968 (p.287, fig.1, 3); Jillett, 1968 (p.19, p.27: Rem.Mullin, 1969 (p.308, Table I: estimates of production); Omori, 1969 (p.5, Table 1); Morris, 1970 (p.2300); Vaupel-Klein, 1970 (p.3, 7); Shih & al., 1971 (p.144, 203); Minoda, 1971 (p.12); Tahuchi & Ishii, 1972 (p.419, respiration-excretion-grazing); Brodsky, 1972 (1975) (part., p.9, 69, 84, 121, figs.57 G, 73 e, 97); (part.) Kos, 1972 (1975) (p.128, figs.24 B, 25 B, 27 D); Vyshkvartzeva, 1972 (1975) (p.188, figs.); Fulton, 1973 (p.811, life history, egg production); Ikeda, 1974 (p.1, respiration, ammonia excretion rate); Vyshkvartzeva, 1976 (p.14); 1977 a (p.97, figs.); Peterson & Miller, 1975 (p.650); Sullivan & al., 1975 (p.176, figs.Md); Sargent, 1976 (p.149, lipids); Peterson & Miller, 1976 (p.14, Table 1, 2, abundance vs interannual variations); Mauchline & Nemoto, 1977 (p.109, figs.F, juv.: pattern of integumental organs); Peterson & Miller, 1977 (p.717, Table 1, seasonal occurrence); Ikeda, 1977 c (p.241, fig.1, 6, Table 1, respiration/excretion); Reeve & al., 1977 (p.105, mercury & copper vs. respiration & excretion); Gibson & Grice, 1977 (p.85, Table 1, copper pollution); Shih & Laubitz, 1978 (p.53); Yayanos & al., 1978 (p.257, pressure effect); (part.) Brodsky & al., 1983 (p.180, fig.80 except 3 P5 G); Springer & Roseneau, 1985 (p. 231, tab. 1, 2, 3); Gordon & al., 1985 (p.89, Table 3, fish diet); Fleminger, 1985 (p.275, 283, Table 1, fig.M); Kawamura & Hirano, 1985 (p.626, Table 1, fig.2, swarms); Sasaki al., 1988 (p.505, tab.1, fecal pellets flux); Odate & Maita, 1988 (p.228, Rem.: p.230); Zauke & al., 1996 (p.141, Table 7, metal bioaccumulation); Mauchline, 1998 (tab.19); Bragina, 1999 (p.195); Pinchuk & Paul, 2000 (p.4, table 1, % occurrence); Pinchuk & Paul, 2000 (p.4, table 1, % occurrence, figs.3 , 4, 5, 6, 9, 25: biomass); Campbell, 1929 (p.308); 1930 (p.178, fig.M); Brodsky, 1938; 1948; 1950 (1967) (part. f. typica, fig.22 M, Urosome form plumchrus); Tanaka, 1954 (part.) (p.29, figs.M); Park & al., 1991 (p.203, as tonsus) | | | | Ref.: | | | Bradford & Jillett, 1974 (p.6, fig.F); Gardner & Szabo, 1982 (p.144, figs.F,M); Bradford, 1988 (p.74, 76, 79, Rem.); Miller, 1988 (1989) (p.247, Descr., figs.F, M, Rem.); Nishida, 1989 (p.173, fig. 3, table 1, 2, 3: dorsal hump); Miller & al., 1990 (p.91, figs.: Md); Chihara & Murano, 1997 (p.740, tab.3, Pl.68: F,M); Bucklin & al., 1999 (p.239, molecular systematic); Heinrich, 2000 (p.1020, figs. juv.); Bucklin & al., 2003 (p.335, tab.2, fig. 2, Biomol.); Machida & al., 2006 (p.1071, tab.1,3, fig.3,4, molecular phylogeny) | 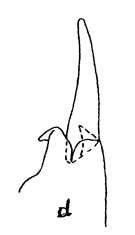 issued from : J.M. Bradford & J.B. Jillett in Crustaceana, 1974, 1. [p.10, Fig.1,d]. Female: d, outer distal part of exopod segment 1 of P2.
|
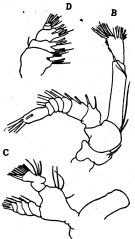 issued from : O. Tanaka in J. oceanogr. Soc. Japan, 1956, 12 (2). [p.51, Fig.4, B-D]. Female: B, A2; C, Md; D, Mx2.
|
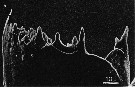
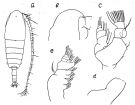 issued from : O. Tanaka in J. oceanogr. Soc. Japan, 1954, 10 (1). [p.32, Fig.2]. Ax Calanus tonsus. Male (from Japan Sea): a, habitus (dorsal); b, forehead (lateral); c, Md (mandibular palp); d, Md (distal edge of the mandibular blade); e, Mx2. Nota: Head and 1st thoracic segment separate, 4th and 5th separate. Head with a remarkable ridge on the mid-dorsal line, about the anterior 1/4 of the head. The posterior margin of the head distinctly produced in the mid-dorsal line (viewed from the lateral). The lateral corner of the last thoracic segment rounded, it extends posteriorly about to the middle of the genital segment. Rostrum with 2 slender filaments. Frontal organ slightly perceptible. Urosome (5-segmented) contained 3-times in the length of the cephalothorax. Proportional lengths of urosomites and furca 11:32:19:14:10:14 = 100. Genital opening on the left side of 1st segment. Furcal rami parallel, 1.34-times as long as wide. A1 (24-segmented, segments 1 & 2 fused) extends beyond the end of the furca by distal 4 segments. The mandibular blade edge soft-skined, with 4 reduced teeth.Mx1 with the 1st inner lobe devoided of seta, 2nd inner lobe with 2 short setae, 3rd inner lobe furnished with fine hairs on the inner margin with 4 rather ; 1st segment of endopod with 4 setae on the inner margin, 2nd segment with 3 setae, 3rd segment with 6 setae on the distal margin.; exopod with 11 setae; 1st outer lobe with 7 long and 3 short setae on the anterior margin; 2nd outer lobe naked.
|
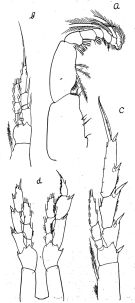 issued from : O. Tanaka in J. oceanogr. Soc. Japan, 1954, 10 (1). [p.33, Fig.3]. Ax Calanus tonsus. Male (from Japan Sea): a, Mxp; b, P1; c, P2; d, P5. Nota: The outer marginal spine of the 3rd segment of P2 to P4 divide the outer margin in the proportional lengths (a: proximal; b: distal): P2 (a = 22, b = 23); P3 (a = 28, b = 29); P4 (a = 32, b = 26). In P5 the 1st basal segment without inner marginal seta, the hairs on the inner margin absent; the right leg is about as long as the left leg.
|
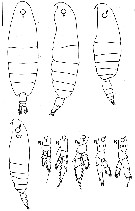 issued from : G.A. Gardner & I. Szabo in British Columbia Pelagic Marine Copepoda. Canadian Spec. Publ. Fish. Aquat. Sc., 1982, 62. [p.145]. After Marukawa, 1921; Pandyan, 1971. Female and Male; (L) = left leg; (R) = right leg.
|
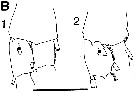
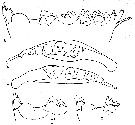
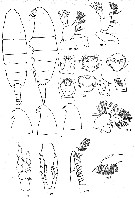
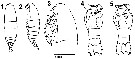 issued from : C.B. Miller in Prog. Oceanog., 1988 (1989), 20. [p.249, Fig.12]. Female: 1-2, habitus (dorsal and lateral, respectively, different specimen); 3, head (lateral), same specimen as 2; 4-5, urosome (ventral, showing seminal receptacles and antral opening muscles internally. Scale bar: 2.0 mm in 1 and 2; 0.9 mm in 3; 0.45 mm in 4 and 5.
|
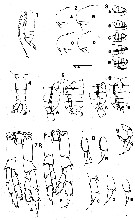
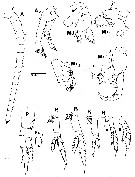 issued from : C.B. Miller in Prog. Oceanog., 1988 (1989), 20. [p.251, Fig.13]. Female: right A1 (ventral); right A2, Md, Mx1, Mx2, Mxp (all from medial aspect; P1 (anterior, with detail of endopodite segment 1); P2-P5 (anterior). Scale bar: 0.4 mm for A1 and P2-P5; 0.2 mm for all other figures.
|
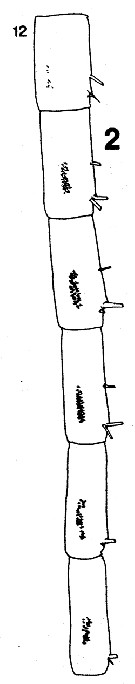 issued from : C.B. Miller in Prog. Oceanog., 1988 (1989), 20. [p.237, Fig.5]. Female: segments 12 to 17 from left A1. Nota: Robust denticles are in patches of two irregular rows (Compare with Neocalanus flemingeri). Segments 8 and 9 partly fused in N. plumchrus articulated in N. flemingeri.
|
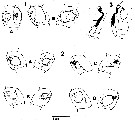 issued from : C.B. Miller in Prog. Oceanog., 1988 (1989), 20. [p.241, Fig.8]. Female: 1 A-B, seminal receptacles (ventral and lateral, respectively A and B); 2, variant shapes of seminal receptacles in four additional specimens showing left and right for each; 3, ventral (A) and ventro-lateral (B) aspects of attached spermatophore in same specimen.
|
 issued from : C.B. Miller in Prog. Oceanog., 1988 (1989), 20. [p.240, Fig.7 B]. Saccular organ near the base of exopodite segment 1 of P1. 1, Female; 2, Male. Nota: The roughly circular patches at the base of the organ are clearly the termination of a nerve.
|
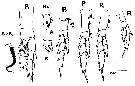
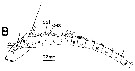
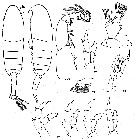
 issued from : C.B. Miller in Prog. Oceanog., 1988 (1989), 20. [p.254, Fig.15]. Male: 1, habitus (lateral); 2, forehead (from 4 specimens A-D); 3, seminal vesicle and spermatophore-forming organ in 5 specimens (A-E); 4, urosome (dorsal); 5, lateral (A) and dorsal (B) aspect of male reproductive system; 6, as 5 for another specimen; 7, P5 from two specimens (A and B); 8left exopodite segments 2 and 3 from 5 specimens (A-E); 9, left P5 in usual curled position. Scale bar: 2.0 mm for 1; 1.8 mm for 3; 0.94 mm for 5 and 6; 0.84 mm for 2; 0.5 mm for 4 and -9; 0.24 mm for 7 and 8.
|
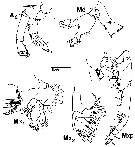
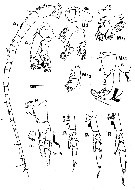 issued from : C.B. Miller in Prog. Oceanog., 1988 (1989), 20. [p.255, Fig.16]. Male: left A1 (ventral aspect); right A2 (medial view); right Md (medial aspect with separate gnathobase, posterior aspect; the arthrodial menbrane between the gnathobase and palp is very weak; and with detail of rotated endopodite to show palp on segment one; right Mx1, Mx2 and Mxp (medial aspects); left P1 (anterior); with details of endopodite segemnt 1 (Ri1) andmedial seta on basipodite 2 of P1 (Sm-B2)). Scale bar: 0.4 mm for A1, P1-P4; 0.2 mm for A2, Md, Mx1, Mx2, Mxp, P1.
|
 issued from : C.B. Miller in Prog. Oceanog., 1988 (1989), 20. [p.249, Table 7]. Female: Size and proportions from various locations: Station P (50°N, 145°W); PROBES: 54°N, 145°W). TL: total length from front of head to end of caudal rami; PL: prosome length from the anterior-most curve of the head to the posterior-most curve of thoracic segment 5, mostly measured in side view; CL: cephalosome length from front of head to posterior, dorsal edge of the segment bearing Mx2.
|
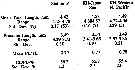 issued from : C.B. Miller in Prog. Oceanog., 1988 (1989), 20. [p.256, Table 8]. Male: Size and proportions from various locations: Station P (50°N, 145°W); KH-Japan Sea (38°-43°N, 136°-138°°W); KH-Western N. Pacific (41°-50°N, 154°-175°E). TL: total length from front of head to end of caudal rami; PL: prosome length from the anterior-most curve of the head to the posterior-most curve of thoracic segment 5, mostly measured in side view; CL: cephalosome length from front of head to posterior, dorsal edge of the segment bearing Mx2.
|
 issued from : C.B. Miller in Prog. Oceanog., 1988 (1989), 20. [p.264, Fig.22]. Copepodite 5: right A2 (medial aspect); right Md, lateral (palp) and anterior (gnathobase) aspects; right Mx1; left Mx2; right Mxp (medial aspects). Scale bar: 0.2 mm for A2, Md, Mx1, Mx2, Mxp. Nota: Each of the setae of the Mx2 bears two rows of setules set at an angle of about 110°. The medial setae are cosiderably longer and their setules are more closely spaced than in N. flemingeri
|
 issued from : C.B. Miller in Prog. Oceanog., 1988 (1989), 20. [p.264, Fig. 22]. Copepodite 5: P1 (anterior aspect with details showing variants of hair patch on endopodite 1: A-B; and setulation of medial seta on basipodite 2); P2-P5 (anterior aspects). Scale bar: 0.2 mm for P1; 0.4 mm for P2-P5.
|
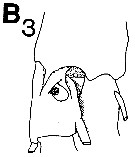 issued from : C.B. Miller in Prog. Oceanog., 1988 (1989), 20. [p.240, Fig.7 (B3)]. Copepodite 5: B3, saccular organ near the base of exopodite 1 of P1.
|
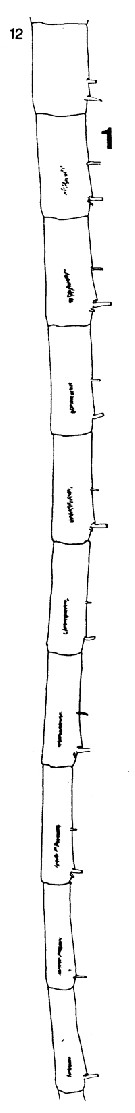 issued from : C.B. Miller in Prog. Oceanog., 1988 (1989), 20. [p.237, Fig.1]. Copepodite 5: 1, segments 12 to 21 from left A1 (ventral side to show groups of denticles.
|
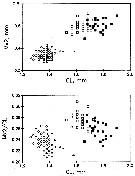 issued from : C.B. Miller in Prog. Oceanog., 1988 (1989), 20. [p.268, Fig.25]. Copepodite 5: Comparisons of the length of Mx2 to cephalosome length (CL) and ratio Mx2/CL: N. plumchrus (squares) and N. flemingeri (circles). CL = cephalosome length from front of head to posterior, dorsal edge of the segment bearing Mx2. N. plumchrus: white square: individuals from Station P; black square: from Bering Sea; N. flemingeri: white circle: individuals from Station P; white triangle: individuals from Bering Sea.
|
 issued from : C.B. Miller in Prog. Oceanog., 1988 (1989), 20. [p.268, Fig.25]. Copepodite 5: Comparisons of the width of the tooth row on the mandibular gnathobase to cephalosome length (CL) and ratio width/CL: N. plumchrus (squares) and N. flemingeri (circles). CL = cephalosome length from front of head to posterior, dorsal edge of the segment bearing Mx2. N. plumchrus: white square: individuals from Station P; black square: from Bering Sea; N. flemingeri: white circle: individuals from Station P; white triangle: individuals from Bering Sea.
|
 issued from : D.L. Mackas, R. Goldblatt & A.G. Lewis inCan. J. Fish. Aquat. Sci., 1998, 55. [p.1879, Fig.1]. Seasonally of development and vertical distribution of N. plumchrus in the subarctic Pacific Ocean (adapted from Fulton, 1973 and Miller & al., 1984 to show changes in body size).
|
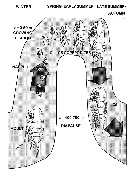
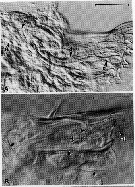
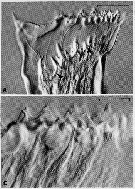 Issued from : C.B. Miller,D.M. Nelson, C. Weiss & A.H. Soeldner, 1990, 106. [p.92, Fig.1, A, C]. Chewing surfaces of the mandibular gnathobase of copepodite 4 : A, Jaw in process of forming new teeth in apolysis space below old tooth row ; tooth molds are fully extruded onto surface of epidermis (arrowed) and have cuspate shape of tooth ; C, Jaw just prior to apolysis ; epidermis beneath old teeth takes on a distinctly striated appearance. Scale bars : 0.080 mm (A) ; 0.030 mm (C). Nota : Opal teeth develop early in the premolt phase of the molt cycle. They form in the apolysis space beneath the old tooth row on the mandibular gnathobase. Apolysis occurs early in the distal gnathobase, then several epidermal cell types participate sequentially in formation of new teeth. Fibrous molds in the shapes of the new teeth are extruded onto epidermal surface, then additional materials, probably proteinaceous, are secreted into them. Tooth molds next are linked to a gland in the proximal part of the gnathobase by ducts of an unusual type, lamellar-walled ducts. Silicification follows, apparently using highly osmiophilic material supplied by the proximal gland. Opal lis laid down at the outer periphery of the mold then thickens toward the attachment of the mold to newly formed chitin at its base. During apolysis the epidermal cells move proximally without breaking ducts that connect small dermal glands with pores in the sides of the opal teeth. The molds for the new teeth form surrounding these ducts, and new pores result. The glands are like the ciliary exocrine glands seen in other Crustacea ; presumably the glands secrete a substance (toxin or digestive enzyme ?).
|
 Issued from : C.B. Miller, D.M. Nelson, C. Weiss & A.H. Soeldner, 1990, 106. [p.93, Fig.2, B]. Chewing surfaces of the mandibular gnathobase of copepodite 4 : new teeth forming, showing Y ducts (arrowed) attached at dorsal and ventral corners of several of tooth molds. Scale bar : 0.040 mm. Nota : During the silicification phase, each tooth pattern is connected at its dorsal and ventral corners to branches of a Y-shaped duct (Fig.2 B). The stem of each Y extends back to the proximal portion of the gnathobase (p.93, Fig.3A), and ducts from all the tooth molds are seen to connect there to a mass of glandular tissue.
|
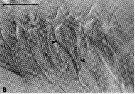
 Issued from : C.B. Miller, D.M. Nelson, C. Weiss & A.H. Soeldner, 1990, 106. [p.94, Fig.3, A, B]. Chewing surfaces of the mandibular gnathobase of copepodite 4 : A, Jaw at silicification phase ; tooth molds are connected to a gland (g) in base of the jaw by ducts (d) which bifurcate just proximal to tooth mold ; B, jaw in late premolt phase, showing a new tooth (nt) ; folds in new exoskeleton appear as double-interference stripes (unlabelled arrows. Scale bars : 0.080 mm (A) ; B, 0.040 mm (B).
|
 issued from : R.J. Machida, M.U. Miya, M. Nishida & S. Nishida in Mar. Biol., 2006, 148. [p.1077, Table 5]. Comparisons of selected biological characteristics of 6 species olus 1 subspecies of Neocalanus.
|
 issued from : N.V. Vyshkvartzeva in Issled. Fauny Moreï, 1972, 12 (20). [p.167, Fig.7, 1a, 1b, 1g, 1g', 1d). As Calanus plumchrus. Female stage V: 1a, Md (mandibular edge, lateral view); 1b, left Md; 1g, right Md; 1g', left Md (diastema); 1d, right Md (diiastema).
|
 issued from : A. Fleminger in Mar. Biol., 1985, 88. [p.283, Fig.5 B]. As Calanus s.l. plumchrus.
Male (from N Pacific, subarctic): Left A1 proximal segments (ventral view);
Nota: see remarks in Calanus s.l. pacificus californicus (Fleminger, 1985, p.275) concerning the dimorphism in the female A1.
|
 issued from : B.K. Sullivan, C.B. Miller, W.T. Peterson & A.H. Soeldner in Mar. Biol., 1975, 30. [p.177, Fig.2, A]. As Calanus plumchrus (from Subarctic Pacific) female: A, SEM micrograph of left Md (posterior surface of distal or chewing edge.
|
 issued from : B.K. Sullivan, C.B. Miller, W.T. Peterson & A.H. Soeldner in Mar. Biol., 1975, 30. [p.179, Fig.4, A]. As Calanus plumchrus female: A, SEM micrograph detail of 2 dorsal teeth of left Md.
|
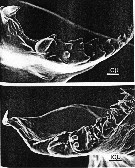 issued from : B.K. Sullivan, C.B. Miller, W.T. Peterson & A.H. Soeldner in Mar. Biol., 1975, 30. [p.181, Fig.7]. As Calanus plumchrus (from 50°N, 145°W) female: A, Comparison of right Md from 2 different specimens, showing marked differences in degree of tooth wear.
|
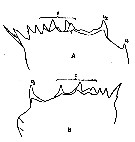 issued from : A.K. Heinrich in Oceanol., 1969, 8. [p.234, Fig.2, A, B]. Calanus (= Neocalanus) plumchrus from NE Pacific Ocean: Chewing edge of mandible in Stage I copepodite. v1, v2: ventral teeth; c, central teeth. Nota: Apart from other distinctive characteristics, however, the fully grown individuals of the several Calanus and Neocalanus species present certain differences in the structure of the chewing edge of the mandible (See in Beklemishev, 1959). In N. plumchrus there are widely based ventral teeth (v1 and v2), v1 being very small, and occasionally absent (B); the distance between the ventral teeth is about the same that between v2 and the central teeth, both being relatively small. For example in Calanus pacificus there is only one ventral tooth, situated at a considerable from the central teeth.
|
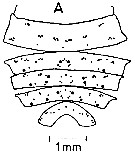 ssued from : J. Mauchline & T. Nemoto in Bull. Plankton Soc. Japan, 1977, 24 (2). [p.111, Fig.4, A]. Distributions of pores in the treated integuments of Calanus plumchrus (= Neocalanus plumchrus) adult female from east of Hokkaido, Japan (about 42°N, 146°E)
|
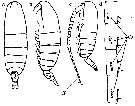 Issued from : M. Chihara & M. Murano in An Illustrated Guide to Marine Plankton in Japan, 1997. [p.747, Pl. 68, fig.87 a-d]. After Miller, 1988. Female: a-b, habitus (dorsal and lateral, respectively); d, Segments 13 to 17 of A1. Male: c, habitus (lateral). Numbers show species characteristics.
|
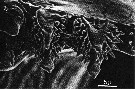
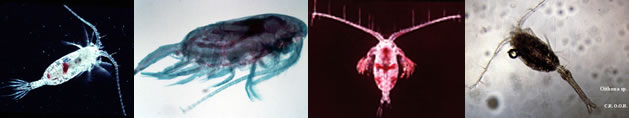
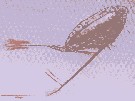 Issued from : H.P. Batchelder, K.L. Daly, C.S. Davis, R. Ji, M.D. Ohman, W.T. Peterson & J.A. Runge in Oceanography, 2013, 26 (4). [p.46]. Photo by Russ Hopcroft, University of Alaska Fairbanks. Neocalanus plumchrus dominant copepod in the biomass in spring in the Gulf of Alaska. Note the dorsal oil sac in the prosome and pigmentation.
|
 Issued from : K.A. Brodsky, N.V. Vyshkvartzeva, M.S. Kos & E.L. Markhaseva in Opred. Faune SSSR, 1983, 135. [p.181, Fig.79]. As Calanus plumchrus. Female (after Kos, 1972; Brodsky, 1950 and 1972; Campbell, 1934).
|
 ssued from : K.A. Brodsky, N.V. Vyshkvartzeva, M.S. Kos & E.L. Markhaseva in Opred. Faune SSSR, 1983, 135. [p.182, Fig.80]. As Calanus plumchrus. Male (after Tanaka, 1954; Kos, 1972; Brodsky, 1950 and 1972; Campbell, 1934).
| | | | | Compl. Ref.: | | | Mackas & Sefton, 1982 (p.1173, Table 1); Vidal & Whitledge, 1982 (p.77, respiration vs. latitude); Dagg & al., 1982 (p.45, Table 3, abundance, ingestion, respiration, excretion); Dagg & Wyman, 1983 (p.37, natural ingestion rates); Dagg, 1983 (p.63, fig.4, feeding); Frost & al., 1983 (p.1, feeding behavior); Miller & al., 1984 (p.201, life history); Price & Paffenhöfer, 1985 (p.115, feeding); Bamstedt & Tande, 1985 (p.259, Table 2: literature data respiration & excretion); Vidal & Smith, 1986 (p.523, Table 1, biomass, development time); Smith & Vidal, 1986 (p.215, Table 4, 5, fig.4, 5, 6, population dynamic): Mackas & Anderson, 1986 (p.115, Table 2); Dagg & Walser, 1986 (p.1066, Chl. a concentration v.s. fecal pellets); 1987 (p.178, ingestion/egestion); Ohman, 1987 (p.1317, Rem.: p.1326, feeding); Miller & Clemons, 1988 (p.293); Miller & al., 1988 (p.1, fig.4, 9, 10, Rem.: p.16); Donaghay, 1988 (p.469, acclimatation vs. food quality & trophic dominance); Springer & al., 1989 (p.359, Fig.5, 10, 11, Table 1) , Hirakawa & al., 1990 (tab.3); Coyle & al., 1990 (p.763); Shih & Marhue, 1991 (tab.2, 3); Haigh & Taylor, 1991 (p.301, Rem.: p.309); Park & al., 1991 (p.205, fig.2); Gifford & Dagg, 1991 (p.161, feeding); Miller & al., 1992 (p.389, size variation/long-term serie); Huntley & Lopez, 1992 (p.201, Table A1, B1, egg-adult weight, temperature-dependent production, growth rate); Dagg, 1993 (p.163, Table 1, 2, 3, figs., abundance, gut pigment); Kotani & al., 1996 (tab.2); Dower & Mackas, 1996 (p.837, seamount effects v.s. abundance); Park & Choi, 1997 (Appendix); Mauchline, 1998 (tab.17, 21, 25, 26, 37, 45, 46, 47, 58); Heinrich, 1998 b (p.891); Mackas & al., 1998 (p.1878); Mackas & Tsuda, 1999 (p.335, Table 1); Russell & al., 1999 (p.77, tab.1); Dolganova & al., 1999 (p.13, tab.1); Goldblatt & al., 1999 (p.2619, Fig.3, tabl.1, 2); Evanson & al., 2000 (p.239, Rem: lipid storage); Saito & Tsuda, 2000 (p.2141, egg production, development, figs. c-d: egg, nauplius); Rebstock, 2001 (tab.2); Kobari & Ikeda, 2001 (p.287); Mackas & al., 2001 (p.685, Tab. 3, 6, fig.3: interannual changes in species composition); Peterson & al. (p.381, Table 2, interannual abundance); Rebstock, 2002 (p.71, Table 3, 4, climatic variability); Mackas & Galbraith, 2002 (p.725, tab.2a, 2b); 2002 a (p.423, Table 2); Heinrich, 2002 (p.77, life history); Yamaguchi & al., 2002 (p.1007, tab.1); Yamaguchi & al., 2004 (p.479,fig.3); Park, W & al., 2004 (p.464, tab.1); Mackas & al., 2004 (p.875, Table 2); Miller C.B., 2005 (p.219, 220, Rem.); Choi & al., 2005 (p.710: Tab.III); Ashjian & al., 2005 (p.1380: tab.2); Mackas & al., 2005 (p.1011, tab.2, 3); Tadoroko & al., 2005 (p.210, interannual variation); Zamon & Welch, 2005 (p.133, fig.5); Coyle, 2005 (p.77, fig.7, 9, tab.3); Miller C.B., 2005 (p.148, respiration & excretion, stages vs time; Rem.); Hooff & Peterson, 2006 (p.2610); Ware & McQueen, 2006 (p.28, Table B1, weight ranges); Lewis & al., 2006 (p.501, Table I); Carls & al., 2006 (p.1480, hydrocarbons accumulation); Deibel & Daly; 2007 (p.271, Table 4, Rem.: Arctic polynyas); Mackas & al., 2007 (p.223, climatic change index); Humphrey, 2008 (p.84: Appendix A); Wilson S.E. & al., 2008 (p.1636, Rem.: p.1645); Kobari & al., 2008 (p.1648, coppodids I-VI, depth distribution); Takahashi & al., 2008 (p.222, Table 2, grazing impact); Galbraith, 2009 (pers. comm.); Dagg & al., 2009 (p.716, feeding rates); Tsuda & al., 2009 (p.2767, figs.9, 12, 15, Table 1, vertical distribution, iron fertilization); Chiba & al., 2009 (p.1846, Table 1, occurrence vs temperature change); Hopcroft & al., 2009 (p.9, Table 3); Park & Ferrari, 2009 (p.143, fig.2, biogeography); Batten & Mackas, 2009 (p.189, annual cycle of biomass duration vertical abundance); Mackas & Beaugrand, 2010 (p.296, fig.13, 14); Lewis & al., 2010 (p.695, Table I); Tatebe & al., 2010 (p.409, Table 1, 2, horizontal transport); Kobari & al., 2010 (p.1703: feeding); Kobari & al., 2010 (p.1715, figs., Table 2, 3, development, growth); Yamaguchi & al., 2010 (p.1679, figs.5, 10, Table 1, population structure); Wilson S.E. & al., 2010 (p.1278, Table 3, fatty acids); Yamaguchi & al., 2010 (p.1691, figs.2, 8, 10, vertical distribution); Machida & Tsuda, 2010 (p.1: gene sequences); Homma & Yamaguchi, 2010 (p.965, Table 2); Doi & al., 2010 (p.1733, trophic niche); Hopcroft & al., 2010 (p.27, Table 1, 2, fig.9); Matsuno & Yamaguchi, 2010 (p.123, Rem. p.129); Yamaguchi & al., 2011 (p.13, seasonal variation, life history); Yoshiki & al., 2011 (p.63, egg production, development vs pressure); Saito & al., 2011 (p.145, abndance, size vs. temperature); Batten & Walne, 2011 (p.1643, Table I, abundance vs temperature interannual variability); Homma & al., 2011 (p.29, Table 2, 3, 5, abundance, feeding pattern: suspension feeders); Matsuno & al., 2011 (p.1349, Table 1, abundance vs years); DiBacco & al., 2012 (p.483, Table S1, ballast water transport); Takenaka & al., 2012 (p.1669, fig.2, 3, Table 1, bioluminescence); Chiba & al., 2012 (p.63, temporal variation vs regions); Irvine & Crawford, 2013 (p.1, Rem.: p.59, anomaly time series); Takahashi M. & al., 2012 (p.393, Table 2, water type index); in CalCOFI regional list (MDO, Nov. 2013; M. Ohman, comm. pers.); Kobari & al., 2013 (p.78, Table 2); Liu & al., 2013 (p.271, growth models); Ohashi & al., 2013 (p.44, Table 1, Rem.); Questel & al., 2013 (p.23, Table 3, interannual abundance & biomass, 2008-2010); Yoshiki & al., 2013 (p.993, interannual variations 2001-2009); Wilson R.J. & al., 2013 (p.438, Rem.: p.439, lipid vs diapause, buoyancy); Kobari & al., 2013 (p.97, Table I, DNA, RNA, protein contents vs development & depth); Eisner & al., 2013 (p.87, Table 3: abundance vs water structure); Coyle, 2014 (p.97, table 3, 7, 8, 10, 11, 12, 14, 15, as Neocalanus plumchrus); Chiba S. & al., 2015 (p.968, Table 1: length vs climate); Zakaria & al., 2016 (p.1, Table 1, Rem.); Ohtsuka & Nishida, 2017 (p.565, Table 22.1); Baumgartner & Tarrant, 2017 (p.387, Table 1, fig.4, diapause); Record & al., 2018 (p.2238, Table 1: diapause); Hirai & al., 2020 (p.1, Fig. 5: cluster analysis (OTU), spatial distribution). | | | | NZ: | 7 + 1 doubtful | | |
|
Distribution map of Neocalanus plumchrus by geographical zones
|
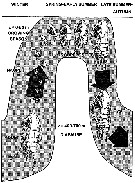
| | | | | | | | | 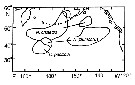 issued from : D.L. Mackas & A. Tsuda in Progress in Oceanography, 1999, 43. [p.353, Fig.9]. issued from : D.L. Mackas & A. Tsuda in Progress in Oceanography, 1999, 43. [p.353, Fig.9].
Regions in which different components of the crustacean zooplankton community are especially dominant, as indexed by the gut contents of planktivorous baleen whales (after Kawamura, 1982). |
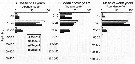
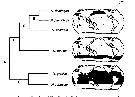 issued from : R.J. Machida, M.U. Miya, M. Nishida & S. Nishida in Mar. Biol., 2006, 148. [p.1077, Fig.4]. issued from : R.J. Machida, M.U. Miya, M. Nishida & S. Nishida in Mar. Biol., 2006, 148. [p.1077, Fig.4].
Relationship between the phylogeny and distribution pattern of the Neocalanus species.
Shaded portions of the maps represent distributions based on the litterature. Clades A-E correspond to those in Fig.3, p.1075. |
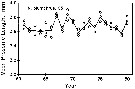 issued from : C.B. Miller, J. Fulton & B.W. Frost in Can. J. Fish. Aquat. Sci., 1992, 49. [p.394, Fig.2]. issued from : C.B. Miller, J. Fulton & B.W. Frost in Can. J. Fish. Aquat. Sci., 1992, 49. [p.394, Fig.2].
Time series of mean lenths for Neocalanus plumchrus in resting phase copepodid V in the Gulf of Alaska; at Station "P" (50°N, 145°W.
Each symbol is the mean for a single sample. The overall means for the years (unweighted mean of the sample means) are connected by lines.
Nota: Between-year variation of prosome length is significantly greater than the within-year variation. |
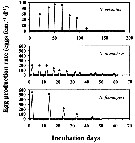
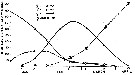 Issued from : J. Fulton in J. Fish. Res. Board Can., 1973, 30. [p.813, Fig.2]. Issued from : J. Fulton in J. Fish. Res. Board Can., 1973, 30. [p.813, Fig.2].
Changes in the population structure of Calanus (= Neocalanus) plumchrus from Strait of Georgia (Canada), during the breeding season plotted from field data. |
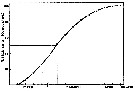 Issued from : J. Fulton in J. Fish. Res. Board Can., 1973, 30. [p.813, Fig.3]. Issued from : J. Fulton in J. Fish. Res. Board Can., 1973, 30. [p.813, Fig.3].
Eggs laid by Calanus (= Neocalanus) plumchrus in laboratory cultures in incubator at 7° C (the in situ temperature).
Note that 50% of the eggs were laid in the first 25 days |
 Issued from : J. Fulton in J. Fish. Res. Board Can., 1973, 30. [p.814, Fig.5]. Issued from : J. Fulton in J. Fish. Res. Board Can., 1973, 30. [p.814, Fig.5].
Schematic diagram of Calanus (= Neocalanus) plumchrus life cycle in the Strait of Georgia (Canada).
Nota: The species did not fed during the last 7 months of its cycle and the fecundity of each female was dependent on the size of the animal. Each female produced an average of 535 eggs from 9.5 broods over a breeding period of 85 days. Eggs were released in water deeper than 300 m and were calculated to move towards the surface about 26m/day. Growth from egg to stage V took about 100 days. Growth rate was calculated to be 10.6%/day. It appears 1 annual generation. |
 issued from : D.L. Mackas, R. Goldblatt & A.G. Lewis inCan. J. Fish. Aquat. Sci., 1998, 55 (8). [p.1879, Fig.1]. issued from : D.L. Mackas, R. Goldblatt & A.G. Lewis inCan. J. Fish. Aquat. Sci., 1998, 55 (8). [p.1879, Fig.1].
Seasonally of development and vertical distribution of N. plumchrus in the subarctic Pacific Ocean (adapted from Fulton, 1973 and Miller & al., 1984 to show changes in body size). |
 issued from : A. Yamaguchi, K. Ohgi, T. Kobari, G. Padmavati & T. Ikeda in Bull. Fish. Sci. Hokkaido Univ., 2011, 61 (1). [p.18, Fig.5 (part.)] issued from : A. Yamaguchi, K. Ohgi, T. Kobari, G. Padmavati & T. Ikeda in Bull. Fish. Sci. Hokkaido Univ., 2011, 61 (1). [p.18, Fig.5 (part.)]
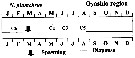
Schematic diagram showing life cycle timing (mating, spawning, quiescence or diapause) of Neocalanus plumchrus, one of five dominant copepods in the Oyashio region, western subarctic Pacific (Site H: 41°30'N-42°30'N, 145°00'E-146°00'E).
Compare with Metridia pacifica, Eucalanus bungii, Neocalanus cristatus, Neocalanus flemingeri. |
 Issued from : A. Yamaguchi, K. Ohgi, T. Kobari, G. Padmavati & T. Ikeda in Bull. Fish. Sci. Hokkaido Univ., 2011, 61 (1). [p.20, Fig.6 (part.)]. Issued from : A. Yamaguchi, K. Ohgi, T. Kobari, G. Padmavati & T. Ikeda in Bull. Fish. Sci. Hokkaido Univ., 2011, 61 (1). [p.20, Fig.6 (part.)].
Schematic diagram showing life cycle timing (mating, spawning, quiescence or diapause) of Neocalanus plumchrus, one of five dominant copepods in the subarctic Pacific (except Oyashio region, western subarctic Pacific (Site H: See Fig.5).
Compare with Metridia pacifica, Eucalanus bungii, Neocalanus cristatus, Neocalanus flemingeri. |
 Issued from : T. Yoshiki, T. Ono, A. Shimizu & T. Toda in Mar. Ecol. Prog. Ser., 2011, 430. [p.65, Table 1]. Issued from : T. Yoshiki, T. Ono, A. Shimizu & T. Toda in Mar. Ecol. Prog. Ser., 2011, 430. [p.65, Table 1].
Neocalanus plumchrus: Spawning interval, clutch size, and egg hatching success as observed in the Oyashio region of the Western Subarctic Pacific in January 2006 and January 2007 and previously by Saito & Tsuda (2000).
d: day; na: data not available.
Compare with N. cristatus, N, flemingeri |
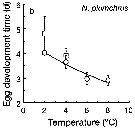 Issued from : T. Yoshiki, T. Ono, A. Shimizu & T. Toda in Mar. Ecol. Prog. Ser., 2011, 430. [p.66, Fig. 1b]. Issued from : T. Yoshiki, T. Ono, A. Shimizu & T. Toda in Mar. Ecol. Prog. Ser., 2011, 430. [p.66, Fig. 1b].
Average (±SEM) egg development times from the Neocalanus plumchrus in the Oyashio region of the Western Subarctic Pacific in January 2006 and January 2007 (o) and from Saito & Tsuda (2000) (suare) under atmospheric pressure and different temperatures.
Egg development times significantly descreased with increasing temperature. |
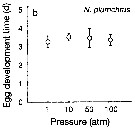 Issued from : T. Yoshiki, T. Ono, A. Shimizu & T. Toda in Mar. Ecol. Prog. Ser., 2011, 430. [p.66, Fig. 2b]. Issued from : T. Yoshiki, T. Ono, A. Shimizu & T. Toda in Mar. Ecol. Prog. Ser., 2011, 430. [p.66, Fig. 2b].
Average (±SEM) egg development time under pressures from 1 to 100 atm at 4°C to Neocalanus plumchrus collected in the Oyashio region of the Western Subarctic Pacific in January 2006 and January 2007.
Differences in egg development time between pressure conditions were not statistically significant. |
 Issued from : T. Yoshiki, T. Ono, A. Shimizu & T. Toda in Mar. Ecol. Prog. Ser., 2011, 430. [p.69, Fig.b5]. Issued from : T. Yoshiki, T. Ono, A. Shimizu & T. Toda in Mar. Ecol. Prog. Ser., 2011, 430. [p.69, Fig.b5].
Neocalanus spp. (N. cristaus, N. plumchrus, N. flemingeri) collected in the Oyashio region of the Western Subarctic Pacific in January 2006 and January 2007. Depth ranges experienced during early life stages (from egg to nauplius; dotted line). |
 Issued from : S.D. Batten & D.L. Mackas in Mar. Ecol. Prog. Ser., 2009, 393. [p.192, Fig.2]. Issued from : S.D. Batten & D.L. Mackas in Mar. Ecol. Prog. Ser., 2009, 393. [p.192, Fig.2].
Neocalanus plumchrus. Annual cycle of biomass in surface waters from CPR samples in the Strait of Georgia.
Dotted line: day when 50% of the population were at copepodite stage 5 (C5), from linear interpretation of stage composition according to Mackas & al. (1998). In 2001, the first sampling of the year encountered > 50% C5. |
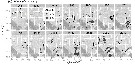
 Issued from : S.D. Batten & D.L. Mackas in Mar. Ecol. Prog. Ser., 2009, 393. [p.193, Fig.4]. Issued from : S.D. Batten & D.L. Mackas in Mar. Ecol. Prog. Ser., 2009, 393. [p.193, Fig.4].
Proportion of total water column abundance of each copepodite stage in each depth band from BIONESS data (locations NE Pacific between Station P and Strait of Georgia). A: mean of all years; B: mean for cold years (2000, 2001 and 2002); C: mean for warm years (1966, 1987, 1993, 2003, 2004). |
 Issued from : S.D. Batten & D.L. Mackas in Mar. Ecol. Prog. Ser., 2009, 393. [p.194, Fig.5]. Issued from : S.D. Batten & D.L. Mackas in Mar. Ecol. Prog. Ser., 2009, 393. [p.194, Fig.5].
Neocalanus plumvhrus. Index of cohort width in populations in the Strait of Georgia (from Bongo net samples) and the oceanic NE Pacific (Ocean Station P net data, 1957 to 1980, and CPR data 2000 to 2007, from the region NE Pacific (Southern Gulf of Alaska).
No sampling occurred between 1981 and 1995.
Station P: 50° N, 145° W. |
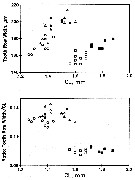
 Issued from : H. Saito & A. Tsuda in Deep-Sea Res. I, 47. [p.2146, Table I]. Issued from : H. Saito & A. Tsuda in Deep-Sea Res. I, 47. [p.2146, Table I].
Egg diameter, carbon and nitrogen contents and prosome length (PL) of females of Neocalanus plumchrus from 42°00' N, 145°00' E. (Oyashio region, western subarctic Pacific). In incubators at 2°C and 4°C, also 6°C; salinity: 32.0-33.5 psu.
Nota: Compare with N. cristatus and N. flemingeri and others species in genus Calanus. |
 Issued from : H. Saito & A. Tsuda in Deep-Sea Res. I, 47. [p.2146, Table 2]. Neocalanus plumchrus: Issued from : H. Saito & A. Tsuda in Deep-Sea Res. I, 47. [p.2146, Table 2]. Neocalanus plumchrus:
Mean ± 1 S.E. of prosome length (mm), carbon and nitrogen contents (µg), and C:N ratio. Values in parenthesis give the range.
Compare with N. cristatus and N. flemingeri. |
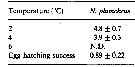 Issued from : H. Saito & A. Tsuda in Deep-Sea Res. I, 47. [p.2149, Table 4]. Neocalanus plumchrus: Issued from : H. Saito & A. Tsuda in Deep-Sea Res. I, 47. [p.2149, Table 4]. Neocalanus plumchrus:
Egg hatching time (days: mean ± 1 S.E.) at different temperature and egg hatching success (%) of Neocalanus spp.
ND: mean no data.
Compare with N. cristatus anxd N. flemingeri.
Nota: The developmental time from CI to CV was estimated to be 46 days in the bering Sea (Vidal & Smith, 1986), 56 days in the Alaskan gyre (Miller, 1993), and < 1.5 month in the Oyashio region (Tsuda & al., 1999). The peak abundance of CV was observed to be 74 days after the peak of egg production in the Strait of Georgia, where water temperature was higher than the other waters (Fulton, 1973). Thus, estimated developmental time in the present study agree well with the in situ development. |
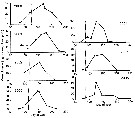
 Issued from : H. Saito & A. Tsuda in Deep-Sea Res. I, 47. [p.2147, Fig. 3]. Issued from : H. Saito & A. Tsuda in Deep-Sea Res. I, 47. [p.2147, Fig. 3].
Typical egg laying pattern comparison between Neocalanus cristatus (top), N. plumchrus (middle) and N. flemingeri (bottom).
Open circles mean the day of death.
Nota: N. plumchrus female laid 1-235 eggs at 2-8 days intervals. The clutch size of each female was less variable within that the first 2-4 clutches, then decreased. The interval was stable in the early phase of the egg laying period, but in most cases became irregular and longer at the end of the spawning period as showed in the figure. The mean interval, excluding the last three clutches, was 5.4 ± 1. 0 days at 2°C and 5.0 ± 0.7 days at 4°C.
The maximum clutch number was 12 and the maximum fecundity was 1093 eggs per female. Mean ± 1 S.E. fecundity of females which produced more than 9 clutches was 840 ± 214 eggs.
The total carbon and nitrogen production in the form of eggs per female was 391 µg C and 39 µg N.
The egg laying periods, calculated from the mean interval and the maximum clutch number, were 60 days at 2°C and 56 days at 4°C.
After the final egg laying, spent females of N. plumchrus and N. flemingeri were alive for 6-35 days. Spent N. cristatus stayed alive up to 115 days. |
 Issued from : E.A. Ershova, E.R. Hopcroft, K.N. Kosobokova, K. Matsuno, R.J. Nelson, A. Yamaguchi & L.B. Eisner in Oceanography, 2015, 18 (3). [p.110, Fig.7]. Issued from : E.A. Ershova, E.R. Hopcroft, K.N. Kosobokova, K. Matsuno, R.J. Nelson, A. Yamaguchi & L.B. Eisner in Oceanography, 2015, 18 (3). [p.110, Fig.7].
Abundance (ind. per m3) of Neocalanus spp. (c) in the Chukchi Sea .
Color circle red spot: stations where taxon was present during 1946-2012 (< 1 ind.per m3); x: stations where taxon was not found.
Probably a mixing from Neocalanus plumchrus and Neocalanus flemingeri. |
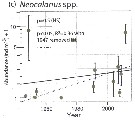 Issued from : E.A. Ershova, E.R. Hopcroft, K.N. Kosobokova, K. Matsuno, R.J. Nelson, A. Yamaguchi & L.B. Eisner in Oceanography, 2015, 18 (3). [p.112, Fig.10]. Issued from : E.A. Ershova, E.R. Hopcroft, K.N. Kosobokova, K. Matsuno, R.J. Nelson, A. Yamaguchi & L.B. Eisner in Oceanography, 2015, 18 (3). [p.112, Fig.10].
Mean abundances of Neocalanus spp. (c) in the Chukchi Sea north of 70°N and east of 175°W.
Bars indicate 95% confidence interval.
Solid line indicates fitted trend. Dotted line indicates fitted trend with one outline removed. |
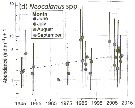 Issued from : E.A. Ershova, E.R. Hopcroft, K.N. Kosobokova, K. Matsuno, R.J. Nelson, A. Yamaguchi & L.B. Eisner in Oceanography, 2015, 18 (3). [p.109, Fig.6]. Issued from : E.A. Ershova, E.R. Hopcroft, K.N. Kosobokova, K. Matsuno, R.J. Nelson, A. Yamaguchi & L.B. Eisner in Oceanography, 2015, 18 (3). [p.109, Fig.6].
Interannual variability of Pacific copepod Neocalanus spp. (c) abundance in the Chukchi Sea during 1946-2012.
Each symbol represents one cruise; bars indicate 95% confidence interval. Dashed line shows fitted trend over averaged data.
Probably a mixing from Neocalanus flemingeri and Neocalanus plumchrus. |
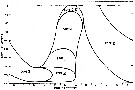
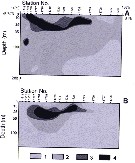 Issued from : A.I. Pinchuk & A.J. Paul in Univ. Alaska Sea Grant College Progr., 2000. [p.6, Fig.3]. Issued from : A.I. Pinchuk & A.J. Paul in Univ. Alaska Sea Grant College Progr., 2000. [p.6, Fig.3].
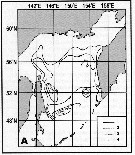
Vertical zooplankton biomass (mg .m3) distribution on the profile between Cape Terpeniya (southern Sakhalin) and Kambalnyi Bay (southern Kamchatka) in the upper 0-200 m layer, mesh = 0.168.
A = general zooplankton biomass; B = Calanus plumchrus biomass.
1 = < 100; 2 = 100-500; 3 = 500-1000; 4 = > 1000 (from Lubny-Gertsik, 1959). |
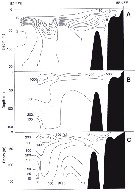 Issued from : A.I. Pinchuk & A.J. Paul in Univ. Alaska Sea Grant College Progr., 2000. [p.6, Fig.4]. Issued from : A.I. Pinchuk & A.J. Paul in Univ. Alaska Sea Grant College Progr., 2000. [p.6, Fig.4].
A = vertical distribution of temperature in summer; B = total zooplankton biomass (mg.m3). C = calanus plumchrus biomass (mg.m3) on the profile along 50°53'N; mesh = 0.168. (from Kotlyar and Chernyavskiy, 1970b) |
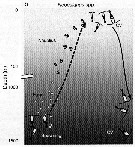
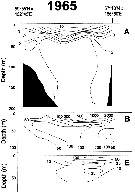
 Issued from : A.I. Pinchuk & A.J. Paul in Univ. Alaska Sea Grant College Progr., 2000. [p.7, Fig.5]. Issued from : A.I. Pinchuk & A.J. Paul in Univ. Alaska Sea Grant College Progr., 2000. [p.7, Fig.5].
A = vertical distribution of water temperature. B = total zooplankton biomass (mg.m3). D = Calanus plumchrus biomass (mg.m3) on the profile along 54°19'N in summer 1965; mesh = 0.168. (from Kotlyar & Chernyavskiy, 1970b) |
 Issued from : A.I. Pinchuk & A.J. Paul in Univ. Alaska Sea Grant College Progr., 2000. [p.7, Fig.6]. Issued from : A.I. Pinchuk & A.J. Paul in Univ. Alaska Sea Grant College Progr., 2000. [p.7, Fig.6].
A = Vertical distribution of water temperature; B = total zooplankton biomass (mg.m3); E = Calanus plumchrus biomass (mg.m3) on the profile along 57°16'N in summer 1967; mesh = 0.168. (From Kotlyar & Chernyavskiy, 1970b) |
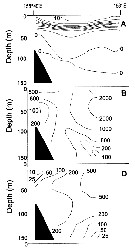
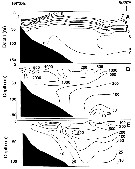
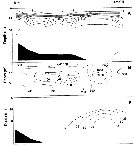 Issued from : A.I. Pinvhuk & A.J. Paul in Univ. Alaska Sea Grant College Progr., 2000. [p.9, Fig.7]. Issued from : A.I. Pinvhuk & A.J. Paul in Univ. Alaska Sea Grant College Progr., 2000. [p.9, Fig.7].
A = vertical distribution of water temperature. B = total zooplankton biomass (mg.m3). E = Calanus plumchrus biomass (mg.m3) on the profile along 147°33' E in summer 1964; mesh = 0.168. (from Kotlyar & Chernyavskiy, 1970b)9 |
 Issued from : A.I. Pinvhuk & A.J. Paul in Univ. Alaska Sea Grant College Progr., 2000. [p.11, Fig.9]. Issued from : A.I. Pinvhuk & A.J. Paul in Univ. Alaska Sea Grant College Progr., 2000. [p.11, Fig.9].
A = vertical distribution of water temperature. B = total zooplankton biomass (mg.m3). E = Calanus plumchrus biomass (mg.m3) on the profile along 151°20' E E in summer 1964; mesh = 0.168. (from Kotlyar & Chernyavskiy, 1970b). |
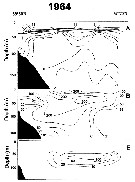
 Issued from : A.I. Pinvhuk & A.J. Paul in Univ. Alaska Sea Grant College Progr., 2000. [p.12, Fig.10]. Issued from : A.I. Pinvhuk & A.J. Paul in Univ. Alaska Sea Grant College Progr., 2000. [p.12, Fig.10].
A = vertical distribution of water temperature. B = total zooplankton biomass (mg.m3). E = Calanus plumchrus biomass (mg.m3) between Cape Evreinov and Cape Hayryuzov in summer 1965; mesh = 0.168. (from Kotlyar & Chernyavskiy, 1970b) |
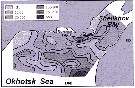 Issued from : A.I. Pinvhuk & A.J. Paul in Univ. Alaska Sea Grant College Progr., 2000. [p.21, Fig.25]. Issued from : A.I. Pinvhuk & A.J. Paul in Univ. Alaska Sea Grant College Progr., 2000. [p.21, Fig.25].
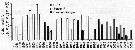
Distribution of Calanus plumchrus biomass (mg.m3) in the 0-50 m layer in the northern Okhotsk Sea during August,1964. (from Kotlyar, 1965) |
 Issued from : A.I. Pinvhuk & A.J. Paul in Univ. Alaska Sea Grant College Progr., 2000. [p.30, Fig.35 A]. Issued from : A.I. Pinvhuk & A.J. Paul in Univ. Alaska Sea Grant College Progr., 2000. [p.30, Fig.35 A].
Distribution of Calanus plumchrus biomass (mg.m3) in the 0-100 m layer in the Okhotsk Sea.
1: September-October 1652; 2: June-July 1951; 3: June-July 1650; 4: August-September 1949. (from Lubny-Gertsik, 1959). |
 Issued from : S. Ohtsuka & S. Nishida in Species diversity of Annuals in Japan Tokyo , eds MotokawaM. & Kajihara H., 2017, Springer/ [p.584, Fig. 22.6]. Issued from : S. Ohtsuka & S. Nishida in Species diversity of Annuals in Japan Tokyo , eds MotokawaM. & Kajihara H., 2017, Springer/ [p.584, Fig. 22.6].
Ontogenic migration and biennial life cycle of the oceanic calanoid Neocalanus plumchrus (small and large forms) in the Oyashio region.
Phytoplankton bloom occurred in April and May. C1-C5 first to fifth copepodid stages.
After A. Tsuda, H. Saito & H. Kasai, 2001.
Compare with Neocalanus flemingeri for the same region. |
| | | | Loc: | | | St. Lawrence Island, Anadyr Strait, Chukchi Sea, off NW Alaska, Port Valdez, Beaufort Sea, Strait of Bering, off Unimak Is., Bering Sea, Okhotsk Sea, S Aleutian Basin, S Aleutian Is., Japan Sea, Funka Bay, Korea, Japan (Izu, Hokkaido, Ishikari bay, Tohoku), Oyashio region, Station 'H', Kuroshio extension, Station K2 (47°N, 160°E), Station Knot, E Kuril-Kamchatka, off S Aleutian Is., Aleutian Basin, Station "P" *, ''R'' *, G. of Alaska, Straits of Georgia, British Columbia, Fjord system (Alice Arm & Hastings Arm), Portland Inlet, Saanich Inlet, Hecate Strait, Vancouver Is., off Friday Harbor, off Washington coast, Oregon (Yaquina, off Newport), Cobb Seamount, California, off N Hawaii, Indian (equatorial) (in Chiba & al., 1957 a); E Medit. (W Egyptian coast), Red Sea in Zakaria & al. (2016, Table 1).
* Ocean Weather Station "P": 50°N, 145°W; Station ''R'': 53°N, 145°W. | | | | N: | 158 | | | | Lg.: | | | (127) F: 5,1-4,18; M: 4,94-4,18; (131) F: 6,32-4,16; M: 4,82-4,4; (208) F: 5,7-4; M: 5-4,2; (866) F: 4,3-6,3; M: 4,3-4,6; (981) M: 4,40-4,82; {F: 4,00-6,32; M: 4,18-5,00}
Chiba S. & al., 2015 (p.971, Table 1: Total length female (June-July) = 5.3 mm [optimal SST (°C) = 5.3]. | | | | Rem.: | epi-bathypelagic.
A confusion exists between this species and N. flemingeri.
See remaks N. tonsus, particularly in Tanaka (1956, p.51-52) and in N. flemingeri.
Observed in ships' ballasts at San Francisco. tonsus Brady has been confused with plumchrus Marukawa taken from the North Pacific; but on closer examination, the latter shows the main structural differences: larger in size, somewhat slender genital segment, reduced teeth on the cutting blade of Md, absence of small spines on the distal border of the basis segment of the P2 to P5.
For Heinrich (1962, p.465) the species is a common herbivorous copepod in the western region of the Bering Sea.
For Beklemishev (1954 a) the adult females do not feed, and after Vyshkvartzeva (1976) the species differs from all members of the Calanidae in this atrophy of female mouthparts.
Jillett (1968, p.27) compares life cycle between this species and N. tonsus (Cf. remarks in N. tonsus).
After Miller (2005, p.220), in the subarctic Pacific, the dominant species distributes its spawning at depth from late summer through to early spring, apparently ''spreading its belt'' across the entire season. The winning nauplii that get food to grow are those arriving at the surface as first-feeding stages when production increase is strong due to rising insolation and surface thermal stratification. During the 1990s, the month in which these copepodite stocks were maximal moved progressively earlier by about 6 weeks from May in the 1980s to April (Mackas & al., 1998). | | | Last update : 28/10/2020 | |
|
|
 Any use of this site for a publication will be mentioned with the following reference : Any use of this site for a publication will be mentioned with the following reference :
Razouls C., Desreumaux N., Kouwenberg J. and de Bovée F., 2005-2026. - Biodiversity of Marine Planktonic Copepods (morphology, geographical distribution and biological data). Sorbonne University, CNRS. Available at http://copepodes.obs-banyuls.fr/en [Accessed June 17, 2026] © copyright 2005-2026 Sorbonne University, CNRS
|
|
|
|


;)
;)
;)
;)
;)
;)
;)
;)
;)
;)
;)
;)
;)
;)
;)
;)
;)
;)
;)
;)
;)
;)
;)
;)
;)
;)
;)
;)
;)
;)
;)
;)
;)

;)
;)
;)
;)
;)
;)
;)
;)
;)
;)
;)
;)
;)
;)
;)
;)
;)
;)
;)
;)
;)
;)
;)
