|
|
 |
|
Calanoida ( Order ) |
|
|
|
Clausocalanoidea ( Superfamily ) |
|
|
|
Clausocalanidae ( Family ) |
|
|
|
Pseudocalanus ( Genus ) |
|
|
| |
Pseudocalanus minutus (Kröyer, 1845) (F,M) | |
| | | | | | | Syn.: | Calanus minutus Kröyer,1845; 1848 (in Damkaer & Damkaer, 1979, p.21, 24);
Pseudocalanus gracilis Sars, 1903 (p.154, figs.F,M); Mori, 1937 (1964) (p.36, Pl.14: figs.F); Wilson, 1942 a (p.204); Sewell, 1948 (p.385); Brodsky, 1950 (1967) (p.114, figs.F,M); Furuhashi, 1966 a (p.295, vertical distribution vs mixing Oyashio/Kuroshio region); Itoh, 1970 a (p. 4: tab.1); Kos, 1976 (Vol. II, figs.F, M, Rem.); Brodsky & al., 1983 (p.222, figs.F,M, Rem.); Mikhailovsky, 1986 (p.83, Table 1, ecological modelling); ; Shih & Young, 1995 (p.72); Kotani & al., 1996 (tab.2);
P. minutus gracilis Farran & Vervoort, 1951 e (n° 37, p.3, figs.F,M); Grice, 1962 a (p.101, 102);
no P. minutus : Mori, 1937 (1964) (p.36, Pl.15: figs.F,M);
? P. elongatus : Campbell, 1929 (p.310); Brodsky, 1950 (1967) (p.112, figs.F,M); Coyle & al., 2014 (p.97, table 3);
Pseudocalanus minutus elongatus : Sameoto, 1977 (p.1, fig.10);
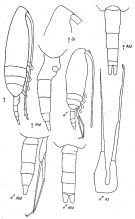
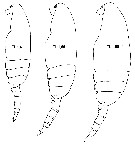
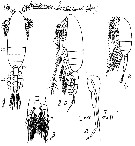
Pseudocalanus sp. : Woods, 1969 (part., p.543, polyteny & size variation); ? Davis C.S., 1984 a (p.573, population dynamic vs water circulation around Georges Bank) | | | | Ref.: | | | With, 1915 (part., p.57, ? figs.F, juv., Rem.); Wilson, 1932 a (p.43, figs.F,M); Jespersen, 1934 (p.49); 1940 (p.14); Wilson, 1942 a (p.205); Lysholm & al., 1945 (p.10); Sewell, 1948 (p.395, 487, 497, 566); ? C.B. Wilson, 1950 (p.316); ? Tanaka, 1956 c (p.384); Faber, 1966 (p.191, figs.N); McLaren & al., 1966 (p.1641, polyteny); Park, 1968 (p.541); Corkett, 1968 (p.51, fig. Rem. N, juv.); ? Minoda, 1971 (p.19); Shih & al., 1971 (p.44, Rem., p.151, 206); Geletin, 1977 (p.82, figs.F, M); McLaren & Corkett, 1978 (p.347, genetic variation, development); Corkett & McLaren, 1978 (p.4); Robins & McLaren, 1982 (p.529, nuclear DNA contents); Gardner & Szabo, 1982 (p.172, figs.F,M); Brodsky & al., 1983 (p.221, figs.F,M); Kos, 1984 (1985) (p.226, Rem.); Sazhina, 1985 (p.44, figs.N); Frost, 1989 (p.530, Descr.F,M, figs.F,M); Sévigny & al., 1989 (p.321 & suiv.: genetic); Karlson & Bamstedt, 1994 (p.79, fig.2: Md); Chihara & Murano, 1997 (p.778, Pl.95: F,M); Samatov, 2001 (p.259, fig. F,M: morphometric characters, Rem.); Bucklin & al., 2003 (p.335, tab. 2, fig.3, Biomol.); G. Harding, 2004 (p.47, figs.F,M); Aarbakke & al., 2011 (p.1487, Table III, fig.2, genetic analysis); Markhaseva & al., 2012 (p.57, Redescr..F, M, figs.F, M); Questel & al., 2016 (p.610, Fig.3, genetic analyse, Table V, VIII) | 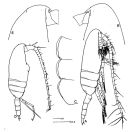 issued from : Frost B.W. in Can. J. Zool., 1989, 67. [Fig.4, p.531]. Female: A: habitus (lateral view from right side); B, anterior portion of cephalosome; C, Th1-Th3 (posteroventral margins from left side)). Male: D, habitus (lateral view from right side). All scale bars = 0.1 mm.
|
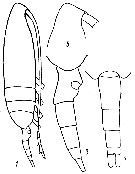
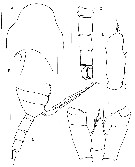
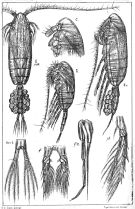 issued from : Sars G.O. in An Account of the Crustacea of Norway. Vol. IV. Copepoda Calanoida. Published by the Bergen Museum, 1903. [suppl. Pl.I]. As Pseudocalanus gracilis. Female and Male.
|
 issued from : K.A. Brodsky, N.V. Vyshkvartzeva, M.S. Kos & E.L. Markhaseva in Opred Fauna SSSR, 1983, 135. [p.221, Fig.103]. Female & Male from Geletin, 1977 (redrawn).
|
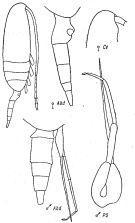
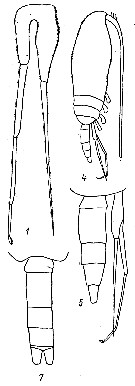
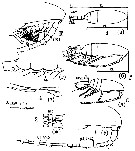
 Issued from : K.A. Brodskii in Calanoida of the Far Eastern Seas and Polar Basin of the USSR. Opred. Fauna SSSR, 1950, 35 (Israel Program for Scientific Translations, Jerusalem, 1967) [p.115, Fig.35]. As Pseudocalanus graclis. Female (from Arctic): habitus (lateral right side); R, rostrum; urosome (lateral right side); S1, P1. Male: habitus (dorsal); S5, P5.
|
 issued from : K.A. Brodsky, N.V. Vyshkvartzeva, M.S. Kos & E.L. Markhaseva in Opred Fauna SSSR, 1983, 135. [p.224, Fig.105]. As Pseudocalanus gracilis. After Geletin, 1977 (redrawn). Female & Male.
|
 issued from : Yu.V. Geletin in Issled. Fauny Morei, 1977, XX (XXVIII). [p.85, Fig.2]. With doubt. Frmale (from Kuril Islands): 1, habitus (lateral); 3, urosome (lateral); 5, forehead (lateral); 7, urosome (dorsal).
|
 issued from : Yu.V. Geletin in Issled. Fauny Morei, 1977, XX (XXVIII). [p.86, Fig.3]. With doubt. Male: 1, P5; 4, habitus (lateral); 5, urosome and P5 (lateral); 7, urosome (dorsal).
|
 issued from : G. Harding in Key to the adullt pelagic calanoid copepods found over the continental shelf of the Canadian Atlantic coast. Bedford Inst. Oceanogr., Dartmouth, Nova Scotia, 2004. [p.47]. Female & Male. Nota: Female forehead, in lateral view, angularly produced forward of the back of the rostrum. Posterolateral margins of metasome 1 and 2 with long spiniform processes (arrowed). length of coxa / length basis > 1.5. Male: A1: Length of fused segments 8-12 / length of fused segments 20-21 > 2. P4: Length of coxa / length basis > 1.5.
|
 issued from : E.L. Markhaseva, A.A. Abramova & N.D. Mingazov in Proc. Zool. Inst. RAS, 2012, 316 (1). [p.66, Fig.7]. Female (from 66°19.5'N, 33°39.4'E): habitus (lateral). Scale bar = 0.1 mm.
|
 issued from : E.L. Markhaseva, A.A. Abramova & N.D. Mingazov in Proc. Zool. Inst. RAS, 2012, 316 (1). [p.67, Fig.8]. Female: A, rostrum (ventral view); B-F, posteroventral margins of pedigers 2 and 3, arrows mark spiniform processes; G, posterior prosome and urosome (dorsal); H-I, posterior prosome and genital double-somite (dorsal); J, same (lateral). Scale bars: 0.1 mm.
|
 issued from : E.L. Markhaseva, A.A. Abramova & N.D. Mingazov in Proc. Zool. Inst. RAS, 2012, 316 (1). [p.68, Fig.9]. Male: A, cephalon (dorsal); B, forehead and rostrum (lateral); C, pedigers 2-5, urosomeand P5 (lateral); D, urosome (dorsal); E, syncoxa of Mxp; F, P4 (coxa and basis). Scale bars: 0.1 mm.
|
 issued from : E.L. Markhaseva, A.A. Abramova & N.D. Mingazov in Proc. Zool. Inst. RAS, 2012, 316 (1). [p.60, Fig.2 K, p.68, Fig.9F]. Female & Male (66°19.5'N; 33°39.4'E): P4 coxopod to basipod ratio. K: P4 coxo- and basipod (protopod) Pseudocalanus acuspes (arrows show measurements for thieir length. Scale bar = 0.1 mm. F: P4 coxo- basipod Pseudocalanus minutus. Scale bar = 0.1 mm. Nota: A key character to distinguish adults of P. minutus from P. acuspes is the length ratio of coxo-to basipod P4 length which is > 1.5 (1.51-1.86) in P. minutus and < 1.5 (1.20-1.45) in P. acuspes.
|
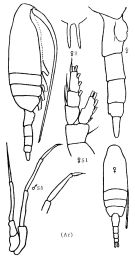
 Issued from : A.D. Samatov in Biologiya Morya, Vladivostok, 2001, 27 (4). [p.261, Fig. 1]. Female (from Avachinskaya Bay): 1-2, habitus (dorsal and lateral, respectively) with morphometric measures; 3, head (lateral view); 4, three last thoracic segments and genital segment (lateral view). Male (from Avachinskaya bay): 5, P5; 6, habitus (lateral); 7, A1; 8, P4 (basipods: B2 = coxo; B1 = basis). Note the characteristic of the ending of lateral tergite of the thoracic segments. Compare with P. acuspes and P. newmani.
|
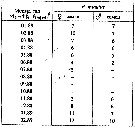
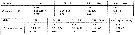 Issued from : A.D. Samatov in Biologiya Morya, Vladivostok, 2001, 27 (4). [p.262, Tableau 2 and 3]. Female and Male (from Avachinskaya Bay): Morphometric measures. TL = total length; PL : UL = cephalothoracic length: urosomal length; UIIIL : UIIIW = ratio (length : width of urosomal segment 3); CRL : UIIIW = ratio caudal ramus length : width urosomal segment 3; CL : UIII = ratio cephalothoracic length : urosomal segment 3 length; CRL : CRW = ratio caudal ramus length : width; A1 (8-12): A1 (20-21) = ratio length between segments ( 8-12) and (20-21).
* = mean; ** = extent sizes; *** = standard deviation.
See in Pseudocalanus newmani: same table 2 and 3.
|
 Issued from : M.S. Kos in Field guide for plankton. Zool Institute USSR Acad., Vol. II, 1976. After Sars, 1903. As Pseudocalanus gracilis. Female: 1-2, habitus (dorsal and leteral, respectively) with eggs; 3, P1. Male: 4, habitus (lateral); 5, P5 (L = left leg; R = right leg).
| | | | | Compl. Ref.: | | | W.H. Johnson, 1933 (p.1, vertical distribution vs. light); Fish, 1936 a (p.193, biology); Jespersen, 1939 ( p.40, Rem., Table 25, 26, 27, 29, 30); Hansen K.V., 1951 (p.231, migration vs. discontinuity layer); Gundersen, 1953 (p.1, 15, Table 9-16, seasonal abundance, Fjords distribution); Marshall & Orr, 1954 (p.393, Text-fig. I: egg, hatching); Østvedt, 1955 (p.14: Table 3, p.17, 25, 39, 57); Deevey, 1956 (p.127, 135, tab. IV); 1960 (p.5, Table II, fig.7, 8, 11, 12: annual abundance, Rem.: p.25, fig.18, 19) ; M.W. Johnson, 1961 (p.311, Table 2); Marshall & Orr, 1962 (tab.1, 3); Grice & Hart, 1962 (p.287, table 4: abundance); McLaren, 1963 (p.685, fig.3, 5, 10, 14, 15, growth v.s. temperature); Lacroix & Bergeron, 1963 (p.59, Tableau III, IV); Anraku, 1964 a (p.221, grazing); 1964 b (p.195, respiration-grazing v.s. temperature); Martin, 1965 (p.188); Grice & Hulsemann, 1965 (p.223); Carter, 1965 (p.345, fig.4, 56, 78, life history); Faber, 1966 a (p.419, 420); Harding, 1966 (p.17, 65); Furuhashi, 1966 a (p.295, vertical distribution vs mixing Oyashio/Kuroshio region); Minoda & Osawa, 1967 (p.9, vertical distribution); Maclellan D.C., 1967 (p.101, 102: occurrence); Dunbar & Harding, 1968 (p.319, 320); Hargrave & Geen, 1968 (p.332, phosphorus excretion); McLaren & al., 1968 (p.1267, hatching rate-temperature-salinity); Vinogradov, 1968 (1970) (p.262); Corkett & McLaren, 1969 (p.90, egg production, oil sac); Strömgren, 1969 (p.5); Corkett & McLaren, 1970 (p.161, development rate egg-CI); Corkett, 1970 (p.318, rearing, development times: N-adult); Salah & Tamas, 1970 (p.333); Iyoh, 1970 a (p.8: tab 2); Lock & McLaren, 1970 (p.638, Table 1, 2, Length/temperature); Arndt & Heidecke, 1973 (p.599, 603, fig.3); Poulet, 1973 (p.564, grazing); 1974 (p.109, seasonal grazing); Conover & Mayzaud, 1975 (p.151, fig.5, abundance); Poulet & Chanut, 1975 (p.706, feeding); Landry, 1975 a (p.434, Rem.: p.439, fig.3); Davis C.C., 1976 (p.37, fig.2, reproductive characteristics); Mackas & Bohrer, 1976 (p.77, fig.2, gut contents); Poulet, 1976 (p.117, feeding on living and non-living particles); 1977 (p.2381, grazing); 1978 (p.1126, grazing); Conover, 1978 (p.66, 69, feeding); Mayzaud & Poulet, 1978 (p.1144, feeding); McLaren, 1978 (p.1330, 1333: life history); Poulet & Marsot, 1980 (p.198, Fig.1, 2, Table 2, feeding); Herman & Mitchell, 1981 (p.739, Table 1, 3, length-volume); Harris, 1982 (p.71, feeding behaviour vs. particle-size spectrum); Citarella, 1982 (p.791, 798: listing, frequency, Tableau II, V); Vives, 1982 (p.290); Kovalev & Schmeleva, 1982 (p.83); Huntley & al., 1983 (p.143, Table 2, 3); Herman A.W., 1983 (p.709, vertical abundance vs. Chl.a); Sameoto, 1984 (p.213, Table 1, fig.9); 1984 a (p.767, vertical migration); Tremblay & Anderson, 1984 (p.6: Rem.); Sherman & al., 1984 (p.14); Nagasawa & Nemoto, 1985 (p.81); Mikhailovsky, 1986 (p.83, Table 1, ecological modelling); Mackas & Anderson, 1986 (p.115, Table 2); Yamamoto & Nishizawa, 1986 (p.1729, horizontal distribution); Sameoto & al., 1986 (p.53); Harding & al., 1986 (p.952, Table 1, 2, 3, 4, 5, 6, fig.3, diel vertical movements); Tsuda & Nemoto, 1987 (p.121, food concentration vs gut clearance time); Giguère & al., 1989 (p.522, 523); McLaren & al., 1989 (p.559, development v.s. temperature); Citarella, 1989 (p.123, abundance); Hirakawa & al., 1990 (tab.3); Hirakawa, 1991 (p.376: fig.2); Hattori, 1991 (tab.1, Appendix); Shih & Marhue, 1991 (tab.2, 3); Norrbin, 1991 (p.421, life history, gonad maturation); Herman, 1992 (p.395, fig.6 b, size distribution by OPC); Huntley & Lopez, 1992 (p.201, Table A1, egg-adult weight, temperature-dependent production); Kim & al., 1993 (p.270); Norrbin, 1993 (p.204); Richter, 1994 (tab.4.1a); Vinogradov & al., 1994 (tab.1); Pedersen & al., 1995 (p.266, tabl.II); Petryashov & al., 1995 (tab.1); Lefèvre-Lehoërff & al., 1995 (p.269, annual hydroclimatic variations); Abramova, 1996 (tab.1); Kotani & al., 1996 (tab.2); Yamaguchi & Shiga, 1997 (p.11); Park & Choi, 1997 (Appendix); Falkenhaug & al., 1997 (p.449, fig.5, spatio-temporal pattern); Kosobokova & al., 1998 (tab.2); Mauchline, 1998 (tab.8, 15, 19, 18, 33, 35, 45, 46, 47, 48, 53, 58, 61, 63); Dolganova & al., 1999 (p.13, tab.1); Abramova, 1999 (p.161, Table 2, 4); Bragina, 1999 (p.195); Halvorsen & Tande, 1999 (p.279, figs.3, 5); Pinchuk & Paul, 2000 (p.4, table 1, % occurrence); Kosobokova & Hirche, 2000 (p.2029, tab.2); Musaeva & Suntsov, 2001 (p.511, tab.1); Lischka & al., 2001 (p.186); Yamaguchi & al., 2002 (p.1007, tab.1); Auel & Hagen, 2002 (p.1013, tab. 2, 3); Pertsova & Kosobokova, 2002 (p.226, interannual vatiation); Kosobokova & al., 2003 (p.697, tab.2); Karnovsky & al., 2003 (p.289, Appendix 1, 2 ( auks relation/copepods); Hirche & Kosobokova, 2003 (p.769, Fig.3, 10, Table 2, 3); Kang & al., 2004 (p.1523, fig.8); Hopcroft & al., 2005 (p.198, table 2); Lischka & Hagen, 2005 (p.910, life history); Lewis & al., 2006 (p.501, Table I); Willis & al., 2006 (p.39, Table 2, advection vs changes in community structure); Lischka & Hagen, 2007 (p.443, lipids vs. diet); Lischka & al., 2007 (p.1331, digestive enzyme vs. seasonal); Deibel & Daly; 2007 (p.271, Table 1, Rem.: Arctic polynyas); Takahashi & al., 2008 (p.222, Table 2, grazing impact); Ohtsuka & al., 2008 (p.115, Table 5); Galbraith, 2009 (pers. comm.); Zervoudaki & al., 2009 (p.1475, fig.2); Chiba & al., 2009 (p.1846, Table 1, occurrence vs temperature change); Hopcroft & al., 2009 (p.9, Table 3); Dvoretsky & Dvoretsky, 2009 a (p.11, Table 2, abundance); Lewis & al., 2010 (p.695, Table I); Hirst & al., 2010 (p.2193, sex ratio); Kosobokova & Hopcroft, 2010 (p.96, Table 1, fig.7); Homma & Yamaguchi, 2010 (p.965, Table 2); Hopcroft & al., 2010 (p.27, Table 2); Hopcroft & Kosobokova, 2010 (p.49, figs.2, 3, , 6, 7, 8, Table 1, 2, Rem.: egg production); Dvoretsky & Dvoretsky, 2010 (p.991, Table 2); 2011 a (p.1231, Table 2: abundance, biomass); 2011 b (p.469, Table A, abundance, biomass); Kosobokova & al., 2011 (p.29, Table 2, 3, fig.4, Rem.: Arctic Basins); Hirche & Kosobokova, 2011 (p.2359, Table 3, abundance, biomass %); Pomerleau & al., 2011 (p.1779, Table III); Homma & al., 2011 (p.29, Table 2, 3, 4, 5, abundance, feeding pattern: suspension feeders); Matsuno & al., 2011 (p.1349, Table 1, abundance vs years); Matsuno & al., 2012 (Table 1, 2, fig.6); DiBacco & al., 2012 (p.483, Table S1, ballast water transport); Persson & al., 2012 (p.71, climate effects); Dvoretsky & Dvoretsky, 2012 (p.1321, Table 2, 3, abundance, biomass); Barton & al., 2013 (p.522, Table 1: metabolism, diapause, population dynamic, feeding mode, biogeo); Gusmao & al., 2013 (p.279, fig.1, sex ratio vs predators, fig.4: seasonal variation of sex ratio); Dvoretsky & Dvoretsky, 2013 (p.203, morphometric variation); Questel & al., 2013 (p.23, Table 3, interannual abundance & biomass, 2008-2010); Kwasniewski & al., 2013 (p.83, Table 2, 3, abundance); Dvoretsky & Dvoretsky, 2013 a (p.205, Table 2, % abundance); Coyle & al., 2014 (p.97, table 10, 11, 12); Ohtsuka & Nishida, 2017 (p.565, Table 22.1); El Arraj & al., 2017 (p.272, table 2); Record & al., 2018 (p.2238, Table 1: diapause); | | | | NZ: | 16 | | |
|
Distribution map of Pseudocalanus minutus by geographical zones
|
| | | | | | | | | | | | 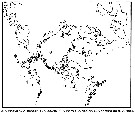 issued from : B.W. Frost in Can. J. Zool., 1989, 67. [p.529, Fig.3]. issued from : B.W. Frost in Can. J. Zool., 1989, 67. [p.529, Fig.3].
Geographical distribution of Pseudocalanus spp. |
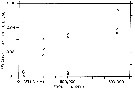
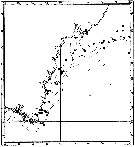 issued from : P. Jespersen, 1939 in Meddr Grønland, 1939, 119 (9). [p.43, Fig.20]. issued from : P. Jespersen, 1939 in Meddr Grønland, 1939, 119 (9). [p.43, Fig.20].
The occurrence of Pseudocalanus minutus in the western part of the south-east Greenland.
black circles: positive occurrence; x: negative occurrence. |
 issued from : G.B. Deevey in Bull. Bingham Oceanogr. Coll., 1960 (2). [p.24, Fig.12]. issued from : G.B. Deevey in Bull. Bingham Oceanogr. Coll., 1960 (2). [p.24, Fig.12].
Variations in length (from the topof the head to the base of the caudal rami) of Labidocera aestiva females in outside the Delaware Bay (NW Atlantic Ocean). |
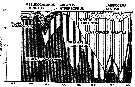
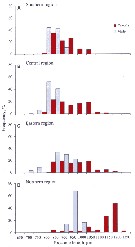
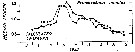
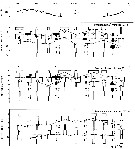 issued from : G.C. Harding, W.P. Vass, B.T. Hargrave & S. Pearre in Can. J. Fish. Aquat. Sci., 1986, 43 (5). [p.956, Fig.3]. issued from : G.C. Harding, W.P. Vass, B.T. Hargrave & S. Pearre in Can. J. Fish. Aquat. Sci., 1986, 43 (5). [p.956, Fig.3].
Depth-frequency diagrams and trap results of Pseudocalanus minutus females, males and stage V copepodids during the 24-h study.
Incident radiation recorded on deck is indicated in the upper panel; arrows indicate sunset and sunrise. The actual number of individuals moving up or down into the traps at 8, 14, 21 and 28 m is indicated next to each arrow.
Trap deployment and retrieval time was set to coincide with the middle of adjacent horizontal, net-tow series.
The 25 and 75 % population quartiles are connected by broken lines and the population median is indicated by a black dot.
The number located inside each depth-frequency diagram (scale lower right) is the estimated number of individuals/ m3 in the water column during this series of horizontal net tows.
Sampling for eight and four periods, respectively, between 10:30 August 19 and 09:30 August 20, 1980, at St. Georges Bay, shallow marine embayment open on the north to Northumberland Strait and the southern Gulf of St. Lawrence.
Nota: Engine and deployment of mooring traps figured in Harding & al. (1987) and Harding & al. (1986). |
 issued from : B.T. Hargrave, G.C. Harding, K.F. Drinkwater, T.C. Lambert & W.G. Harrison in Mar. Ecol. Prog. Ser., 1985, 20. [p.227, Fig.7]. issued from : B.T. Hargrave, G.C. Harding, K.F. Drinkwater, T.C. Lambert & W.G. Harrison in Mar. Ecol. Prog. Ser., 1985, 20. [p.227, Fig.7].
Major species of zooplankton present at the central station oin St. Georges Bay (45°45'N, 61°45'W) during 1977.
Nota: All zooplankton collections were made after sunset. The net towed obliquely throughout the water column (± 34 m in depth). |
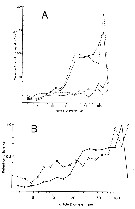 issued from : R.P. Harris in J. mar. biol. Ass. U.K., 1982, 62. [p.83, Figs. 10, 11]. issued from : R.P. Harris in J. mar. biol. Ass. U.K., 1982, 62. [p.83, Figs. 10, 11].
Comparison of the feeding behaviour of Calanus pacificus (large species) and Pseudocalanus minutus (small species) in two controlled experimental ecosystems (CEEs) with phytoplankton food (CEE 2: mainly diatoms; CEE 3: mainly flagellate population).
Fig.10: A, Mean clearance rate related to particle size. All experiments included. C. pacificus: black circle; P. minutus: open circle. CEE 2: line; CEE 3: dotted line.
Fig. 11: B, Comparison of mean retention efficiencies in relation to particle size. mean value for all experiments days, both CEEs combined.
C. pacificus: black circle; P. minutus: open circle.
Nota: In the fig.10 (A) the large decrease in C. pacificus clearance rate for the highest size channel may represent decreased ability to ''handle'' these large paricles. The Fig.11 (B) demontrates that below 20 micrometers P. minutus characterizing a small form) filters with a greater efficiency in all size channels. Between 20 and 70 micrometers the converse is observed with C. pacificus (characterizing a large form) having greater efficiency.
For the authors, it was found over a series of experiments lasting 72 days, during which a wide range of phytoplankton was encountered, that on average fed on slightly larger particles (1.2 x diameter) than Pseudocalanus. However, despite the large difference in body size (x 10 dry weight) there was evidence that on most occasions both species were competing for the same food resource over a wide range of the particle-size spectrum. |
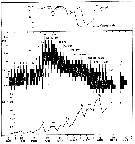 issued from : I.A. McLaren inJ. Fish. Res. Board Can., 1978, 35. [p.1333, Fig.2]. issued from : I.A. McLaren inJ. Fish. Res. Board Can., 1978, 35. [p.1333, Fig.2].
Life cycles of Pseudocalanus minutus in Loch Striven (55°55'N, 05°10'W).
Relative abundance of C IV as a percentage of all copepodids (lower panel); size and numbers per haul (including combined hauls from 60 m to 10 m and 10 to 0 m) of adult females (middle panel), and percentage of nauplii and copepodids above 10 m (from split hauls, taken from 60 to 10 m and 10 to 0 m) (upper panel).
Successive generations as infered from peaks in the C IV cohorts and size changes designated as Go, G1, etc.
Data from Marshall (1949, tables III and X). |
 issued from : J.C.H. Carter in Limnol. Oceanogr., 1965, 10 (3). [p.348, Fig.4]. issued from : J.C.H. Carter in Limnol. Oceanogr., 1965, 10 (3). [p.348, Fig.4].
Numbers/m2 of all stages of Pseudocalanus minutus (from Tessiarsuk Basin: 56°30'N, 61°57'W) through the 1961 season and spring 1962.
Broken lines indicate probable paths of development of individual broods.
Nota: Tessiarsuk is a elongate lagoon of 545 hectares, a depth between 54 m (upper basin) and 26 m (lower basin), with approximately two days out of three some seawater enters at high tides. Like most meromictic lakes, Tessiarsuk shows gradual desoxygenation with depth.
The marked and perpetuated bimodality in the earlier samples from the lake seems interpreted as the result of two successive and relatively synchronous spawnings by the overwintered animals.
In the upper basin the two spring broods iof the first generation, G1B1 and G1B2, appear as abundance peaks at CI, respectively, on 20 June. Development of G1B1 progressed steadily and by 15 August the most precocious had matured, supplanting the smaller adults of G0 (see fig.5: Size distribution). G1 B2, on the other hand, remained stationary at NIII until 15 August when the mode disappeared and further development became difficult to follow. It is possible that this brood is finally represented on 21 September by the mode at either CII or CIV. A second generation is first suggested by the mode at NI on 28 August. Intensive spawning did not occur until later as shown by the large numbers of naupliar stages I-III on 21 September.In the lower basin during the early part of the season, P. minutus showed the same general pattern of breeding and development as those in the upper basin.
In Tessiarsuk, because of oxygen deficiency at depth, the species was mainly restricted to the upper waters. |
 issued from : J.C.H. Carter in Limnol. Oceanogr., 1965, 10 (3). [p.349, Fig.5]. issued from : J.C.H. Carter in Limnol. Oceanogr., 1965, 10 (3). [p.349, Fig.5].
Size (cephalothorax length) distribution of adult female P. minutus in the two basins of Tessiarsuk and Anaktalik Bay during the 1961 season and spring of 1962.
Nota: In Tessiarsuk and Anaktalik Bay, phytoplankton data are insufficient to allow speculation on the relationship between feeding and length. However, a certain inverse relationship does appear to exist between remperature and length.
Mean cephalothorax length of copepodites I-V in the lake was relatively constant throughout the summer. A slight decrease occurred in midsummer but this trend was reversed toward the end of the season.
In Anaktalik Bay all pre-adult copepodites attained lengrh maxima between mid-June and mid-July, when they were markedly larger than the animals in the lake. This was followed by a sharp size decrease during late July and August. The water column in the bay was considerably cooler that in the lake during winter and spring. These lower temperatures persisted until warming occurred in July and August, in agreement with the earlier length maxima followed by the midsummer size reduction. September temperatures in the bay declined slightly and this was immediately reflected in length increases by copepodites I-III, although CIV continued to get smaller and CV showed erratic behavior, possibly due to rge small sample available.
In April 1962, most copepodites were as small or smaller than at any time during the previous summer, suggesting that they might have reached their present stage of development in the autumn when the water was fairly warm. By 19 May, a marked increase in length was seen in most stages, in agreement with the observation that development during the preceding period occurred when temperatures under the ice cover were still very low.
The pronounced bimodality in adult females of Go in 1961 can be explained only tentatively in the absence of earlier samples. Nevertheless, it appears likely that the smaller animals passed through their entire development in warm water and matured in the previous autumn, while the larger ones, possibly spawned late in the season, spent the winter as young copepodites and reached maturity in early spring. |
 issued from : J.C.H. Carter in Limnol. Oceanogr., 1965, 10 (3). [p.347, Figs.2, 3]. issued from : J.C.H. Carter in Limnol. Oceanogr., 1965, 10 (3). [p.347, Figs.2, 3].
Fig.1: Vertical distribution of salinity in Tessiarsuk and Anaktalik Bay in mid-June and mid-September 1961 and in mid-April 1962; Fig.2: Vertical distribution of temperature in Tessiarsuk and Anaktalik Bay in mid-June and mid-September 1961 and in mid-April 1962. |
 issued from : C..J. Corkett & I.A. McLaren in J. exp. mar. Biol. Ecol., 1969 , 3. [p.97, Fig.4]. issued from : C..J. Corkett & I.A. McLaren in J. exp. mar. Biol. Ecol., 1969 , 3. [p.97, Fig.4].
Relationship between the length of individual female Pseudocalanus minutus (from Halifax) and the numbers of eggs in individual sacs at the designated concentrations of Isochrisis.
Nota: Experimets at 6-7°C and animals fed Isochrysis galbana (flagellates).
An examination of the population off Halifax from January to March 1967 showed that 56.5 % of eggs were carried in sacs and 43.5 % were carried in masses; free eggs may also be taken in the plankton.
Females of a given length which produce small eggs may produce more eggs per clutch, and those which produce large eggs may produce fewer clutches. Such differences in the size of eggs among females of the same length are probably inherent and little affected by conditions at the time of laying.
The most noteworthy result of these long-term experiments is that the mean numbers of eggs in the sacs produced by 'healthy' females, before evidence of reproductive decline, was apparently uninfluenced by wide variations in food supply from 6 x10power 5 to 3x 10power 4 cells/ml.
There was no correlation between the number of sacs laid and female size, although large numbers (8-11 sacs) were produced only by females between 0.89 and 1.04 mm in length. Becaus the weak number of experimental animals completed 8-11 full-sized sacs it would be unsafe to conclude that the potential number of such sacs differs in small or large females; it seems simplest to assume that this potential is about 10 egg-sacs.
The minimum time between the production of egg sacs must be determined by the time taken for eggs to hatch. This time will depend on temperature (McLaren, 1966). The time between the hatching of one clutch and the formation of the next can presumably be affected by food supply. |
 issued from : C..J. Corkett & I.A. McLaren in J. exp. mar. Biol. Ecol., 1969 , 3. [p.101, Fig.6]. issued from : C..J. Corkett & I.A. McLaren in J. exp. mar. Biol. Ecol., 1969 , 3. [p.101, Fig.6].
Relationship betwwen food supply (Isochrysis replenished at the stated level at weekly intervals) and relative mean size of the oil sacs of P. minutus (from Halifax, Nova Scotia) during the period of full egg production; relative size of the oil sac is obtained from estimates of volume of oil sac (length x twice the breadth) divided by cephalothorax volume (0.0876 x Lpower 3.32 after McLaren, 1965).
Nota: The sizes of the oil sacs of individual females during the long-term experiment showed for most females a similar pattern of variation : the oil sac usually at first enlarged, then remained constant before becoming smaller, and sometimes even disappearing before death.. Usually the oil sac became smaller before the last egg sac was produced.
Females at high food levels contained large oil sacs and those at low food levels had very small ones, if any, but still laid eggs, which suggests that lipid is laid down by these animals when rate of egg production cannot be increased. Below ceratin food levels, food energy is put into eggs ; above these levels, some appears to be stored. It may be inferred that when, in nature, these copepods have well developed oil sacs during the reproductive season they are reproducing at maximal, temperature determined rates.
It is possible that some form of oil sac index might be used to correlate laboratory food levels with those found in nature so that a ceratin size of oil sac may indicate a particular level of assimilable food. |
 issued from : C..J. Corkett in Helg. wiss Meeres., 1970, 20. [p.321, Table I]. issued from : C..J. Corkett in Helg. wiss Meeres., 1970, 20. [p.321, Table I].
Development times for the larval stages of Pseudocalanus minutus (from Halifax, Nova Scotia) from hatching to adult female in experiment at about 11.9°C and fed Isochrysis galbana. |
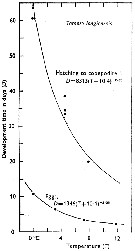
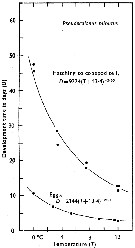 Issued from : C.J. Corkett & I.A. McLaren in J. mar. biol. Ass. U.K., 1970, 50. [p.164, Fig.I]; Issued from : C.J. Corkett & I.A. McLaren in J. mar. biol. Ass. U.K., 1970, 50. [p.164, Fig.I];
Development times of eggs to harching and between hatching and appearance of copepodite I in abundant food at the different temperatures. The points are means for eggs and individuals for older stages.
Individuals of Pseudocalanus minutus from waters near Halifax (Nova Scotia) raised in vials with an excess of food (Isochrysis galbana) at several controlled temperatures (See in Corkett, 1967). |
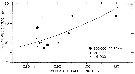
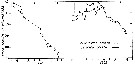
 Issued from : R.J. Conover in Rapp. P.-v. Réun. Cons. int. Explor. Mer, 1978, 173. [p.69, Fig.54]. Issued from : R.J. Conover in Rapp. P.-v. Réun. Cons. int. Explor. Mer, 1978, 173. [p.69, Fig.54].
Regression between rate of ingestion (I) for Pseudocalanus minutus from Bedford Basin, Nova Scotia (Canada) and particle concentration in the same environment. |
 Issued from : V.G. Dvoretsky & A.G. Dvoretsky in Acta Zool., 2013, 94. [p.206, Fig.3]. Issued from : V.G. Dvoretsky & A.G. Dvoretsky in Acta Zool., 2013, 94. [p.206, Fig.3].
Pseudocalanus minutus. Frequency histograms of prosome length distributions in male and female from various Barents Sea regions (A: southern; B: central; C, eastern; D: northern) delineated by cluster analysis based on hydrological variables.
Sampled stations in August-September 2007. Zooplankton samplescollected with a vertically hauled Juday net (168µm mesh size).
For the authors it is possible that the two groups delineated by the discriminant function analysis (DFA) are cryptic subspecies or suprapopulations; however, that the morphologically differentiated populations of P. minutus have no species status. Although the discriminant analysis swowed that the classification rate of individuals to correct populations was high (78.4% and 62.2% in case of male and female copepods, respectively), there was still overlap of individuals; At the time, it should be noted that the northern population strongly differed from the others. The present morphometric analysis in itseff does not allow us to conclude that the current species status of P. minutus is in need of revision; hence, the observed morphological variation could be a geographical gradient of ecophenotypic variation connected with hydrological variability.
An other main morphometric character of primary importance in separating the populations in P. minutus (especially in males) was the antennule length. This parameter can vary in association with enviromental conditions (temperature, salitnity); it is suggested that antennule variability mignt be adaptative for maintening neutral buoyancy or for adding drag to slow sinking when buoyancy is not neutral (see Shuvalov, 1975), in the recognition of conspecific individuals and in feeding behavior (see Landry, 1980, Landry & al., 1985). Moreover, male copepods use their antennule to grab females when inseminating; it may be suggested that longer males with more hignly segmented antennules would have some advantage during copulation. |
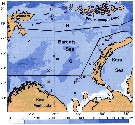 Issued from : V.G. Dvoretsky & A.G. Dvoretsky in Acta Zool., 2013, 94. [p.204, Fig.1]. Issued from : V.G. Dvoretsky & A.G. Dvoretsky in Acta Zool., 2013, 94. [p.204, Fig.1].
Location of sampling stations in the Barents Sea in August-September 2007. Regions delineated on the basis of their hydrological conditions: S, southern; C, central; E, eastern; N, northern. |
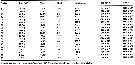 Issued from : V.G. Dvoretsky & A.G. Dvoretsky in Acta Zool., 2013, 94. [p.205, Table 1]. Issued from : V.G. Dvoretsky & A.G. Dvoretsky in Acta Zool., 2013, 94. [p.205, Table 1].
Hydrological data from sampling stations of Pseudocalanus minutus in Barents Sea in August-September 2007.
Water temperature and salinity were measured at each station for the whole water column using an CTD profiler. |
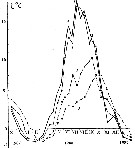
 Issued from : G. B. Deevey in Bull. Bingham Oceanogr. Coll., 1960, 17 (2). [p.66, Fig.6]. Issued from : G. B. Deevey in Bull. Bingham Oceanogr. Coll., 1960, 17 (2). [p.66, Fig.6].
The calculed and observed mean cephalothorax length cycles of female Pseudocalanus minutus in Long Island Sound, (E coast U.S.A.) March 1952 to May 1953. Calculed lengths based on the temperature and Chlorophyll of the day of sampling. |
 Issued from : G. B. Deevey in Bull. Bingham Oceanogr. Coll., 1960, 17 (2). [p.68, Table V]. Issued from : G. B. Deevey in Bull. Bingham Oceanogr. Coll., 1960, 17 (2). [p.68, Table V].
Simple, partial and multiple correlation coefficients. for mean length of cephalothorax with the temperature and Chlorophyll of the day of sampling and averaged for the previous month.
The calculed and observed mean cephalothorax length cycles of female Pseudocalanus minutus in Long Island Sound, (E coast U.S.A.) March 1952 to May 1953. |
 Issued from : G.B. Deevey in Bull. Bingham Oceanogr. Coll., 1960, 17 (2). [p.74, Fig.10]. Issued from : G.B. Deevey in Bull. Bingham Oceanogr. Coll., 1960, 17 (2). [p.74, Fig.10].
Obsrrved seasonal variations in median cephalothorax length of female Pseudocalanus minutus (Marshall, 1949) in Loch Striven in 1933) compared with length calculated from the mean temperature and number of diatoms of the month previous to sampling. |
 Issued from : G. B. Deevey in Bull. Bingham Oceanogr. Coll., 1960, 17 (2). [p.73, Table VIII]. Issued from : G. B. Deevey in Bull. Bingham Oceanogr. Coll., 1960, 17 (2). [p.73, Table VIII].
Correlation coefficients for mean cephalothorax lengths with the temperature and phytoplankton of the day of samplingt and averaged for the previous four weeks obtained with 31 and 29 pairs of data for female and copepodite stage III Pseudocalanus minutus from Loch Striven (W Clyde estuary)).
Quantity of diatoms (data published by S.M. Marshall, 1949 .
In 1933 the extreme range temperature at 0 m was 4.5-16.4°C and at 30 m 6.37-12.98°C. |
 Issued from : G.A. Deevey in Bull. Bingham Oceanogr. Coll., 1960, 17 (2); [p.76, Table IX]. Issued from : G.A. Deevey in Bull. Bingham Oceanogr. Coll., 1960, 17 (2); [p.76, Table IX].
Correlation coefficients for mean cephalothorax lengths for Pseudocalanus minutus females and males with the temperature at sampled from the Block Island Sound, Rhode Island (data from Deevey, 1952) |
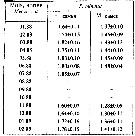 Issued from : A.D. Samatov in Biologiya Morya, Vladivostok, 2001, 27 (4). [p.263, Table 4]. Issued from : A.D. Samatov in Biologiya Morya, Vladivostok, 2001, 27 (4). [p.263, Table 4].
Seasonal total length in female (F) and male (M) in Avachinskaya Bay (SE Kamchatka : ± 53°00' N, 158°30' E). |
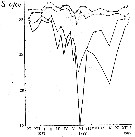 Issued from : A.D. Samatov & I.N. Samatova in Biologiya Morya, 1996, 22 (1). [p.25, Fig.5]. Seasonal variation of the salinity (S per 1000). Issued from : A.D. Samatov & I.N. Samatova in Biologiya Morya, 1996, 22 (1). [p.25, Fig.5]. Seasonal variation of the salinity (S per 1000).
1- surface mean; 2- 10 m depth; 3- in the bottom; 4- in surface at the station 2. (western Bay). |
 Issued from : A.D. Samatov & I.N. Samatova in Biologiya Morya, 1996, 22 (1). [p.25, Fig.5]. Seasonal variation of the temperature (t°C)). Issued from : A.D. Samatov & I.N. Samatova in Biologiya Morya, 1996, 22 (1). [p.25, Fig.5]. Seasonal variation of the temperature (t°C)).
1- surface mean; 2- 10 m depth; 3- in the bottom; 4- in surface at the station 2. (western Bay). |
 Issued from : A.D. Samatov in Biologiya Morya, Vladivostok, 2001, 27 (4). [p.260, Table 1]. Issued from : A.D. Samatov in Biologiya Morya, Vladivostok, 2001, 27 (4). [p.260, Table 1].
Seasonal abundance in female (F) and male (M) (by m3) in Avachinskaya Bay (SE Kamchatka : ± 53°00' N, 158°30' E).
Compare with P. newmani and P. acuspes. |
| | | | Loc: | | | NW Atlantic (Delaware Bay, Long Island Sound, Buzzards Bay, Cape Cod, Gulf of Maine, Narragansett Bay, Bay of Fundy, off SE & SW Nova Scotia, Halifax, Bedford Basin, Nova Scotia, Bras d'Or Lake, Morrison's Pond, Shédiac Bay, Northumberland Strait, Halifax, Passamaquoddy Bay, Rimouski, G. of St. Lawrence, Bradelle Bank, Baie des Chaleurs (Shippegan Channel), Newfoundland, Ameralik & Godthaab fjords), N Labrador (Tessiarsuk Basin, Anaktalik Bay), Baffin Bay, Ongac Lake, Winton Bay, Baffin Sea, Disko Bay, Greenland Sea, Fram Strait, Iceland, Norwegian Sea, Malangen fjord, Tromsø fjords, Nordvestbanken, Raunefjorden, Balsfjorden, Kongsfjorden, Spitzbergen, Rijpfjord, Austfjord, Barents Sea, Franz Josef Land, Pechora Sea, North Sea, Danish waters, Kattegat, Gulf of Mecklenburger, Arkona Basin, Arct. (White Sea, Lomonosov Ridge, Fletcher's Ice Is., Kara Sea, Laptev Sea, Chukchi Sea , off NW Alaska, Nansen Basin, Amundsen Basin, Makarov Basin, Canada Basin), Bering Sea, Okhotsk Sea , SE Kamchatka, S Sakhalin, SE Indian (in Chiba & al., 1957, p.306), China Seas (South China Sea), S & E Korea, Japan Sea, Japan, Honshu (Onagawa Bay, Toyama Bay), off Sanriku, Oyashio region, SW Hokkaido, Station Knot (44°, 155°E), S Aleutian Basin, S Aleutian Is., G. of Alaska, British Columbia, Fjord System (Alice Arm & Hastings Arm), Portland Inlet, Chile (in Fagetti, 1962, p.14), Delaware Bay (inDeevey, 1960); Portugal (in Vilela, 1968), off Moroccan Atlantic Coast, Canary Is. (in Roe, 1972; Vives, 1982, Lozano Soldevilla & al., 1988), Medit. (W Basin, Lebanon Basin, Alexandria), Suez Canal, Red Sea, Pacific (tropical, Pacif. (central N), China Seas (in C.B. Wilson, 1950) | | | | N: | 182 ? | | | | Lg.: | | | (45) F: 1,6-1,2; M: 1,25-1; (55) M: 1,3; (65) F: 1,65; M: 1,15; (72) F: 1,26; (122) F: 2,14-1,35; M: 1,62-1,12; (131) F: 1,4-1; M: 1,1-0,85; (199) F: 1,44-1,06; ? (208) F: 1,91-1,07; M: 1,28-0,92; (1222) F: 1,45-2,15; M: 1,20-1,55; (1304) F: 1,29-1,85; M: 1,25-1,30; (1232) F: 1,5-1,7; M: 1,15-1,3; {F: 1,00-2,14; M: 0,85-1,62} | | | | Rem.: | epi-bathypelagic.
With (1915, p.60) underlines the occurrence of a female P5 in certain individuals (possibly in confusion with P. elongatus.
The presence of this Arctic species in the Mediterranean Sea, in the Red Sea and in the temperate Atlantic Ocean requires confirmation.
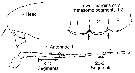
Characteristics according to Frost (1989): See limits of lenght measurements in the figure of the genus Pseudocalanus.
Female: Frontal part in lateral view ogival; posterovental margins of Th1 and Th2 with long spiniform processes; ratio sizes of P4 B1:B2 > 1.5; ratio size Prosome: Urosome = 2.39 (2.22-2.52).
Male: ratio of lenghts of P4 B1:B2 > 1.5; ratio of lenghts of segments of P4 (8-12):(20-21) > 2.0; ratio of lenghts Cephalosome: U2 = 5.71 (5.19-6.15).
For Itoh (1970 a, fig.2, from co-ordonates) the Itoh's index value of the mandibular gnathobase = 405 (as Pseudocalanus gracilis).
Characteristic after Markhaseva & al. (2012, p.57) to distinguish the coexistence of P. acuspes and P. minutus in the White Sea (Chupa Inlet) ; P4 coxopod to basipod ratio more than 1.5 in P. minutus and less than 1.5 in P. acuspes.
After Karnovsky & al., 2003 (p.289, Appendix 2) the mean dry mass (mg) female is 0.015.
The feeding mode after Barton & al. (2013, Table 1) is 'feeding current' (hovering) (See definition in Rem. Centropages typicus). | | | Last update : 19/06/2023 | |
|
|
 Any use of this site for a publication will be mentioned with the following reference : Any use of this site for a publication will be mentioned with the following reference :
Razouls C., Desreumaux N., Kouwenberg J. and de Bovée F., 2005-2026. - Biodiversity of Marine Planktonic Copepods (morphology, geographical distribution and biological data). Sorbonne University, CNRS. Available at http://copepodes.obs-banyuls.fr/en [Accessed July 15, 2026] © copyright 2005-2026 Sorbonne University, CNRS
|
|
|
|


;)
;)
;)
;)
;)
;)
;)
;)
;)
;)
;)
;)
;)

;)
;)
;)
;)
;)
;)
;)
;)
;)
;)
;)
;)
;)
;)
;)
;)
;)
;)
