|
|
 |
|
Calanoida ( Order ) |
|
|
|
Eucalanoidea ( Superfamily ) |
|
|
|
Eucalanidae ( Family ) |
|
|
|
Eucalanus ( Genus ) |
|
|
| |
Eucalanus bungii Giesbrecht, 1892 (F,M) | |
| | | | | | | Syn.: | Eucalanus elongatus bungii Giesbrecht, 1892 (p.131, 149, figs.); Tanaka, 1935 (p.143, figs.F); Brodsky, 1950 (1967) (p.100, figs.F,M);
E. giesbrechti Mori, 1937 (1964) (p.22, figs.F, juv.M);
E. elongatus : Campbell, 1929 (p.308);
Eucalanus bungii bungii : M.W. Johnson, 1938 (p.167, figs.F,M, Rem.); Minoda, 1958 (p.253, Table 1, 2, abundance); M.W. Johnson, 1963 (p.89, Table 1, 2); Kitou, 1965 (p.95, Tables 1-5); Furuhashi, 1966 a (p.295, vertical distribution vs mixing Oyashio/Kuroshio region, Table 10); Heinrich, 1968 (p.287, fig.1, 3); Dunbar & Harding, 1968 (p.315, Rem.: p.322); Omori, 1969 (p.5, Table 1); Morioka, 1972 a (p.314); Lubny-Gertzyk, 1968 (p.275); Minoda, 1971 (p.16); 1972 (p.326); Gordon & al., 1985 (p.89, Table 2, 3, fish diet); Sasaki al., 1988 (p.505, tab.1, fecal pellets flux); Hattori, 1991 (tab.1, Appendix); Shih & Young, 1995 (p.69); Jang M.-C & al., 2012 (p.37, abundance and seasonal distribution); Lewis A., 2014 (p.1200, Table I, II, figs. labrum-paragnaths) | | | | Ref.: | | | Sewell, 1948 (p.555, Rem.); Davis, 1949 (part., p.16); Brodsky, 1950 (1967) (p.100, figs.F,M); 1962 c (p.105, Rem.); Park, 1968 (p.538, Pl.4, figs.1, 2: F, no fig. 3); Fleminger, 1973 (p.967, 978, 979, 998, fig.F); Sullivan & al., 1975 (p.176, figs.Md); Gardner & Szabo, 1982 (p.152, figs.F,M); Brodsky & al., 1983 (p.207, figs.F,M, Rem); Chihara & Murano, 1997 (p.788, tab.4, Pl.98,102: F,M); Goetze, 2003 (p.2322 & suiv.); Machida & al., 2004 (p.71, genetic); Shoden & al., 2005 (p.497, tab.1); Machida & al., 2006 (p;1071, tab.1,3, molecular phylogeny); Lewis & al., 2006 (p.501, Table I, fig.F); Kim S. & al., 2013 (p.64, fig.3: mitochondrial genome); Ohtsuka & Nishida, 2017 (p.577, Rem.) | 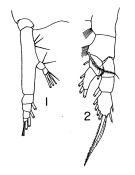 issued from : T. Park in Antarct. Res. Ser. Washington, 1968, 66 (3). [p.539, Pl.4, Figs.1-2]. As Eucalanus bungii bungii. Female (from subtropical Central North Pacific: 42°20'N, 154°57'W): 1, Md (mandibular palp); 2, P1. Nota: The basis of the mabibular palp has 3 setae.
|
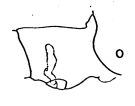 issued from : A. Fleminger in Fishery Bull. natn. Ocean. Atmos. Adm., 1973, 71 (4). [p.968, Fig.1, o (p.969)]. Female: o, genital segment (lateral right side).
|
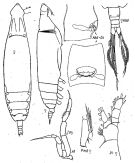 issued from : K.A. Brodsky, N.V. Vyshkvartzeva, M.S. Kos & E.L. Markhaseva in Opred Fauna SSSR, 1983, 135. [p.207, Fig.94]. Female & Male. Nota: habitus and P5 female from Brodsky, 1950; other figures from Sea of Japan. P5 male from Brodsky,1950.
|
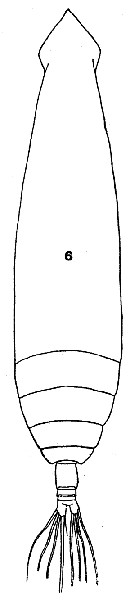 issued from : T. Mori in The pelagic Copepoda from the neighbouring waters of Japan, 1937 (2nd edit., 1964). [Pl.7, Fig.6]. As Eucalanus giesbrechti. Female: 6, habitus (dorsal).
|
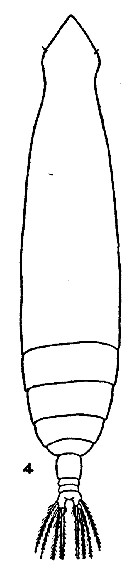 issued from : M.W. Johnson inBull. Scripps Instn Oceanogr., techn. Ser., 4 (6). [p.166, Fig.4). Female (from G. of Alaska-Bering Sea): 4, habitus (dorsal). Nota: A1 of about equal length, overreaching the caudal rami by about the last 3 or 4 segment.
|
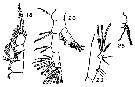 issued from : M.W. Johnson inBull. Scripps Instn Oceanogr., techn. Ser., 4 (6). [p.168, Figs.20,2 3, 25]. Female: 20, A2; 23, Md (mandibular palp); 25, posterior border of Mx2. Nota: Terminal segment of endopod of Md with 3 long setae and 1 short seta; 2nd mandibular basis with 3 lateral setae
|
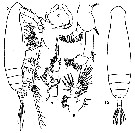 issued from : M.W. Johnson inBull. Scripps Instn Oceanogr., techn. Ser., 4 (6). [p.167, Figs.5-10]. Male: 5, 10, habitus (lateral and dorsal, respectively); 6, P5 (anterior view); 7, A2; 8, P1; 9, Mx1. Nota: A1 extend beyond the caudal rami by about 4 segments. Gnathobase of Mx1 with only a few weak setae; teeth of mandibular blade entirely wanting, and the setae of 2nd basis also wanting or reduced to 1 or 2 very short setae (in the earlier developmental stages these appendages are normal with 7 to 8 teeth on the blade and with 3 setae on the 2nd basis). Urosome 5 segmented, the anal segment being confluent with the caudal rami, the left ramus somewhat longer and broader than the right.
|
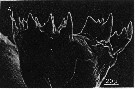 issued from : B.K. Sullivan, C.B. Miller, W.T. Peterson & A.H. Soeldner in Mar. Biol., 1975, 30. [p.178, Fig.3, A]. Eucalanus bungii (from Subarctic Pacific: 50°N, 145°W): A, SEM micrograph of left Md (posterior surface).
|
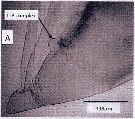 Issued from : A. Lewis in Crustaceana, 2014, 87 (10). [p.1208, Fig.1, A]. Eucalanus bungii bungii Johnson, 1938: A, lateral view of anterior body including labium-paragnath complex. See: http://booksandjournals.brillonline.com/content/journals/15685403. Nota: Relative to the body axis, the average angle of the labral-paragnath complex is -10°; the complex faces down and is tilted slightly towards the posterior end. The labrum is well behind the first antenna, 13% of the total body length. In lateral view, the labrum is hood-shaped; the anterior labral lobe is not present. The lip of the labrum is membranous, the distal edge trilobate in ventral view, each lobe bearing setules and spinules (see in fig.3 B). The paragnaths are ovoid tubes and have vertical rows of setules and claw-like spinules (see in fig.2B). Rhe average length of the complex (labrum-paragnath) is 9% of the total body length; the length of the labrum is 50% of the length of the entire complex. The height of the labrum is slightmly greater than its length; the height of the paragnaths is 75% of its length
|
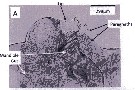 Issued from : A. Lewis in Crustaceana, 2014, 87 (10). [p.1209, Fig.2, A]. Eucalanus bungii bungii Johnson, 1938: A, enlarged view of labrum and lip plus paragnaths. See: http://booksandjournals.brillonline.com/content/journals/15685403.
|
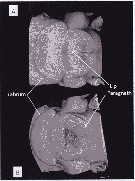 Issued from : A. Lewis in Crustaceana, 2014, 87 (10). [p.1210, Fig.3]. Eucalanus bungii bungii Johnson, 1938: A, Confocal: ventral view of complex; B, confocal: ventral view with image rotated to view paragnaths and opening between paragnaths and lip of labrum. See: http://booksandjournals.brillonline.com/content/journals/15685403.
|
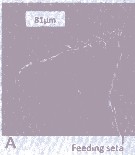 Issued from : A. Lewis in Crustaceana, 2014, 87 (10). [p.1220, Fig.13, A]. Eucalanus bungii bungii Johnson, 1938: A, gnathobase. See: http://booksandjournals.brillonline.com/content/journals/15685403. Nota: The mandible gnathobase figure does not provide the detail given in Sullivan & al. (1975) although it does show several short teeth and flattened rough surfaces as well as the short, spinulate feeding seta on the dorsal end. This spinulated seta on the dorsal end fits into the oesophagus and enables food introduction into the digestive tract as a result of gnathobase movement (see in Lewis & al., 1998). There is evidence that movement between the two gnathobase can be very rapid during trituration. The role of the gnathobase is sufficiently different from that of the labrum and paragnaths that the choice was to use labrum-paragnath rather than labrum-gnathobase-paragnath for the complex name. The nature of the teeth and grinding surfaces on the gnathobase provide support for the detritivore nature suggested by Ohtsuka & al. (1993). This is even though the species has been considered a herbivore on the basis of its fatty acids and stable isotopes (See in El-Sabaawi & al., 2009).
| | | | | Compl. Ref.: | | | C.B. Wilson, 1950 (p.208); Heinrich, 1962 (p.465, life history, production); Brodsky, 1964 (p.105, 107); Harding, 1966 (p.70); Vinogradov, 1968 (1970) (p.44-45, 49, 51, 53, 55, 56, 60, 94, 109, 141, 234, 243, 244, 256, 291); Mullin, 1969 (p.308, Table I: estimates of production); Itoh, 1970 a (p.1, tab.2); Björnberg, 1973 (p.297, 386); Fleminger & Hulsemann, 1973 (p.343, chart); Peterson & Miller, 1975 (p.642, 650, Table 3, interannual abundance); 1976 (p.14, Table 1, 2, 3, abundance vs interannual variations); 1977 (p.717, Table 1, seasonal occurrence); Krause & Lewis, 1979 (p.2211, ontogenic migration), Mackas & Sefton, 1982 (p.1173, Table 1); Dagg & al., 1982 (p.45, Table 3, abundance, grazing, excretion); Miller & al., 1984 (p.201, life history); Springer & Roseneau, 1985 (p. 231, tab. 2); Kawamura & Hirano, 1985 (p.626, Table 1, fig.3, horizontal distribution); Bamstedt & Tande, 1985 (p.259, Table 2: literature data respiration & excretion); Vidal & Smith, 1986 (p.523, Table 1, biomass); Smith & Vidal, 1986 (p.215, Table 4, fig.4, 7, abundance); Lewis & Thomas, 1986 (p.1079, tidal transport); Miller & al., 1988 (p.1, fig.4, Rem.: p.6, 17); Odate & Maita, 1988 (p.228, Rem.: p.230); Springer & al., 1989 (p.359, Fig.5, 10, 11, Table 1) , Cervantes-Duarte & Hernandez-Trujillo, 1989 (tab.3); Shih & Marhue, 1991 (tab.2, 3); Huntley & Lopez, 1992 (p.201, Table 1, A1, eggs, eight-adult weight, temperature-dependent production); Dagg, 1993 (p.163, Table 1, 2, 3, figs., abundance, gut pigment); Dower & Mackas, 1996 (p.837, seamount effects vs. abundance); Mauchline, 1998 (tab.45, 58); Dolganova & al., 1999 (p.13, tab.1); Bragina, 1999 (p.195); Russell & al., 1999 (p.77, tab.1); Mackas & Tsuda, 1999 (p.335, Table 1); Lenz & al., 2000 (p.338); Pinchuk & Paul, 2000 (p.4, table 1, % occurrence, biomass: figs.5, 6, 10, 26); Mackas & al., 2001 (p.685, Tab. 3, 6, fig.3: interannual changes in species composition); Yamaguchi & al., 2002 (p.1007, tab.1); Mackas & Galbraith, 2002 a (p.423, Table 2); Yamaguchi & al., 2004 (p.479, tab.2); Tsuda & al., 2004 (p.10, life history); Park, W & al., 2004 (p.464, tab.1); Mackas & al., 2004 (p.875, Table 2); Miller C.B., 2005 (p.219, Rem.); Hopcroft & al., 2005 (p.198, table 2); Coyle, 2005 (p.77, fig.7,9, tab. 2, 3, 4); Shoden & al., 2005 (p.497, vertical distribution, life cycle); Ware & McQueen, 2006 (p.28, Table B1, weight ranges); Deibel & Daly; 2007 (p.271, Table 4: as bungeii, Rem.: Arctic polynyas); Kobari & al., 2007 (p.2748, interannual variations); Kattner & al., 2007 (p.1628, Table 1); Mackas & al., 2007 (p.223, climatic change index); Humphrey, 2008 (p.83: Appendix A); Morales-Ramirez & Suarez-Morales, 2008 (p.519); Coyle & al., 2008 (p.1775, Table 3, 4, abundance): Wilson S.E. & al., 2008 (p.1636, Rem.: p.1645); Kobari & al., 2008 (p.1648, coppodids I-VI, depth distribution); Takahashi & al., 2008 (p.222, Table 2, grazing impact); Galbraith, 2009 (pers. comm.); Chiba & al., 2009 (p.1846, Table 1, occurrence vs temperature change); Hopcroft & al., 2009 (p.9, Table 3); Tsuda & al., 2009 (p.2767, figs.10, 11, 13, 15, Table 1, vertical distribution, iron fertilization); Lewis & al., 2010 (p.695, Table I); Kobari & al., 2010 (p.1703: feeding); Kobari & al., 2010 (p.1703: feeding); Kobari & al., 2010 (p.1715, figs., Table 2, 3, development, growth); Yamaguchi & al., 2010 (p.1679, figs.3, 10, Table 1: population structure); Yamaguchi & al., 2010 (p.1691, figs.2, 3, 9, Table 2, vertical distribution); Kosobokova & Hopcroft, 2010 (p.96, Table 1); Homma & Yamaguchi, 2010 (p.965, Table 2); Wilson S.E. & al., 2010 (p.1278, Table 3, fatty acids); Goetze & Ohman, 2010 (p.2110, Table 1, biogeography); Hopcroft & al., 2010 (p.27, Table 1, 2, fig.9); Matsuno & al., 2011 (p.1349, Table 1, fig.5, abundance vs years); Kosobokova & al., 2011 (p.29, Table 2, Rem.: Arctic Basins); Batten & Walne, 2011 (p.1643, Table I, abundance vs temperature interannual variability); Saito & al., 2011 (p.145, fig.6, abundance, size vs. temperature); Yamaguchi & al., 2011 (p.13, seasonal variation, life history); Sato & al., 2011 (p.1230, vertical distribution); Homma & al., 2011 (p.29, Table 2, 3, 4, abundance, feeding pattern: suspension feeders); Matsuno & al., 2012 (Table 2); DiBacco & al., 2012 (p.483, Table S1, ballast water transport); Volkov, 2012 (p.474, Table 6, fig.7, 15, abundance, distribution, interannual variation); Shimode & al., 2012 a (p.1, life history); Irvine & Crawford, 2013 (p.1, Rem.: p.59, anomaly time series); in CalCOFI regional list (MDO, Nov. 2013; M. Ohman, comm. pers.); Kobari & al., 2013 (p.78, Table 2); Ohashi & al., 2013 (p.44, Table 1, 2, 3, 4, Rem., p.46, fig.4); Questel & al., 2013 (p.23, Table 3, interannual abundance & biomass, 2008-2010); Yoshiki & al., 2013 (p.993, interannual variations 2001-2009); Kobari & al., 2013 (p.97, Table I, DNA, RNA, 10, 11, 14, 15, protein contents vs development & depth); Eisner & al., 2013 (p.87, abundance vs water structure); Coyle & al., 2014 (p.97, table 3, 7, 8, 9, 10, 11, 12, 14, 15); Chiba S. & al., 2015 (p.968, Table 1: length vs climate); Smoot & Hopcroft, 2016 (p.1, Rem.: p.5: occurrence); Baumgartner & Tarrant, 2017 (p.387, Table 1, diapause); Record & al., 2018 (p.2238, Table 1: diapause); Hirai & al., 2020 (p.1, Fig. 5: cluster analysis (OTU), spatial distribution). | | | | NZ: | 8 | | |
|
Distribution map of Eucalanus bungii by geographical zones
|
| | | | | | 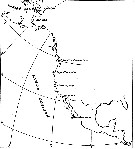 issued from : MW. Johnson inBull. Scripps Instn Oceanogr., techn. Ser., 4 (6). [p.176, Fig.28]. issued from : MW. Johnson inBull. Scripps Instn Oceanogr., techn. Ser., 4 (6). [p.176, Fig.28].
Distribution of Eucalanus in NE Pacific: locality records.
E. bungii bungii : dot; E. bungii californicus: circle; E. elongatus hyalinus: triangle; E. inermis: square. |
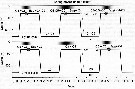 issued from : T. Kobari, K. Tadokoro, H. Sugisaki & H. Itoh in Deep-Sea Res. II, 54. [p.2749, Fig.1]. issued from : T. Kobari, K. Tadokoro, H. Sugisaki & H. Itoh in Deep-Sea Res. II, 54. [p.2749, Fig.1].
Schematic diagram of annual top panel) and biennial (bottom) life cycle of Eucalanus bungii in the Oyashio waters proposed by Shoden & al., 2005 and Tsuda & al., 2004.
Solid line indicates variation of depth during development and dormancy, shaded circles along line show mean spawning seasons, and surface layer shading shows timing and duration of the spring phytoplankton bloom.
Nota : Eucalanus bungii undergoes an ontogenic migration down to the mesopelagic waters. Previous studies (see in Miller & al., 1984 ; Tsuda & al., 2004 ; Shoden & al., 2005) showed that their life histories are associated with seasonally of primary productivity. From autumn to winter, dormant populations reside below 250 m depth at copepodite stages 3-5 and as adult females. Individuals emerging from dormancy migrate upward to the surface and mature in spring. Adults spawn eggs during the period of high primary production. Newly recruited juveniles develop from egg into pre-dormant stages from spring to summer of the birth year, stop development and migrate downward during late summer for overwintering ;
Reflecting geographical differences in the amount, duration, and timing of primary productivity, life spans are biennial in the Alaska Gyre (see in Miller & al., 1984) and annual to biennial in the Oyashio waters (see in Tsuda & al., 2004 ; Shoden & al ., 2005).
various climate indices, such as the Arctic Oscillation (AO : Thompson & Wallace, 1998), North Pacific Index (NPI : Trenberth & Hurrell, 1994), and Pacific Decadal Oscillation (PDO : Mantua & al., 1997), have been suggested as descriptors of forcing factors of the interannual variability of the marine ecosystem (Podovina & al., 1995). Responses to climate events appear species-specific through the life history.
In the Oyashio waters, long-term changes in summer zooplankton biomass show a bi-decadal pattern with high biomass from 1960s to 1970s and low biomass in the 1980s (Odate, 1994). |
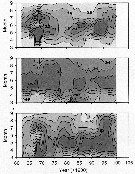 issued from : T. Kobari, K. Tadokoro, H. Sugisaki & H. Itoh in Deep-Sea Res. II, 2007, 54. [p.2752, Fig.4]. issued from : T. Kobari, K. Tadokoro, H. Sugisaki & H. Itoh in Deep-Sea Res. II, 2007, 54. [p.2752, Fig.4].
Yearly fluctuations of monthly abundance (top: x 1000 animals per m2), mean population stage (middle: copepodite stage) and biomass of Eucalanus bungii (bottom mg per m2). Each panel is shown as 5-year running mean.
Nota : The authors conclude from the evaluation response to oceanographic conditions, interannual variations in seasonal abundance of Eucalanus bungii from spatial coverage samples collected from 1960 to 2002 in the Oyashio waters (area bounded by 37-46° N and 141-152° E) :
1- E. bungii was abundant until July or August during the early 1970s and 1990s, but high abundance was restricted to May and June during the late 1970s to early 1980s.
2- Spring-summer abundance of copepodites declined significantly during the late 1970s to early 1980s. Such decadal decline was more pronounced for the late copepodites (C3-C5) than the newly recruited specimens (C1-C2), whereas adults indicated a steady increase.
3- Monthly population structure showed that off-spring stopped development at C3 during the late 1970s to early 1980s but molted into late copepodite stage in the other decades.
4- Seasonal weakening of Aleutian Low Pressure System estimated from the North Pacific Index (NPI) was rapid during the late 1970s to early 1980s and showed a positive correlation with the phosphate concentrations at sea surface, spring-summer abundance of the young copepodites, and the duration of the high abundance.
5- As possible mechanisms for the decadal decline of the copepod abundance, the authors propose reduced low food availability in spring-summer associated with atmospheric and oceanographic conditions results in reduced egg production, lower survival for the cohort at the late birth date, and overwintering at younger stages. |
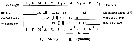
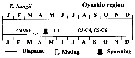 issued from : A. Yamaguchi, K. Ohgi, T. Kobari, G. Padmavati & T. Ikeda in Bull. Fish. Sci. Hokkaido Univ., 2011, 61 (1). [p.18, Fig.5 (part.)] issued from : A. Yamaguchi, K. Ohgi, T. Kobari, G. Padmavati & T. Ikeda in Bull. Fish. Sci. Hokkaido Univ., 2011, 61 (1). [p.18, Fig.5 (part.)]
Schematic diagram showing life cycle timing (mating, spawning, quiescence or diapause) of Eucalanus bungii, one of five dominant copepods in the Oyashio region, western subarctic Pacific (Site H: 41°30'N-42°30'N, 145°00'E-146°00'E).
Compare with Metridia pacifica, Neocalanus cristatus, Neocalanus flemingeri and Neocalanus plumchrus. |
 Issued from : A. Yamaguchi, K. Ohgi, T. Kobari, G. Padmavati & T. Ikeda in Bull. Fish. Sci. Hokkaido Univ., 2011, 61 (1). [p.20, Fig.6 (part.)]. Issued from : A. Yamaguchi, K. Ohgi, T. Kobari, G. Padmavati & T. Ikeda in Bull. Fish. Sci. Hokkaido Univ., 2011, 61 (1). [p.20, Fig.6 (part.)].
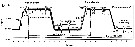
Schematic diagram showing life cycle timing (mating, spawning, quiescence or diapause) of Eucalanus bungii, one of five dominant copepods in the subarctic Pacific (except Oyashio region, western subarctic Pacific (Site H: See Fig.5).
Compare with Metridia pacifica, Neocalanus cristatus, Neocalanus flemingeri and Neocalanus plumchrus.
BC inlet: British Columbia inlet. |
 Issued from : S. Shimode, K. Takahashi, Y. Shimizu, T. Nonomura & A. Tsuda in Progress in Oceanography, 2012, 96. [p.11, Fig.10, b]. Issued from : S. Shimode, K. Takahashi, Y. Shimizu, T. Nonomura & A. Tsuda in Progress in Oceanography, 2012, 96. [p.11, Fig.10, b].
Schematic illustration of the most probable life cycle of Eucalanus bungii (b). Ontogenetic vertical migration during the year in the Oyashio region modified from Tsuda & al. (2004) and Shoden & al. (2005).
C = copepodite stage; F = female adult; M = male adult.
Compare with Eucalanus californicus.
Gray and black lines indicate 1-year or 2-year life cycles. |
 Issued from : R. Ohashi & al. in Deep-Sea Research II, 2013, 94. [p.46]. Issued from : R. Ohashi & al. in Deep-Sea Research II, 2013, 94. [p.46].
Biomass estimation using the equation derived for organisms from the Oyashio region (Imao, 2005). Dry mass in µg, TL: total lengths in µm; one hundred individuals were chosen randomly for measurements during summers of 1994-2009 on the southeastern Bering Sea shelf. |
 Issued from : K. Furuhashi in Publ. Seto Mar. Biol. Lab., 1966, XIV (4). [p.314, Fig.2]. Issued from : K. Furuhashi in Publ. Seto Mar. Biol. Lab., 1966, XIV (4). [p.314, Fig.2].
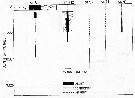
Vertical distribution of Eucalanus bungii bungii at five stations from the Oyashio region St. 1 (off E Hokkaido), transitional zone between Oyashio/Kuroshio regions: St. H12 (40°N, 152°E) and the Kuroshio region St. N1 (34.4°N, 139°E), St. S2 (34°.5N, 141°E) and St. T1 (30°, 142°E).
Sampling by vertical closing net in May 1964. |
 Issued from : K. Furuhashi in Publ. Seto Mar. Biol. Lab., 1966, XIV (4). [p.319, Fig.7]. Issued from : K. Furuhashi in Publ. Seto Mar. Biol. Lab., 1966, XIV (4). [p.319, Fig.7].
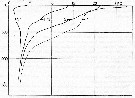
Vertical distribution of the water temperature at four stations from Oyashio region (SE Hokkaido) to Kuroshio region (E and SE off middle Japan). |
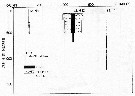 Issued from : K. Furuhashi in Publ. Seto Mar. Biol. Lab., 1966, XIV (4). [p.318, Fig.6]. Issued from : K. Furuhashi in Publ. Seto Mar. Biol. Lab., 1966, XIV (4). [p.318, Fig.6].
Schema showing relatively the vertical distribution of Eucalanus bungii bungii Johnson at three stations. The respective stations are arranged in this figure in the order of the distance from the supposed station where factors are most representative of the Oyashio. |
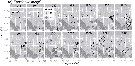 Issued from : E.A. Ershova, E.R. Hopcroft, K.N. Kosobokova, K. Matsuno, R.J. Nelson, A. Yamaguchi & L.B. Eisner in Oceanography, 2015, 18 (3). [p.110, Fig.7]. Issued from : E.A. Ershova, E.R. Hopcroft, K.N. Kosobokova, K. Matsuno, R.J. Nelson, A. Yamaguchi & L.B. Eisner in Oceanography, 2015, 18 (3). [p.110, Fig.7].
Abundance (ind. per m3) of Eucalanus bungii (a) in the Chukchi Sea .
Color circle spot: stations where taxon was present during 1946-2012 (< 1 ind.per m3); x: stations where taxon was not found. |
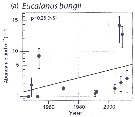 Issued from : E.A. Ershova, E.R. Hopcroft, K.N. Kosobokova, K. Matsuno, R.J. Nelson, A. Yamaguchi & L.B. Eisner in Oceanography, 2015, 18 (3). [p.112, Fig.10]. Issued from : E.A. Ershova, E.R. Hopcroft, K.N. Kosobokova, K. Matsuno, R.J. Nelson, A. Yamaguchi & L.B. Eisner in Oceanography, 2015, 18 (3). [p.112, Fig.10].
Mean abundances of Eucalanus bungii (a) in the Chukchi Sea north of 70°N and east of 175°W.
Bars indicate 95% confidence interval.
Solid line indicates fitted trend. |
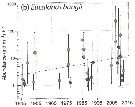 Issued from : E.A. Ershova, E.R. Hopcroft, K.N. Kosobokova, K. Matsuno, R.J. Nelson, A. Yamaguchi & L.B. Eisner in Oceanography, 2015, 18 (3). [p.109, Fig.6]. Issued from : E.A. Ershova, E.R. Hopcroft, K.N. Kosobokova, K. Matsuno, R.J. Nelson, A. Yamaguchi & L.B. Eisner in Oceanography, 2015, 18 (3). [p.109, Fig.6].
Interannual variability of Pacific copepod Eucalanus bungii (b) abundance in the Chukchi Sea during 1946-2012.
Each symbol represents one cruise; bars indicate 95% confidence interval. Dashed line shows fitted trend over averaged data.
Blue circle: June; green circle: July: yellow circle; August; purple circle: September. |
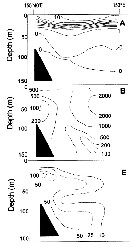 Issued from : A.I. Pinvhuk & A.J. Paul in Univ. Alaska Sea Grant College Progr., 2000. [p.7, Fig.5]. Issued from : A.I. Pinvhuk & A.J. Paul in Univ. Alaska Sea Grant College Progr., 2000. [p.7, Fig.5].
A = vertical distribution of water temperature. B = total zooplankton biomass (mg.m3). E = Eucalanus bungii biomass (mg.m3) on the profile along 54°19'N in summer 1965; mesh = 0.168. (from Kotlyar & Chernyavskiy, 1970b). |
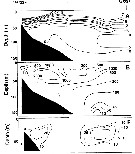 Issued from : A.I. Pinvhuk & A.J. Paul in Univ. Alaska Sea Grant College Progr., 2000. [p.7, Fig.6]. Issued from : A.I. Pinvhuk & A.J. Paul in Univ. Alaska Sea Grant College Progr., 2000. [p.7, Fig.6].
A = vertical distribution of water temperature. B = total zooplankton biomass (mg.m3). F = Eucalanus bungii biomass (mg.m3) on the profile along 57°16'N in summer 1965; mesh = 0.168. (from Kotlyar & Chernyavskiy, 1970b). |
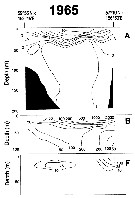 Issued from : A.I. Pinvhuk & A.J. Paul in Univ. Alaska Sea Grant College Progr., 2000. [p.12, Fig.10]. Issued from : A.I. Pinvhuk & A.J. Paul in Univ. Alaska Sea Grant College Progr., 2000. [p.12, Fig.10].
A = vertical distribution of water temperature. B = total zooplankton biomass (mg.m3). F= Eucalanus bungii biomass (mg.m3) between Cape Evreinov and Cape Hayryuzov in summer 1965; mesh = 0.168. (from Kotlyar & Chernyavskiy, 1970b) |
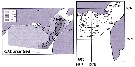 Issued from : A.I. Pinvhuk & A.J. Paul in Univ. Alaska Sea Grant College Progr., 2000. [p.22, Figs.26, 27]. Issued from : A.I. Pinvhuk & A.J. Paul in Univ. Alaska Sea Grant College Progr., 2000. [p.22, Figs.26, 27].
Left chart: Distribution of Eucalanus bungii biomass (mg.m3) in the 0-100 m layer in the northern Okhotsk Sea during August,1964. (from Kotlyar, 1965);
Right chart: Distributio,n of zooplankton biomass (mg.m3) in the 0-100 m in the northern Okhotsk Sea during August 1964. (from Kotlyar, 1970 |
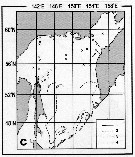 Issued from : A.I. Pinvhuk & A.J. Paul in Univ. Alaska Sea Grant College Progr., 2000. [p.30, Fig.35C]. Issued from : A.I. Pinvhuk & A.J. Paul in Univ. Alaska Sea Grant College Progr., 2000. [p.30, Fig.35C].
Distribution of Eucalanus bungii biomass (mg.m3) in the 0-100 m layer in the Okhotsk Sea.
1: September-October 1652; 2: June-July 1951; 3: June-July 1650; 4: August-September 1949. (from Lubny-Gertsik, 1959). |
| | | | Loc: | | | China Seas (East China Sea), Korea Strait, Japan Sea, Japan (off Hokkaido SE, Funka Bay, Oyashio region, Station 'H' (41°30'N, 145°560'E), Kuroshio extension), off SE Kuril Is., E Kamchatka, Station K2 (47°N, 160°E), Station Knot, Okhotsk Sea, Chukchi Sea, Beaufort Sea, off NW Alaska, Aleutian Is., Bering Sea, off Unimak Is., Arct.: polar Basin, Canada Basin (rare), Chukchi Sea, Bering Sea, S Aleutian Basin, S Aleutian Is., St. Lawrence Island, Anadyr Strait, Station "P", Aleutian Basin, G. of Alaska, Icy Strait, Cobb Seamount, British Columbia, Hecate Strait, Vancouver Is., Puget Sound, Oregon (Yaquina, off Newport), Pacif. (central N), off NE Hawaii, W BaJa California, W Costa Rica, N & S Chile | | | | N: | 112 | | | | Lg.: | | | (22) F: 8-6,5; M: 5,4-4,8; (72) F: 6,08-5,51; (91) F: 6; (125) F: 6,3; (131) F: 6,5-8; M: 4,8-5,4; (208) F: 7,2-6; M: 6,2; (1041) F: 5,74; {F: 5,51-8,00; M: 4,80-6,20}
Prosome: (1041) F: 5,2.
Chiba S. & al., 2015 (p.971, Table 1: Total length female (June-July) = 7.3 mm [optimal SST (°C) = 6.3]. | | | | Rem.: | epi-bathypelagic. The southern limit seems near the 45° latitude.
See remaks Eucalanus elongatus from Vervoort (1963 b, p.88-89).
According to Park (1968, p.540) this form seems in favor of Johnson's treatment of elevating this variety to specific level in the absence of any intermediate forms (contrary to the opinion of Vervoort, 1946).
For Kosobokova & al. (2011, Table 3) Eucalanus bungii bungii is an expatriate species from Pacific to the Arctic Ocean Basins, because the reproduction is not assumed in polar waters.
For Heinrich (1962, p.465) the species is a common herbivorous copepod in the western region of the Bering Sea.
After Kobari & al. (2007, p.2748) E. bungii preys on micro- to nanophytoplankton, microzooplankton, and sinking particles.
After Ohysuka & Nishida (2017, p.577à this species exhibit biennial life cycles in the Oyashio region. | | | Last update : 28/10/2020 | |
|
|
 Any use of this site for a publication will be mentioned with the following reference : Any use of this site for a publication will be mentioned with the following reference :
Razouls C., Desreumaux N., Kouwenberg J. and de Bovée F., 2005-2025. - Biodiversity of Marine Planktonic Copepods (morphology, geographical distribution and biological data). Sorbonne University, CNRS. Available at http://copepodes.obs-banyuls.fr/en [Accessed December 02, 2025] © copyright 2005-2025 Sorbonne University, CNRS
|
|
|
|




;)
;)
;)
;)
;)
;)
;)
;)
;)
;)
;)
;)

;)
;)
;)
;)
;)
;)
;)
;)
;)
;)
;)
;)
;)
;)
;)
;)
;)
;)