|
|
 |
Fiche d'espèce de Copépode |
|
|
Calanoida ( Ordre ) |
|
|
|
Diaptomoidea ( Superfamille ) |
|
|
|
Temoridae ( Famille ) |
|
|
|
Temora ( Genre ) |
|
|
| |
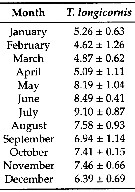
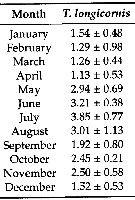
Temora longicornis (Müller, 1792) (F,M) | |
| | | | | | | Syn.: | Cyclops longicornis Müller,1785 (p.115);
Halitemora longicornis : Giesbrecht, 1881 (p.257);
no T. longicornis : T. Scott, 1894 b (p.76, fig.M); Marukawa, 1921; ? C.B. Wilson, 1950 (part., p.342); ? Rose, 1956 (p.461) | | | | Ref.: | | | Brady, 1878 (p.54, figs.F,M); Bourne, 1889 (p.148); Giesbrecht, 1892 (p.329, 338, figs.F,M); Giesbrecht & Schmeil, 1898 (p.101); Wheeler, 1901 (p.175, figs.F,M, Rem.); Sars, 1902 (1903) (p.97, figs.F,M); Thompson & Scott, 1903 (p.234, 248); Farran, 1908 b (p.59); Lysholm, 1913 (p.6); Adler & Jespersen, 1920 (p.13); Pesta, 1920 (p.525); Sars, 1925 (p.192); Rose, 1929 (p.27); Wilson, 1932 a (p.105, figs.F,M); Rose, 1933 a (p.170, figs.F,M); Jespersen, 1934 (p.92); 1940 (p.41); Wiborg, 1954 (p.149); Marques, 1951 a (p.22); 1953 (p.105, figs.F,M); ? 1955 (p.18); ? 1959 (p.213); 1966 (p.4); Faber, 1966 (p.191, figs.N); Corkett, 1967 a (p.58, , development); Vilela, 1968 (p.22, figs.F,M); Corkett, 1968 (p.51, Rem. juv., F,M); Fleminger, 1975 (p.397); Klein Breteler, 1982 (p.4, 5, figs.); Schnack, 1982 (p.89, figs.Mx2, Md, Mxp); van der Spoel & Heyman, 1983 (p.107); Sévigny & Odense, 1985 (p.455, enzymatic system); Sazhina, 1985 (p.50, figs.N); Gill, 1986 (p.449, figs.F, Rem.: mechano & chemo-receptors); Pessotti & al., 1986 (p.409, Rem.: tailles); Bannister, 1993 (p.97, sub-cuticular glands); Karlson & Bamstedt, 1994 (p.79, fig.2: Md); Boxshall & Huys, 1998 (p.784, aesthetascs); Bradford-Grieve & al., 1999 (p.884, 954, figs.F,M); Braga & al., 1999 (p.79, tab.1, Biomol.); Ferrari & Markhaseva, 2000 (p.84, fig.); G. Harding, 2004 (p.14, figs.F,M); Boxshall & Halsey, 2004 (p.206: figs.F,M); Ferrari & Ueda, 2005 (p.341, figs. juv,F,M); Conway, 2006 (p.16, 25, copepodides 1-6, Rem.); Ferrari & Dahms, 2007 (p.87, 92, Rem., fig.29: P1, Table XXII); Avancini & al., 2006 (p.90, Pl. 59, figs.F,M, Rem.); Vives & Shmeleva, 2007 (p.522, figs.F,M, Rem.); Laakmann & al., 2013 (p.862, figs.1, 2, 3, 4, 5, Table 1, 2, 3, mol. Biol.); Kos, 2016 (p.45, F, M, Rem.) | 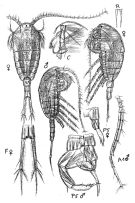 issued from : G.O. Sars G.O. in An Account of the Crustacea of Norway, with short descriptions and figures of all species. Vol. IV. Copepoda Calanoida. Publ. by The Bergen Museum. 1903. [Pl. LXV]. Female & Male
|
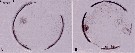
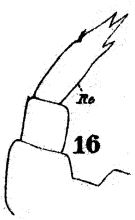 issued from : W. Giesbrecht in Fauna Flora Golf. Neapel, 1892, 19. [Taf.17, fig.16]. Female: 16, P5.
|
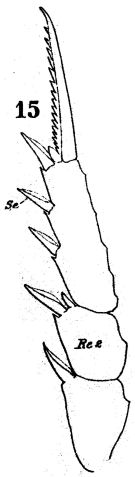 issued from : W. Giesbrecht in Fauna Flora Golf. Neapel, 1892, 19. [Taf.17, fig.15]. Male: exopodite of P2 (posterior view).
|
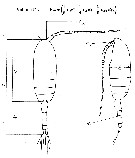
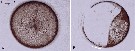
 issued from : G.O. Sars in An Account of the Crustacea of Norway, with short descriptions and figures of all species. Vol. IV. Copepoda Calanoida. Publ. by The Bergen Museum. 1903. [Pl. LXVI.]. Female.
|
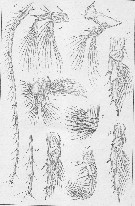
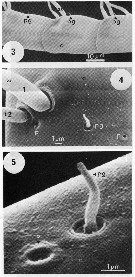 issued from : C.W. Gill in Mar. Biol., 1986, 93. [p.451, Fig.1, (3-5)]. Scanning transmission electon photomicroscopy. from female (Roscoff, France): 3, setae on preaxial edge of A1, showing various positions of pegs (pg); 4, typical arrangment of Type 1 (t1) and Type 2 (t2) setae, peg (pg), and pores (p); 5, detail of peg and pore. Nota : The A1 musculature is organised into five discrete bundles around the periphery of the A1 close to the cuticle. Muscle bundles run in the sub-, post-, and supra-axial regions of the A1, so their contraction causes the A1 to be flicked backwards. A pre-axial set is innervated by a pair of neurons which are associated with mitochondria. Nervous processes are present in the post-axial part of the A1. Setae, pegs and pores are present on the A1. The external morphology differs with regard to size, and their ultrastructure shows that they may be of two distinct types ; Type 1 seta supra-axial (t1) and Type 2 seta sub-axial (t2) . One of each type probably occurs in the pair of setae at each segment junction. The histology and behavioural experiments concerning A1 (see Gill , 1985 ; Gill & Crisp, 1985), demonstrate that the Type 1 setae have the fine structure of a mechanoreceptor, and are used to detect distant water disturbances. The type 2 setae may be chemosensory (as aesthetes have been identified on the A1 of other species of copepods [see laverack, 1968 ; Griffiths and Frost, 1976 ; Gill, 1983 ; Fleminger, 1985]. The antennulary pegs do not appear to be innervated. Amputating the A1 of individuals prevented it from detecting distant water disturbances, but not those nearby (Gill & Crisp, 1985), so mechanoreceptors must be present on other areas of the body.
|
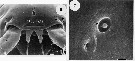 issued from : C.W. Gill in Mar. Biol., 1986, 93. [p.452, Fig.2, (6-7)]. SEM photography Female: 6, position of several sensillae on anterior of cephalosome; a = antennule; f = frontal horn (rostrum); sf = supra-frontal sensillae; pl = large pore; cs = coeloconica sensilla; 7, detail of coeloconica (cs) and pore (p). Nota : On dorsal forehead two supra-frontal sensillae (frontal organ) (see Elofsson, 1971) occur near a large central pore, on either side of the sensillae is a coeloconica sensilla and a small pore which may be chemoreceptors receiving external stimuli (see Fleminger, 1973). There are other small pegs and large pores of < 0.0045 mm diameter in this area ; The frontal horns (rostrum) are probably sensory and their cuticle is perforated by many pores in Calanus finmarchicus (Elofsson, 1971), but not in adult Temora longicornis. Of the other integumental structures present on the cephalosome, large pores are most common.
|
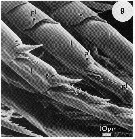
 issued from : C.W. Gill in Mar. Biol., 1986, 93. [p.452, Fig.1, (8)]. SEM photography Female: 8, patches of epicuticular spines (se), a seta (s), peg (pg), large pore (pl), and pore (p) on dorsal surface of metasome. Nota : Structures resembling sensillae are most common on the dorsal surface of the metasome, which is often partly covered by epicuticular spines, occuring in patches and pointing in a posterior direction ; Setae, pegs and large pores are distributed on the integument in patterns that form signatures characteristic of species (see Fleminger, 1973).
|
 issued from : C.W. Gill in Mar. Biol., 1986, 93. [p.452, Fig.1, (9)]. SEM photograpy Female:9, position of large pores (pl) on thoracic legs. Nota : large pores are found on the outside edge of the thoracic legs, usually distal to each segment, and adjacent to a large spine.
|
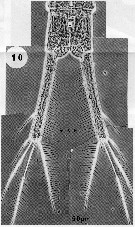 issued from : C.W. Gill in Mar. Biol., 1986, 93. [p.452, Fig.1, (10)]. Light microscope Female: 10, last segment of urosome (u) and caudal rami. s = setae. Nota : The caudal rami have apical setae, with a single row of narrow setae on the inner edge of each caudal ramus. Nota : The fine setae on the caudal rami and metasome may be mechanosensory. The specimens are very sensitive to water jets directed at the urosome and caudal rami. It is possible that the fine setae on the caudal rami respond to small rapid movements of water in a similar way to the setae on the anal cerci of cockroaches and crikets. These insect setae warn against sudden attack from behind by detecting rapid air currents, causing the insect to escape (Cambi, 1890).
|
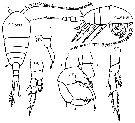 issued from : G. Harding in Key to the adullt pelagic calanoid copepods found over the continental shelf of the Canadian Atlantic coast. Bedford Inst. Oceanogr., Dartmouth, Nova Scotia, 2004. [p.14]. Female & Male. L = left leg; R = right leg.
|
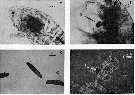
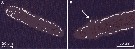
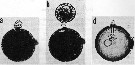 issued from : G. Drebes in Helgoländer Meeresunters., 1984, 37. [p.610, Fig.3 a, b, d]. a: Dinospore of Dissodinium pseudolovenula (Dinophytes Blastodiniales) attached to an egg of Temora longicornis. b: trophont sucking out copepod egg. d: peduncule of parasite left behind inside empty Temora egg.
|
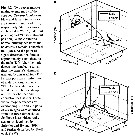
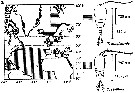
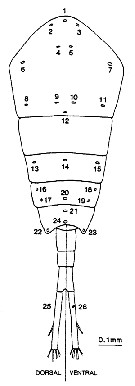 Issued from : N.J. Bannister in J. mar. biol. Ass. U.K., 73. [p.99, Fig.2]. Diagrammatic representation of the distribution of secretory gland pores on the body of Temora longicornis. Each pore has been numbered for reference, and dorsal and ventral views of the abdomen are represented separately.
|
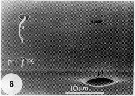
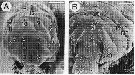 Issued from : N.J. Bannister in J. mar. biol. Ass. U.K., 73. [p.100, Fig.3]. SEMs of Temora longicornis from Menai Bridge pier (Wales). A: anterior view of head illustrating the position of pores 1-12.; B: Thoracic segments 3-4illustrating position of pores 18-24. Scale bars: 150µm (A); 50 wmm (B).
|
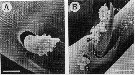 Issued from : N.J. Bannister in J. mar. biol. Ass. U.K., 73. [p.100, Fig.3]. SEM of Temora longicornis from Menai Bridge pier (Wales). A: a pore on the second swimming leg, with vesicular material at its opening; B: pore (p) on the third swimming leg adjacent to a spine (sp) with granular material (g) around the pore opening and along the spine. Scale bars: 4 µm (A); 10 µm (B). Nota: The large secretion granules in the secretory cells stained suggest the presence of protein. The observations lend support to the view that non-luminous secretion may act as an antifouling agent. It was noticed that the cuticle of these animals was remarkably free of any fouling organism, especially bacteria.
|
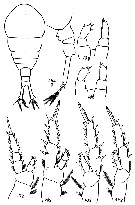 Issued from : M.S. Kos in Zoological Institut RAS; 2016, 179. [p.46, Fig. 20]. Temora longicornis female from the White Sea.
|
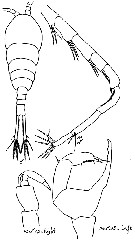 Issued from : M.S. Kos in Zoological Institut RAS; 2016, 179. [p.47, Fig. 21]. Temora longicornis male from the White Sea.
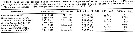
| | | | | Ref. compl.: | | | Pearson (1906, p.22, Rem.); Sars, 1909 b (p.17); Rose, 1924 d (p.479, Rem.); 1925 (p.152); Wilson, 1932 (p.32); W.H. Johnson, 1933 (p.1, vertical distribution vs. light); Jespersen, 1939, p.60, Rem.); Wilson, ? 1942 a (p.209); Sewell, 1948 (p.347, 367, 508, 555, 566, 569); C.B. Wilson, 1950 (part., p.342); Fleury, 1950 (p.47, fig.2); Gauld & Raymont, 1953, p.447, Table III, IV, fig.1, respiration); Gundersen, 1953 (p.1, 22, Table 18, seasonal abundance); Østvedt, 1955 (p.15: Table 3, p.71); Deevey, 1956 (p.127, 131, tab. IV); Gauld, 1957 (p.510, copulation); Conover, 1959 (p.259, Table 1, 2, respiration); Cushing, 1959 (p.455, Rem.: p.459); Deevey, 1960 (p.5, Table II, annual abundance, Rem.: p.32, fig.18, 19); H. Schulz, 1961 (p.57); Wickstead, 1962 (p.546, food & feeding); Fagetti, 1962 (p.17); Marshall & Orr, 1962 (tab.1, 3); Grice & Hart, 1962 (p.287, table 4: abundance, p.295: Rem.); Berner, 1962 (p.625, feeding vs. respiration); Gaudy, 1962 (p.93, 99, Rem.: p.108); Lacroix & Bergeron, 1963 (p.59, Tableau III, IV); Bary, 1963 a (p.1519, Table 1); Lance, 1965 (p.155, Table 2: osmotic pressure); Bodo & al., 1965 (p.219, annual cycle); Martin, 1965 (p.188); Mazza, 1966 (p.71); 1967 (p.324, 329, fig.65); Marshall & Orr, 1966 (p.513, 521, fig. I, 2, Table 1, 2, 3, 4, 6, 7, feeding, respiration); Faber, 1966 a (p.419, 420); Matthews, 1967 (p.159, Table 1, Rem.); Pertsova, 1967 (p.240); Maclellan D.C., 1967 (p.101, 102: occurrence); Corner & Cowey, 1968 (p.393, Table 8, assimilation); Harder, 1968 (p156, Table 1, 6, fig.6, behaviour vs. density discontinuity); Séguin, 1968 (p.488); Vinogradov, 1968 (1970) (p.111); Singarajah, 1969 (p.171, Table II, behaviour); Corkett & McLaren, 1970 (p.161, development rate egg-CI); Itoh, 1970 a (p.8: tab.2); Shih & al., 1971 (p.48, 208); Carli, 1971 (p.372, tab.1); Conover, 1971 (p.1327, oil polluant effect); Arndt & Heidecke, 1973 (p.599, 603, fig.3); Grice & al., 1973 (p.45, Table 2, mortality vs pH); Eriksson, 1973 (p.37, fig.18-21, annual cycle); 1973 b (p.113, 118); Soenen, 1974 (p.120); Conover & Mayzaud, 1975 (p.151, fig.5, abundance); Person-Le Ruyet, 1975 (p.203, rearing); Vives & al., 1975 (p.44, tab.II, III, IV); Landry, 1975 a (p.434, Rem.: p.437, fig.3); Le Ruyet-Person & al., 1975 (p.283, comparative biology, metabolism activity); Corkett & Zillioux, 1975 (p.13, temperature vs egg laying); Harris & Paffenhöfer, 1976 (p.675, feeding; growth, egg production); 1976 a (p.875, food concentration); Hecq, 1976 (p.443, abundance annual cycle); Mackas & Bohrer, 1976 (p.77, fig.2, gut contents); Sameoto, 1977 (p.1, fig.13, abundance); Conover, 1978 (p.66, 69, feeding); Poulet, 1978 (p.1126, grazing); Mayzaud & Poulet, 1978 (p.1144, feeding); Colebrook, 1978 (tab.1); McLaren, 1978 (p.1330, 1337: life history); Hernroth, 1978 (p.1, Rem.: p.5); Comaschi Scaramuzza, 1978 (p.17); Knatz, 1978 (p.68, Table 1, abundance, %); Spooner & Corkett, 1979 (p.197, feeding rates vs oil effects); Lefèvre-Lehoërff & Quintin, 1979 (p.71, length-temperature); Hure & al., 1980 (p.298, 304); Pipe & Coombs, 1980 (p.223, vertical occurrence); Smith & Hall, 1980 (p.277, grazing); O'Connors & al., 1980 (p.65, grazing rates); Poulet & Marsot, 1980 (p.198, Fig.2, feeding); Samain & al., 1980 (p;225, polluant effects); Gallo, 1981 (p.847); Evans F, 1981 (p.145, temperature-food supply-size); Kovalev & Shmeleva, 1982 (p.84); Citarella, 1982 (p.791, 798: listing, frequency, Tableau II, V); Klein Breteler & Gonzalez, 1982 (p.157, body length/food); Klein Breteler & al., 1982 (p.195, growth & development); Vives, 1982 (p.293); Castel & Courties, 1982 (p.417, Table II, fig.4, spatial & monthly distribution); Boucher, 1982 a (p.199, fig.2); Turner & Dagg, 1983 (p.16, 22); Yule & Crisp, 1983 (p.271, feeding behaviour); Jacoby & Youngbluth, 1983 (p.84, Table 4, Rem: mating); Chojnacki & Hussein, 1983 (p.53, Table 2, length-weight); Baars & Fransz, 1984 (p.120, Table 1, grazing); Baars & Oosterhuis, 1984 (p.97, diurnal feeding rhythms); Tremblay & Anderson, 1984 (p.7); Fransz & al., 1984 (p.86); Drebes, 1984 (p.603, 609: parasitic dinophytes); Lefèvre-Lehoërff & al., 1984 (p.131, annual variations); Sameoto, 1984 (p.767, vertical migration); Head & al., 1984 (p.543, feeding rhythms/enzyme activity); Brylinski, 1984 a (p.91, length/temperature); d'Elbée, 1984 (p.25, Fig.6); Williams & Collins, 1985 (p.28); Regner, 1985 (p.11, Rem.: p.34); Oosterhuis & Baars, 1985 (p.89, digestive enzymes); Peterson, 1985 (p.726, fig.2, abundance, egg production);Hargrave & al., 1985 (p.221, annual abundance); Brenning, 1985 (p.5, spatial distribution/TS); 1985 a (p.28, Table 2, fig.9); Gill, 1985 (p.121, tactile stimulation); Gill & Crisp, 1985 (p.185, limb movements vs. temperature); Brylinski, 1986 (p.457, spatial variations); Pessoti & al., 1986 (p.409, body lengths); Légier-Visser & al., 1986 (p.529, mechanoreception); Wang & Conover, 1986 (p.867, feeding); Lindley, 1986 (p.399, Table II, dormant eggs); Dam, 1986 (p.149, feeding); Klein Breteler & Gonzalez, 1986 (p.71, culture, development times); Chojnacki, 1986 (p.534, fig. 1, 2, length-weight); Harding & al., 1986 (p.952, Table 1, 2, 3, fig.4, diel vertical movements); Mikhailovsky, 1986 (p.83, Table 1, ecological modelling); Comaschi Scaramuzza, 1987 (tab.1); Vuorinen & Ranta, 1987 (tab.2, 4); Gill & Harris, 1987 (p.785, feeding behaviour); Peterson W.T. & Bellantoni, 1987 (p.411, Table I, figs.6, 7, egg production vs. total chlorophyll concentration); Bakker & Van Rijswijk, 1987 (p.125); Morales, 1987 (p.107, fecal pellets); Brylinski & Lagadeuc, 1988 (p.183, tide coeff. effect); Aksnes & Magnesen, 1988 (p.57, population dynamic, production); Hay & al., 1988 (p.431, enclosed population dynamic); Tiselius, 1988 (p.215, grazing); Daan & al., 1988 (p.45, carnivorous behaviour); Poulet & Gill, 1988 (p.259, feeding behaviour); Roy & al., 1989 (p.145, feeding); Citarella, 1989 (p.123, abundance); Bakker & Van Rijswijk, 1989 (p.179); Van Rijswijk & al., 1989 (p.293, fecundity); Fransz & al., 1989 (p.83, egg production, generation times); Giguère & al., 1989 (p.522, 523); Tiselius & Jonsson, 1990 (p.23, table 1-4, feeding behaviour); Lindley, 1990 (p.209, tab.4, eggs/sediment); Tacks & al., 1990 (p.405, grazing); Klein Breteler & al., 1990 (p.177, food vs length); Fransz & al., 1991 (p.9 & suiv.); Dam & Peterson, 1991 (p.113, feeding , seasonal changes); W.T. Peterson & al., 1991 (p.131, egg production, growth rates, secondary production); Naas & al., 1991 (p.161, natural production in mesocosm ecosystem); Hay & al., 1991 (p.1453, Table 2, 5); Fransz & al., 1992 (p.23, long-term change/eutrophisation); Lee B.-G & Fisher, 1992 (p.117, fecal pellets); Bautista & Harris, 1992 (p.41, ingestion rate, gut contents); Yen & Fields, 1992 (p.123, predator vs.Acartia hudsonica nauplii); Huntley & Lopez, 1992 (p.201, Table 1, A1, eggs, egg-adult weight, temperature-dependent production); Norrbin, 1992 5p; 6+); Viitasalo, 1992 (tab.2); Hansen F.C. & al., 1993 (p.51, feeding); Malej & Harris, 1993 (p.33, grazing inhibitor); Vinogradov & al., 1994 (tab.1); Klein Breteler & al. 1994 (p.1039, Table I, fig. 3, 6, 7, duration life stages); Peterson & Kimmerer, 1994 (p.1594, population dynamic, egg production & mortality, cohort survival rates); Hays & al., 1994 (tab.1); Munk & Nielsen, 1994 (p.1225, fig.4, Table III: egg production, predation); Sautour, 1994 (p.113, grazing); de Angelis & Lee, 1994 (p.1298, methane production); Lefèvre-Lehoërff & al., 1995 (p.269, annual hydroclimatic variations); Krause & al., 1995 (p.81, Fig.34, 35, abundance, Rem.: p.140); Madhupratap & al., 1996 (p.77, Table 2: resting eggs); Marcus, 1996 (p.144); Hays & al., 1996 (p.159, Rem.: Herring correlation); Ban S, Burns C. & al., 1997 (p.287, Table 1, 2, feeding, reproduction); Falkenhaug & al., 1997 (p.449, spatio-temporal pattern); Hure & Krsinic, 1998 (p.57, 101); Heyen & al., 1998 (p.179, interannual variability); Mauchline, 1998 (tab.16, 17, 21, 25, 26, 33, 40, 45, 47, 48, 51, 53, 54, 58, 61, 62, 63, 64, 65); Reid & Hunt, 1998 (p.310, figs.2, 3, Rem.); Doall & al., 1998 (p.681, mate location); Tang & al., 1998 (p.1971); Vigoni & al., 1998 (tab.2); Yen & al., 1998 (p.787, mate-tracking); Weissburg & al., 1998 (p.701, mate-tracking); Viitasalo & al., 1998 (p.129, behaviour vs. predator): Sameoto & al., 1998 (p.1, 7, fig. 11, spatial distribution ); Titelmann & Tiselius, 1998 (343, table 1, 2, 3); Doall & al., 1998 (p.681, mate behavior); Halvorsen & Tande, 1999 (p.279, tab.2, 3, Rem.: p.282); Harvey & al., 1999 (p.1, 49: Appendix 5, in ballast water vessel); Klein Breteler & al., 1999 (p.191, feeding vs protozoans, fatty acids, development); White & McLaren, 2000 (p.751, tab.1); Pepin & Maillet, 2000 (p.1, Rem.: p.7, 9, table 2, fig.19, interannual variations); Musaeva & Gagarin, 2000 (p.534, tab.1); Sautour & al., 2000 (p.531, Table II, abundance); Dippner 1 al., 2000 (p.23, fig.6, long-term variability vs. climate); Beare & al., 2000 (p.1545, Coastal index indicator); Halsband & Hirche, 2001 (p.219, annual reproduction cycle); d'Elbée, 2001 (tabl.1); Musaeva & Suntsov, 2001 (p.511); Holmes, 2001 (p.28); Fransz & Gonzalez, 2001 (p.255, tab.1); Schmitt & Seuront, 2001 (p.375, behavior); Cotonnec & al., 2001 (p.693, Table III, IV, food selectivity); Sameoto & al., 2002 (p.13); Bressan & Moro, 2002 (tab.2); Beaugrand & al., 2002 (p.179, figs.5, 6); Mouny & Dauvin, 2002 (p.13, fig.3, 5, 6, Table 4); Titelman & Kiørboe, 2003 a (p.137, nauplius behaviour); Evjemo & al., 2003 (p.191, Table I, fig.1, lipids & fatty acids); Rawlinson & al., 2005 (p.205, tidal exchange); Cordell & al., 2007 (p.218, fig.7); David & al., 2007 (p.377); 2007a (p.429, figs.2, 4, 5, Table 2, 3, 4, 5, 6); Peters & Hagen, 2003 (p.197); Bode & al., 2003 (p.85, Table 1, abundance); Vukanic, 2003 (139, tab.1); Vieira & al., 2003 (p.S163, Table 2, abundance); Seuront & al., 2004 (p.498); Halsband-Lenk & al., 2004 (p.709, figs.6,7); Gislason & Astthorsson, 2004 (p.472, tab.1, fig.4); CPR, 2004 (p.62, fig.188); Vukanic & Vukanic, 2004 (p.9, tab. 3); Vallet & Dauvin, 2004 (p.539, tab.2); Devreker & al., 2005 (p.270, reproduction); Uriarte & Villate, 2005 (p.863, tab.I); Arendt & al., 2005 (p.513, egg production); Queiroga & al., 2005 (p.195, table 1); Manning & Bucklin, 2005 (p.233, Table 1, fig.5); Isari & al., 2006 (p.241, tab.II); Marques & al., 2006 (p.297, tab.III); Hansen F.C. & al., 2006 (p.39, production); Mageed, 2006 (p.171, Table 4); Jansen & al., 2006 (p.102, nutrition); De Olazabal & al., 2006 (p.966); Varela & al., 2006 (p.272, Table 3, oil spill effects); Knotz & al., 2006 (p.406, enzymology); Steinke & al., 2006 (p.1925, behavior bvs Dimethyl sulfide); Durbin & Casas, 2006 (p.2537, Table 2a, 2b, Fig.9); Hop & al., 2006 (p.182, Table 4); Albaina & Irigoien, 2007 (p.435: Tab.1); Wesche & al., 2007 (p.1309); Woodson & al., 2007 (p.163, Rem: behavior); S.C. Marques & al., 2007 (p.213, Table 1, fig.6); Marques S.C. & al., 2007 (p.725, Table 1, fig.4, climate variability); Chojnacki & al., 2007 (p.40, Table 2); Valdés & al., 2007 (p.104: tab.1); Busatto, 2007 (p.26, Tab.2); Schulz J. & al., 2007 (p.47, vertical zonation analysis); Titelman & al., 2007 (p.1023, Table I, mate behaviour); Cabal & al., 2008 (289, Table 1); Goetze & Kiørboe, 2008 (p.185, mating recognition); Koski & al., 2008 (p.719, feeding); Kreibich & al., 2008 (p.241, feeding, egg production); Kiørboe, 2008 (p.155, Table 2, swimming speed); Evjemo & al., 2008 (p.31, Rem.: egg production); Pepin & al., 2008 (p.1, 9, figs. 21, 25, 33, interannual variations); Yen & al., 2008 (p.283, Rem.: kinematic); Jansen S., 2008 (p.251, grazing); Dutz & al., 2008 (p.225, figg 1, 2, 3,4, 5, table 1, egg production, filtration rate, pellets, hatching vs diatom contents); Alheit & Bakun, 2009 (p., interannual variations); Brylinski, 2009 (p.253, Tab.1); Holste & al., 2009 (p.527, egg production); Kozlowsky-Suzuki & al., 2009 (p.395, Table 2, nutrition, oocyte development); Telesh & al., 2009 (p.16, fig.2.1, p.18: Table 2.1); DFO, 2009 (p.1, fig. 13, seasonal variability); Magalhaes & al., 2009 (p.187, Table 1, %); Zervoudaki & al., 2009 (p.1475, fig.2); Assmus & al., 2009 (p.1895, Table 1, 4, 5, figs.2, 3, 4, 6, 8, 9, 10); Dvoretsky & Dvoretsky, 2009 a (p.11, Table 2, abundance); Martynova & al., 2009 (p.133, C/N contents, length, starvation experiments); Primo & al., 2009 (p.341, Table1, interannual variations); Jonasdottir & al., 2009 (p.139, egg production vs food quality); Eloire & al., 2010 (p.657, Table II, temporal variability); Drira & al., 2010 (p.145, Tanl.2); Templeton, 2010 (p.1, p.15: fig.12, interannual variations); Mazzocchi & Di Capua, 2010 (p.428); Dvoretsky & Dvoretsky, 2010 (p.991, Table 2); Yen & Lasley, 2010 (p.177, mating track); Ianora & Miralto, 2010 (p.493, Table I: reproductive responses vs diatom diets); Seuront, 2011 (p.1, Rem.: mating); Maiphae & Sa-ardrit, 2011 (p.641, Table 2, 3, Rem.); Amin & al., 2011 (p.1965, clearance, feeding, egg production vs diets); Dzierzbicka-Glowacka & al., 2011 (p.137, growth, development); Turner & al., 2011 (p.1066, Table II, abundance 1998-2008); Martynova & al., 2011 (p.1175, seasonal abundance, feeding); Pepin & al., 2011 (p.273, Table 2, seasonal abundance); Kreibich & al., 2011 (p.182, digestive enzymes vs diets); Sichlau & al., 2011 (p.665, diapause eggs in sediments); Van Ginderdeuren & al., 2012 (p.3, Table 1); Postel, 2012 (p.327, Table 1, Fig.6); Salah S. & al., 2012 (p.155, Tableau 1); Zizah & al., 2012 (p.79, Tableau I, Rem.: p.86); Sigurdardottir, 2012 (p.1, Table 2.3, annual abundance, feeding activity, fecundity); Schulz J. & al., 2012 (p.3, abundance vs. hydrography); Johnson C & al., 2012 (p.1, 15, fig. 23a, 23b, 24b, seasonal variability, interannual variarions); Gonçalves & al., 2012 a (p.16, abundance, diel vertical behavior); Aubry & al., 2012 (p.125, table 1, 3, fig. 6, 8 a, b, interannual variation); Borg & al., 2012 (p.1, Nauplii swimming); Bruno & al., 2012 (p.1, Nauplii behaviour); Demontigny & al., 2012 (p.221, Table II, fig.5, abundance, prey by ichthyoplankton); Dvoretsky & Dvoretsky, 2012 (p.1321, Table 2, 3, 4, 5, abundance, biomass, production); Freese & al., 2012 (p.66, enzyme activity vs temperature & pH); McGinty & al., 2012 (p.122, time series abundance); Drillet & al., 2012 (p.155, Table 1, culture); Dutz & al., 2012 (p.51, population dynamic, fecundity); Gonçalves & al., 2012 (p.321, abundance vs climatic variability); Oechsler-Christensen & al., 2012 (p.161, grazing vs phytoplankton pigments); Bode & al., 2012 (p.108, spatial distribution vs time-series, % biomass); Alvarez-Fernandez & al., 2012 (p.21, Rem.: Table 1); Rekik & al., 2012 (p.336, Table 1, abundance); Arula & al., 2012 (p.33, Table 2: interannual abundance); Moison & al., 2012 (p.149, swimming behaviour vs temperature); Barton & al., 2013 (p.522, Table 1: metabolism, diapause, population dynamic, feeding mode, biogeo); Gusmao & al., 2013 (p.279, Table 3, fig.1, sex-specific predation by fish, fig.4: seasonal variation of sex ratio); Belmonte & al., 2013 (p.222, Table 2, abundance vs stations); McConville & al., 2013 (p.428, egg production vs CO2 effects); Sobrinho-Gonçalves & al., 2013 (p.713, Table 2, fig.8, seasonal abundance vs environmental conditions); Cole & al., 2013 (p.6646, microplastic ingestion); Heuschele & al., 2013 (p.399, Table 2, mate behavior); Peters & al., 2013 (p.595, seasonal variation of fatty acid, seasonal abundance ); Gerdts & al., 2013 (p.757, Table 1: microbiome vs. copepod); Moison & al., 2013 (p.459, feeding behaviour); Kürten & al., 2013 (p.167, Table 1, C:N, fatty acid); Usov & al., 2013 (p.1, interannual abundance vs temperature 1961-2010); Kiørboe & Jiang, 2013 (p.1, fig.2, 3, feeding behaviour, fluid flow); Dzierzbicka-Glowacka & al., 2013 (p.409, population dynamic, interannual variability, spatial distribution); Arendt & al., 2013 (p.105, fig.3, abundance); Zaafa & al., 2014 (p.67, Table I, occurrence); Castellani & Altunhas, 2014 (p.83, respiration vs seasonal change); Mazzocchi & al., 2014 (p.64, Table 4, abundance) ; Trottet & al., 2017 (p. 7, Table 3: resting stage); Baumgartner & Tarrant, 2017 (p.387, resting eggs, Rem.); Hansen B.W. & al., 2017 (p.984, pH effects); El Arraj & al., 2017 (p.272, table 1, 2, seasonal composition); Benedetti & al., 2018 (p.1, Fig.2: ecological functional group) ; Belmonte, 2018 (p.273, Table I: Italian zones); Chaouadi & Hafferssas, 2018 (p.913, Table II: occurrence); Dzierzbicka-Glowacka & al. 2019 (p.1, Table 2, 3, 4, 5, fig.4, 6, 8, 11, 13, 14, 16, 19, 21, production, mortality trate); Richirt & al., 2019 (p.3, Table 1, fig.2, 3, 4, 5, abundance changes vs. years 1998-2014, table 2: diversity index ) | | | | NZ: | 8 + 3 douteuses | | |
|
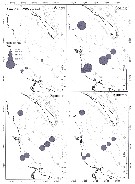
Carte de distribution de Temora longicornis par zones géographiques
|
| | | | | | | | | | | | 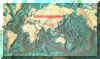 Carte de 1996 Carte de 1996 | |
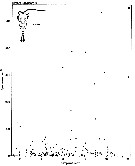
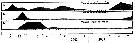
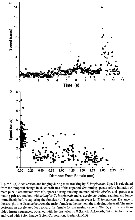
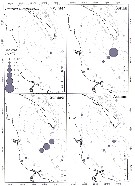
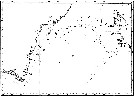 issued from : P. Jespersen, 1939 in Meddr Grønland, 1939, 119 (9). [p.61, Fig. 26]. issued from : P. Jespersen, 1939 in Meddr Grønland, 1939, 119 (9). [p.61, Fig. 26].
The occurrence of Temora longicornis at the ''Dana'' stations in 1931-1933.
black circles: positive occurrence; x: negative occurrence. |
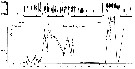
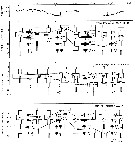
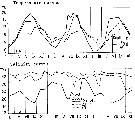
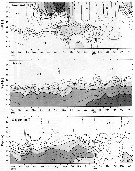
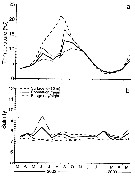
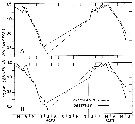
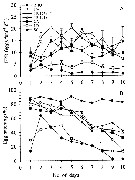
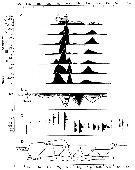 issued from : P.S.B. Digby in J. Mar. Biol. Ass. U.K., 1950, 29. [p.403, Fig.5]. issued from : P.S.B. Digby in J. Mar. Biol. Ass. U.K., 1950, 29. [p.403, Fig.5].
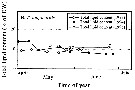
Life history of Temora longicornis at station L (5 miles from Plymouth, English Channel).
A: abundance of copepodite stages; B: percentage distribution of stages; C: size-groups of adult females; D: suggested interpretation of generations (or cohorts) succession during the year (1947).
Correlate the size variations with the water temperature at station L4 (p.397, Fig.1).
The author deduces the succession of 5 generations. |
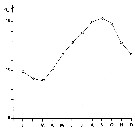
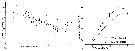
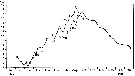 issued from : P.S.B. Digby in J. Mar. Biol. Ass. U.K., 1950, 29. [p.397, Fig.1]. issued from : P.S.B. Digby in J. Mar. Biol. Ass. U.K., 1950, 29. [p.397, Fig.1].
Temperature of the water at 1 and 30 m depth at station L4 (5 miles from Plymouth, English Channel) during 1947. x; surface readings from closer in-shore. |
 issued from : J. Le Ruyet-Person, C. Razouls & S. Razouls in Vie Milieu, 1975, XXV (2B). [p.302, Fig.6]. issued from : J. Le Ruyet-Person, C. Razouls & S. Razouls in Vie Milieu, 1975, XXV (2B). [p.302, Fig.6].
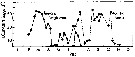
Life history of Temora longicornis at Roscoff (English Channel) during the year.
Variations of the ephalothoracic lengths (in mm); Number of adult females and males.
The number of generations (or main cohorts is estmated to five for the year in relation to the temperature (See p.285, Fig.1). |
 issued from : J. Le Ruyet-Person, C. Razouls & S. Razouls inVie Milieu, 1975, XXV (2B). [p.285, Fig.1]. issued from : J. Le Ruyet-Person, C. Razouls & S. Razouls inVie Milieu, 1975, XXV (2B). [p.285, Fig.1].
Temperature variations of surface water (mean by month) during the year at Roscoff (Western English Channel) |
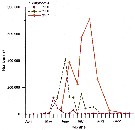
 issued from : F. Bodo, C. Razouls & A. Thiriot in Cah. Biol. Mar., VI, 1965. [p.230, Fig.7]. issued from : F. Bodo, C. Razouls & A. Thiriot in Cah. Biol. Mar., VI, 1965. [p.230, Fig.7].
Annual quantitative variations of adults for Temora longicornis and Centropages hamatus at Roscoff (English Channel) interpreted as competition between them.
n x 1000
|
 issued from : H.G. Fransz, S.R. Gonzalez, G.C. Cadée & Hansen F.C. in Neth. J. Sea Res., 1992, 30. [p.27, Table 1, Fig.5]. issued from : H.G. Fransz, S.R. Gonzalez, G.C. Cadée & Hansen F.C. in Neth. J. Sea Res., 1992, 30. [p.27, Table 1, Fig.5].
Long-term change of Temora longicornis abundance in a Dutch tidal inlet (Marsdiep, Texel, North Sea) in relation to eutrophisation.
Nota: The long-term increase of Temaora longicornis could have been induced by an increased reproduction and growth rate or by a decreased mortality.
It is not likely that mortality by predation decreased, because the the carnivore predators tended to increase (see Boddeke & Hagel, 1991). The results suggest that eutrophisation had a stimulating effect on the abundance, and possibly the length of the growing season in relation with a corresponding lengthening and earlier start of the Phaeocystis bloom. |
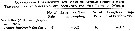
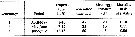 issued from : H.G. Fransz, Gonzalez S.R. & Klein Breteler W.C.M. in 23rd European Mar. Biol., Univ. of Wales, Swansea, 1989. [p.88, Table 4]. issued from : H.G. Fransz, Gonzalez S.R. & Klein Breteler W.C.M. in 23rd European Mar. Biol., Univ. of Wales, Swansea, 1989. [p.88, Table 4].
Some characteristics of 3 successive generations of Temora longicornis per year.
Nota: The results in Table suggest that the first 2 new generations of the year can cope with mortality rates of 0.10 to 0.11/day, but the third generation in summer only with 0.06/day.
It seems that the deterioration of food condition in the sea causes a decline in numbers already in the second new generation, spawned in May-June. The low, but steady egg production from June to September may be very important to maintain a pelagic hibernating population, which can produce the first new generation in spring.
It has been proposed, that for the development of the first generation neritic pelagic copepod populations depend on resting eggs hatching in the bottom sediment. Lindley (1986) mentioned T. longicornis nauplii emerging from bottom sedment of the southern North Sea. Since a tenfold multiplication in the first new generation is possible already at a realistic mortality rate of 0.07/day, hatching of resting eggs does not seem to be essential for persistence. |
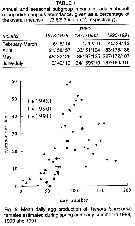
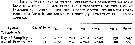
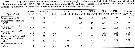
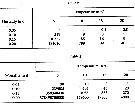 issued from : H.G. Fransz, Gonzalez S.R. & Klein Breteler W.C.M. in 23rd European Mar. Biol., Univ. of Wales, Swansea, 1989. [p.87, Table 2, 3]. issued from : H.G. Fransz, Gonzalez S.R. & Klein Breteler W.C.M. in 23rd European Mar. Biol., Univ. of Wales, Swansea, 1989. [p.87, Table 2, 3].
Table 2: Daily egg production per female required for stable populations of T. longicornis at high food level.
Table 3: Daily egg production per female required for stable populations of at low food level.
Nota: Daily fecundity required for a stable population at different temperatures and mortality suggest taht at 5°C the population can only persist at high food level and a mean mortality below about 0.07/day. Maximum daily fecundity of 30 eggs p.female at high food level and temperature above 10°C enables the population to withstand a mortality rate up to 0.5/day. A low but non-zero fecundity at low food level and high temperature can stabilize the population at a mortality rate of about 0.05/day.
See Klein Breteler & Gonzalez in Syllogeus, 1986, 58: 71-84 |
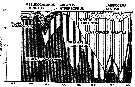
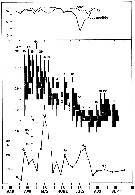
 issued from : U. Brenning in Wiss. Z. Wilhelm-Pieck-Univ. Rostock -34. Jahrgang 1985. Mat.-nat. wiss. Reihe, 6. [p.12, Fig.9]. issued from : U. Brenning in Wiss. Z. Wilhelm-Pieck-Univ. Rostock -34. Jahrgang 1985. Mat.-nat. wiss. Reihe, 6. [p.12, Fig.9].
Spatial distribution for Temora longicornis and Temora turbinata from from 8° S - 26° N; 16°- 20° W for different expeditions (V1: Dec. 1972-Jan. 1973; V2: Feb./mar. 1973; VI: May 1974; IV: Jun./Jul. 1972). |
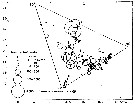 issued from : U. Brenning in Wiss. Z. Wilhelm-Pieck-Univ. Rostock -34. Jahrgang 1985. Mat.-nat. wiss. Reihe, 6. [p.13, Fig.10]. issued from : U. Brenning in Wiss. Z. Wilhelm-Pieck-Univ. Rostock -34. Jahrgang 1985. Mat.-nat. wiss. Reihe, 6. [p.13, Fig.10].
T-S Diagram for Temora longicornis and Temora turbinata from from 8° S - 26° N; 16°- 20° W.
SO: Southern Surface Water (S °/oo: 34,50; T°C: 29,0); ND: Northern Water of the Surface Layer (S °/oo: 37,5; T°C: 21,0); SD: Southern Deep Water of the surface layer (S °/oo: 35,33; T°C: 13,4). See commentary in Temora stylifera and Brenning (1985 a, p.6). |
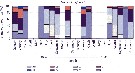
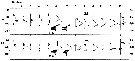 issued from : J.-M; Brylinski, D. Bentley & C. Quishoudt in J. Plankton Res., 1988, 10 (3). [p.506, Fig.3]. Lenth prosome histogramm (in mm) of Temora longicornis females (F) and males (M) in relation to the transect from Boulogne-sur-Mer to Dover, through the Dover Strait (stations 1 to 13). issued from : J.-M; Brylinski, D. Bentley & C. Quishoudt in J. Plankton Res., 1988, 10 (3). [p.506, Fig.3]. Lenth prosome histogramm (in mm) of Temora longicornis females (F) and males (M) in relation to the transect from Boulogne-sur-Mer to Dover, through the Dover Strait (stations 1 to 13).
The dotted line is arbitrary reference. Each stations equidistant. |
 issued from : C.W. Gill & D.J. Crisp in J. Exp. Mar. Biol. Ecol., 1985, 86. [p.188, Fig.1; p.189, Fig.2]. issued from : C.W. Gill & D.J. Crisp in J. Exp. Mar. Biol. Ecol., 1985, 86. [p.188, Fig.1; p.189, Fig.2].
The effect of size and temperature on the frequency of limb beat of Temora longicornis (collected from Menai Strait, Gwynedd, Wales):
Fig.1: The natural log (ln) plot of the limb (A2) beat frequency (Hz) for females recorded at 10°C, against cephalothorax length.
Fig.2: Mean values of limb (A2) beat frequency between 5 and 25°C for the winter population acclimated at 5 and 15°C (range marks indicate SE); mean of 5°C acclimated copepods = 24.74; mean of 15°C acclimated copepods = 22.68; least significant difference (T 5%) = 0.77 (P < 0.005, highly significant).
Nota: The limb (A2) frequency recorded for females with cephalothorax lengths varying from 53.10 to 91. 90 micrometers. The rate of limb beat ranged from 15.0 to 25.3 Hz, and decreased logarithmically with a logarithmic increase in the size of the copepods.
The effect of temperature at different season shows that over the range of temperature studied, the frequency of limb beat varied from 10.6 to 37.8 Hz during the winter, and from 7.9 to 38.0 Hz in the summer. The swimming rate increased with increasing temperature up to the point where damaging or inhibitory effects occurred. T. longicornis was adversely affected at temperatures > 20°C in winter, and stopped swimming altogether at temperatures > 25°C. No difference in rate of limb was found between similar sized males and females. |
 issued from : G.C. Harding, W.P. Vass, B.T. Hargrave & S. Pearre in Can. J. Fish. Aquat. Sci., 1986, 43 (5). [p.958, Fig.4]. issued from : G.C. Harding, W.P. Vass, B.T. Hargrave & S. Pearre in Can. J. Fish. Aquat. Sci., 1986, 43 (5). [p.958, Fig.4].
Depth-frequency diagrams and trap results of Temora longicornis large and small females and males during the 24-h study.
Incident radiation recorded on deck is indicated in the upper panel; arrows indicate sunset and sunrise. The actual number of individuals moving up or down into the traps at 8, 14, 21 and 28 m is indicated next to each arrow.
Trap deployment and retrieval time was set to coincide with the middle of adjacent horizontal, net-tow series.
The 25 and 75 % population quartiles are connected by broken lines and the population median is indicated by a black dot.
The number located inside each depth-frequency diagram (scale lower right) is the estimated number of individuals/ m3 in the water column during this series of horizontal net tows.
Sampling for eight and four periods, respectively, between 10:30 August 19 and 09:30 August 20, 1980, at St. Georges Bay, shallow marine embayment open on the north to Northumberland Strait and the southern Gulf of St. Lawrence.
Nota: Engine and deployment of mooring traps figured in Harding & al. (1987) and Harding & al. (1986). |
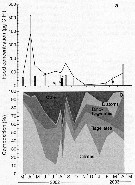
 issued from : B.T. Hargrave, G.C. Harding, K.F. Drinkwater, T.C. Lambert & W.G. Harrison in Mar. Ecol. Prog. Ser., 1985, 20. [p.227, Fig.7]. issued from : B.T. Hargrave, G.C. Harding, K.F. Drinkwater, T.C. Lambert & W.G. Harrison in Mar. Ecol. Prog. Ser., 1985, 20. [p.227, Fig.7].
Major species of zooplankton present at the central station in St. Georges Bay (45°45'N, 61°45'W) during 1977.
Nota: All zooplankton collections were made after sunset. The net towed obliquely throughout the water column (± 34 m in depth). |
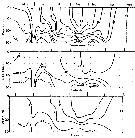 issued from : B.T. Hargrave, G.C. Harding, K.F. Drinkwater, T.C. Lambert & W.G. Harrison in Mar. Ecol. Prog. Ser., 1985, 20. [p.223, Fig.2]. issued from : B.T. Hargrave, G.C. Harding, K.F. Drinkwater, T.C. Lambert & W.G. Harrison in Mar. Ecol. Prog. Ser., 1985, 20. [p.223, Fig.2].
Seasonal profiles of water temperature and salinity in St. Georges Bay (45°45'N, 61°45'W) near the central station during 1977. |
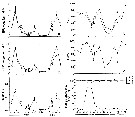
 issued from : S. Eriksson in ZOON, 1976, 4. [p.157, Fig.2]. issued from : S. Eriksson in ZOON, 1976, 4. [p.157, Fig.2].
Seasonal distribution of neritic copepod Temora longicornis off Gothenburg (Göteborg), The Skattegatt. (Monthly means for adult specimens during 1968-1973; point : inshore, depth = 10 m; x: offshore, depth > 40 m.
This species has the period of main occurrence during the late part of the summer when the surface water is warmer than 10°C., In spite of this, the temperature optimum is between 0 to 20°C. |
 issued from : S. Eriksson in ZOON, 1976, 4. [p.159, Fig.3, e]. issued from : S. Eriksson in ZOON, 1976, 4. [p.159, Fig.3, e].
Temperature occurrence of neritic copepod Temora longicornis off Gothenburg (Göteborg), The Skattegatt.
.Surface salinity of the investigation area varies around 25 p.1000 and the deep water slinity around 34 p.1000. There is a temperature stratification with surface water warmer than 10°C from May to October with maximum of 20°C in August. The coldest period is January to March with surface temperatures of 1-2°C. The deep water ranges between 5 and 10°C.
The hauls were horizontal at 2, 20, and 40 m.
Limits subjectively regarded as the optimum temperature range: 0-20°C. |
 issued from : S. Eriksson in ZOON, 1973, 1. [p.58, Fig.21]. issued from : S. Eriksson in ZOON, 1973, 1. [p.58, Fig.21].
Size distribution of adult females of Temora longicornis (offshore station H6:11°30' N, 57°40'.5 E, The Kattegatt) in the main series during 1968-70. |
 issued from : S. Eriksson in Mar. Biol., 1974, 26. [p.320, Figs. 2-3] issued from : S. Eriksson in Mar. Biol., 1974, 26. [p.320, Figs. 2-3]
Salinity and temperature curves for main series at offshore station H6 (11°30' N, 57°40'.5 E, The Kattegatt) from March 1968 to November 1970. |
 issued from : I.A. McLaren inJ. Fish. Res. Board Can., 1978, 35. [p.1337, Fig.6]. issued from : I.A. McLaren inJ. Fish. Res. Board Can., 1978, 35. [p.1337, Fig.6].
Life cycles of Temora longicornis in Loch Striven (55°55'N, 05°10'W).
Relative abundance of C V as a percentage of all copepodids (lower panel); size and numbers per haul (including combined hauls from 60 m to 10 m and 10 to 0 m) of adult females (middle panel), and percentage of nauplii and copepodids above 10 m (from split hauls, taken from 60 to 10 m and 10 to 0 m) (upper panel).
Successive generations as infered from peaks in the C V cohorts and size changes designated as Go, G1, etc.
Data from Marshall (1949, tables VII and XIX). |
 issued from : J. Chojnacki in Int. Revue ges. Hydrobiol., 1983, 68 (3). [p.436, Fig.1]. issued from : J. Chojnacki in Int. Revue ges. Hydrobiol., 1983, 68 (3). [p.436, Fig.1].
Length-weight relationship determined by geometrical method (Pattern from calanoid-form Pseudocalanus elongatus).
Lc = cephalothorax length; La = urosome length; Lan = antennula length; h : cephalothorax height; Ra = diameter of urosome cross-section; Ran = diameter of antennula cross-section.
A conversion factor of 1.025, reflecting the density (g per cm3) of the coastal Baltic water.
The correlation coefficient for the relationship studied was found to be about 0.96
|
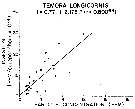
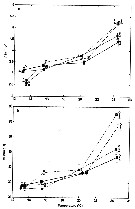
 issued from : J. Chojnacki & M.M. Hussein in Zesz. nauk. Akad. Roln. Szczec., 1983, 103. [p.55, Fig.1]. issued from : J. Chojnacki & M.M. Hussein in Zesz. nauk. Akad. Roln. Szczec., 1983, 103. [p.55, Fig.1].
Total length - weight relationship in selected copepod species (copepodites I to V and adults) from the eastern sector of the Southern Baltic Sea.
Animals preserved in 4 % formalin and lengths in different copepodites and adults stages measured under stereomicroscope. Volume et weight calculated according to the simplified formula (Chojnacki & al., 1980). The results in fig. 1 present mean Lt (total length values for different developmental stades (nauplii not examined) by season and area. |
 issued from : J. Chojnacki in Syllogeus, 1986, 58. [p.536, Fig 1, 2]. issued from : J. Chojnacki in Syllogeus, 1986, 58. [p.536, Fig 1, 2].
Fig.1 (left side): Total length-weight relationship for all copepodid stages of Temora longicornis in the Gdansk Bay (Baltic Sea).
Fig.2 (right side): Calculated deasonal means of the total length (Lt) of each developmental stage of Temora longicornis in the southern Baltic Sea (calculated using formula of Borutzky, 1960). |
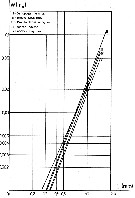
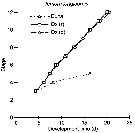
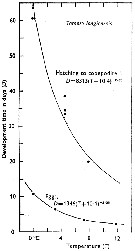 Issued from : C.J. Corkett & I.A. McLaren in J. mar. biol. Ass. U.K., 1970, 50. [p.164, Fig.I]; Issued from : C.J. Corkett & I.A. McLaren in J. mar. biol. Ass. U.K., 1970, 50. [p.164, Fig.I];
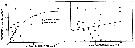
Development times of eggs to harching and between hatching and appearance of copepodite I in abundant food at the different temperatures. The points are means for eggs and individuals for older stages.
Individuals of Temora longicornis from waters near Halifax (Nova Scotia) raised in vials with an excess of food (Isochrysis galbana) at several controlled temperatures (See in Corkett, 1967). |
 Issued from : R.J. Conover in Rapp. P.-v. Réun. Cons. int. Explor. Mer, 1978, 173. [p.69, Fig.54]. Issued from : R.J. Conover in Rapp. P.-v. Réun. Cons. int. Explor. Mer, 1978, 173. [p.69, Fig.54].
Regression between rate of ingestion (I) for Temora longicornis from Bedford Basin, Nova Scotia (Canada) and particle concentration in the same environment. |
 Issued from : R.J. Conover in Rapp. P.-v. Réun. Cons. int. Explor. Mer, 1978, 173. [p.73, Fig.61, 62]. Issued from : R.J. Conover in Rapp. P.-v. Réun. Cons. int. Explor. Mer, 1978, 173. [p.73, Fig.61, 62].
Feeding efficiency in percent for Temora longicornis feeding on natural particulate matter from Bedford Basin, Nova Scotia. (Canada).
A: 9 December 1975; B: 31 May 1976.
Nota: At low ambient concentration in the fall large particles are used principally (A), but as the particle concentration was increased artificially (maximum 5.409 ppm) feeding efficiency followed a curve similar to that exhibited by animals grazing at higher ambient levels, particularly of smaller sized particles, in spring (B). Hence, feeding efficiency is clearly influenced by concentration and, though not shown by these figures, by where the concentration is distributed over the particle spectrum.
Perhaps the influence of distribution of particle concentration on feeding performance is better illustrated by figure 63, in which the author has plotted filtering rate, as a means of scaling feeding performance in a series of ''manipulated'' particle spectra, against particle concentration using the same experimental data from which figure 61 (A) was derived.. Here is concentrated or diluted certain portions of the spectrum only. The scal for filtering rate appears on right on the left ordinate and concentration on the left. |
 Issued from : R.J. Conover in Rapp. P.-v. Réun. Cons. int. Explor. Mer, 1978, 173. [p.74, Fig.63]. Issued from : R.J. Conover in Rapp. P.-v. Réun. Cons. int. Explor. Mer, 1978, 173. [p.74, Fig.63].
Feeding by zooplankton, mostly by Temora longicornis on various particle spectra.
Lower graph LT3T, ambient water passed through 10 µm filter; next graph up from bottom WW3T, ambient concentration on 10 December 1975; middle graph WW3ET, ambient concentration plus particles passed by a 54 µm mesh filter but retained by a 74µm filter; one graph top LT3PT, ambient water after filtration through 10 µm mesh plus Platymonas sp. as an enrichment; top graph WW3PET ambient water enriched with Platymonas sp. and by particles retained between 54 and 74 µm.
Nota: The bottom graph reprents a relatively flat spectrum, noting that the ordinate has a different scale than in the other four graphs. Feeding, what little occurs, is concentrated in the 5 to 10 µm range. The next graph up depicts feeding at ambient concentration which is concentrated in the 30 to 80 µm range, but note that there is some utilization at the small end of the spectrum. The remaining three graphs show the attempt of the author to increase concentration in the same areas of the spectrum where feeding was occurring at ambient concentration |
 Issued from : A. Berner in J. mar. biol. Ass. U.K., 1962, 42. [p.626, Fig.1]. Issued from : A. Berner in J. mar. biol. Ass. U.K., 1962, 42. [p.626, Fig.1].
Right maxilla of Temora longicornis female (from Garroch Head and Fairlie Channel in the Clyde), and outlines of some food organisms to the same scale. |
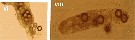
 Issued from : R.J. Conover in J. Fish. Res. Bd. Canada, 1971, 28. [Fig.1]. Issued from : R.J. Conover in J. Fish. Res. Bd. Canada, 1971, 28. [Fig.1].
a: A living Temora longicornis (from Chedabucto Bay, Nova Scotia, February 4, 1970) showing dark food mass in foregut and newly fecal pellet in the hindgut.
b: A living Temora longicornis with ''oil'' particle (A) held by the gnathobases of the Mx1 as though about to be ingested.
c: Typical Temora longicornis fecal pellets. d: fecal pellet crushed under a cover slip showing ''oil'' droplets (A), phase contrast lighting. |
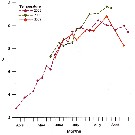
 Issued from : V. Sigurdardottir inmaster's thesis, Faculty of Life and Environmetal Sciences, Univ. of Iceland, Reykjavik: 2012. [p.31, Fig.2.8]. Issued from : V. Sigurdardottir inmaster's thesis, Faculty of Life and Environmetal Sciences, Univ. of Iceland, Reykjavik: 2012. [p.31, Fig.2.8].
Total abundance (number/m2) of Temora longicornis from Breidafjördur (W Iceland) during spring and summer 2007, 2008 and 2009.
Collected with WP-2 net, towed vertically from the bottom to surface. |
 Issued from : V. Sigurdardottir inmaster's thesis, Faculty of Life and Environmetal Sciences, Univ. of Iceland, Reykjavik: 2012. [p.21, Fig.2.2]. Issued from : V. Sigurdardottir inmaster's thesis, Faculty of Life and Environmetal Sciences, Univ. of Iceland, Reykjavik: 2012. [p.21, Fig.2.2].
Average temperatiure from 0-50 meter depth from Breidafjördur (W Iceland) during spring and summer 2007, 2008 and 2009.
Numbers are average from measurements of both stations. |
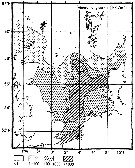 Issued from : M. Krause, J.W. Dippner & J. Beil in Prog. Oceanog., 1995, 35. [p.121, Fig.34]. Issued from : M. Krause, J.W. Dippner & J. Beil in Prog. Oceanog., 1995, 35. [p.121, Fig.34].
Horizontal distribution pattern of Temora longicornis (individuals per m2) in the winter North Sea.
Collected by WP2-net. Numbers (ind/m3) depth-integrated, extrapoled to the bottom (but at a maximum to a depth of 500 m) and expressed as ind per m2 of water surface. |
 Issued from : Jan Schulz & coll. in Progr. Oceanogr., 2012, 107; [p.8, Fig.4 [modified]); Issued from : Jan Schulz & coll. in Progr. Oceanogr., 2012, 107; [p.8, Fig.4 [modified]);
Seasonal patterns in the abundance of Acartia longiremis in the Bornholm Basin (central Baltic Sea) between March 2002 and May 2003. The scaling is normalised to one and vertical lines indicate sampling dates.
Sampling performed in stacked, 10m intervals from a few meters above the seafloor to the surface with a multinet (Hydro-bios, Kiel, 50 µm mesh size) on nine focus stations.
Compare with annual cycle in Acartia longiremis, Acartia bifilosa, Centropages hamatus, Oithona similis and other forms. |
 Issued from : Jan Schulz & coll. in Progr. Oceanogr., 2012, 107; [p.6, Fig.2]. Issued from : Jan Schulz & coll. in Progr. Oceanogr., 2012, 107; [p.6, Fig.2].
Vertical profiles of temperature, salinity and oxygen in the central Bornholm Basin (Baltic Sea) at position 55.3016° N, 15.7966° E. |
 Issued from : M. Cole, P. Lindeque, E. Fileman, C. Halsband, R. Goodhead, J. Moger & T.S. Galloway in Environ. Sci. Technol., 2013, 47. [p.66,49, Fig.1, i]. Issued from : M. Cole, P. Lindeque, E. Fileman, C. Halsband, R. Goodhead, J. Moger & T.S. Galloway in Environ. Sci. Technol., 2013, 47. [p.66,49, Fig.1, i].
Temora longicornis: vi, 30.6 µm polystyrene beads in the posterior-gut during egestion; vii, faecal pellet containing 30.6 µm polystyrene beads; visualized using fluorescence microscopy. |
 Issued from : T. Kiørboe in Oecologia, 2008, 155. [p.185, Table 2]. Issued from : T. Kiørboe in Oecologia, 2008, 155. [p.185, Table 2].
Grand average swimming speeds (±SD) and cephalothorax lengths of males and females of Temora longicornis.
Nota: Experimental animals were reared in the laboratory at 16°C.
Compare with Temora stylifera. |
 Issued from : T. Kiørboe in Oecologia, 2008, 155. [p.186, Table 3]. Issued from : T. Kiørboe in Oecologia, 2008, 155. [p.186, Table 3].
Horizontal (Vx) and vertical (Vy) average swimming speeds (±SD) in Temora longicornis.
Nota: Swimming speeds of starved males and females were identical to those of fed ones.
Compare with Temora stylifera. |
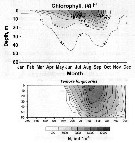
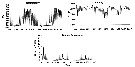 Issued from : N. Usov, I. Kutcheva, I. Primakov & D. Martynova in Hydrobiologia, 2013, 706. [p.18, Fig.3]. Issued from : N. Usov, I. Kutcheva, I. Primakov & D. Martynova in Hydrobiologia, 2013, 706. [p.18, Fig.3].
Long^term dynamics of monthly temperature, salinity and Temora longicornis abundance in the layer of 0-10 m in Chupa Inlet (Kandalaksha Bay, White Sea) from 1961 to 2010. Sampling from water layers (0-10, 10-25, and 25-45 m) using a standard Juday net (mesh size 200 µm). |
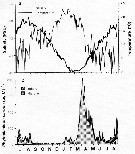
 Issued from : N. Usov, I. Kutcheva, I. Primakov & D. Martynova in Hydrobiologia, 2013, 706. [p.17, Fig.2 & p.23, Fig.7]. Issued from : N. Usov, I. Kutcheva, I. Primakov & D. Martynova in Hydrobiologia, 2013, 706. [p.17, Fig.2 & p.23, Fig.7].
Long-term average of Chl a and seasonal dynamics of Temora longicornis in Chupa Inlet (White Sea). |
 Issued from : D.M. Martynova, M. Graeve & U.V. Bathmann in Polar Biol., 2009, 32. [p.136, Table 1. Issued from : D.M. Martynova, M. Graeve & U.V. Bathmann in Polar Biol., 2009, 32. [p.136, Table 1.
Biochemical parameters of Temora longicornis from the White Sea (66°20.2'N, 33°38.9'E). |
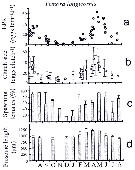 issued from : C. Halsband & H.J. Hirche in Mar. Ecol. Prog. Ser., 2001, 209. [p.223, Fig.4]. issued from : C. Halsband & H.J. Hirche in Mar. Ecol. Prog. Ser., 2001, 209. [p.223, Fig.4].
Temora longicornis. Reproductive parameters at Helgoland Roads.
(a) Egg production rate; (b) clutch size, weekly means ± SD; egg production rate; (c) proportion of females spawning; (d) prosome length. |
 issued from : C. Halsband & H.J. Hirche in Mar. Ecol. Prog. Ser., 2001, 209. [p.221, Fig.2]. issued from : C. Halsband & H.J. Hirche in Mar. Ecol. Prog. Ser., 2001, 209. [p.221, Fig.2].
Seasonal cycles of (a) temperature and salinity at Helgoland Roads. (b) phytoplankton at Helgoland Roads. 'others' = total phytoplankton carbon - diatom carbon. Phytoplankton data smoothed by 3-point running average. |
 issued from : C. Halsband & H.J. Hirche in Mar. Ecol. Prog. Ser., 2001, 209. [p.224, Table 2]. issued from : C. Halsband & H.J. Hirche in Mar. Ecol. Prog. Ser., 2001, 209. [p.224, Table 2].
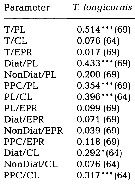
Correlation coefficients (r2) between temperature at collection (T), prosome length (PL), clutch size (CL), egg production rate (EPR), diatom carbon (Diat), non-diatom carbon (NonDiat), and total phytoplankton carbon (PPC) at Helgoland Roads.
Clutch size = daily egg production rate of spawning females. Sample size in parentheses. Significance levels = * p<0.01; *** p < 0.0001. |
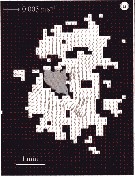 Issued from : T. Kiørboe & H. Jiang in J. R. Soc. Interface, 2013, 10. [p.3, Fig.2 a]. Issued from : T. Kiørboe & H. Jiang in J. R. Soc. Interface, 2013, 10. [p.3, Fig.2 a].
Example of instantaneous flow field of feeding Temora longicornis.
Region with flow velocity exceeding U* = 0.6 mm/s shaded white. |
 Issued from : L. Dzierzbicka-Glowacka, M. Kalarius & M.I. Zmijewska in Oceanologia, 2013, 55 (2). [p.420, Fig.8]. Issued from : L. Dzierzbicka-Glowacka, M. Kalarius & M.I. Zmijewska in Oceanologia, 2013, 55 (2). [p.420, Fig.8].
Horizontal distribution of the total abundance [indiv. m2] of Temora longicornis in the Gulf of Gdansk in 2006-2007. |
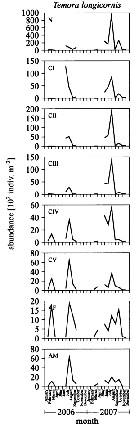 Issued from : L. Dzierzbicka-Glowacka, M. Kalarius & M.I. Zmijewska in Oceanologia, 2013, 55 (2). [p.416, Fig.4]. Issued from : L. Dzierzbicka-Glowacka, M. Kalarius & M.I. Zmijewska in Oceanologia, 2013, 55 (2). [p.416, Fig.4].
Abundance [indiv. m2] of developmental stages of Temora longicornis at station J23 (54°32.0'N, 18*48.2'E) in the Gulf of Gdansk in 2006-2007.
AM: adult male; AF: adult female. |
 Issued from : L. Dzierzbicka-Glowacka, M. Kalarius & M.I. Zmijewska in Oceanologia, 2013, 55 (2). [p.418, Fig.6]. Issued from : L. Dzierzbicka-Glowacka, M. Kalarius & M.I. Zmijewska in Oceanologia, 2013, 55 (2). [p.418, Fig.6].
Stage structure of Temora longicornis at station J23 in the Gulf of Gdansk in 2006-2007 (the months without data have been omitted).. |
 Issued from : L. Dzierzbicka-Glowacka, M. Kalarius & M.I. Zmijewska in Oceanologia, 2013, 55 (2). [p.423, Fig.11]. Issued from : L. Dzierzbicka-Glowacka, M. Kalarius & M.I. Zmijewska in Oceanologia, 2013, 55 (2). [p.423, Fig.11].
Vertical distribution [%] of nauplii, C1 to C5 and adults (M and F) of Temora longicornis at station J23 in the Gulf of Gdansk in 2006-2007. |
 Issued from : W.C.M. Klein Breteler, N. Schogt, M.B.S. Schouten & G.W. Kraay in Mar. Biol., 1999, 135. [p.195, Fig.1]. Issued from : W.C.M. Klein Breteler, N. Schogt, M.B.S. Schouten & G.W. Kraay in Mar. Biol., 1999, 135. [p.195, Fig.1].
Temora longicornis: Cumulative development time (days) of copepod life stages at 15°C using different food sources: Dunaliella sp. (Duna), Oxyrrhis marina grown on Dunaliella sp. [Ox (d)], or Oxyrrhis marina grown on Rhodomonas sp. [Ox (r)];
Egg (0), Nauplius I to VI (1 to 6), Copepodite I to V (7 to 11) and adult (12) stages.
First data point obtained from Klein breteler et al. (1994) at constant conditions of a mixed food used in stock cultures.
Dunaliella sp.: chliorophycean; Oxyrrhis sp.: heterotrophic dinoflagellate. |
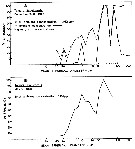
 Issued from : J. Dutz, J.E.E. van Beusekom & R. Hinrichs in Mar. Ecol. Prog. Ser., 2012, 462. [p.57, Fig.6]. Issued from : J. Dutz, J.E.E. van Beusekom & R. Hinrichs in Mar. Ecol. Prog. Ser., 2012, 462. [p.57, Fig.6].
Temora longicornis. Seasonal variation in length (solid line) and length frequency (bars) of females at the central station in the Bornholm Basin (Baltic Sea) during March 2002 to August 2003.
The horizontal lines at the bottom of the figure indicate succession of female generations as dexcribed by Dutz & al. (2010).
The length is the measure of the prosome. |
 Issued from : J. Dutz, J.E.E. van Beusekom & R. Hinrichs in Mar. Ecol. Prog. Ser., 2012, 462. [p.55, Fig.3]. Issued from : J. Dutz, J.E.E. van Beusekom & R. Hinrichs in Mar. Ecol. Prog. Ser., 2012, 462. [p.55, Fig.3].
Weighted mean (a) temperature and (b) salinity experienced by the female Temora longicornis population in the Bornholm Basin (55°17.5'N, 15°45'E) during March 2002 to August 2003 (solid line). Dotted lines give the day/night range of the weighted mean caused by diurnal vertical migration, and the dashed lines give the seasonal variation in surface temperature and salinity. . |
 Issued from : J. Dutz, J.E.E. van Beusekom & R. Hinrichs in Mar. Ecol. Prog. Ser., 2012, 462. [p.56, Fig.4]. Issued from : J. Dutz, J.E.E. van Beusekom & R. Hinrichs in Mar. Ecol. Prog. Ser., 2012, 462. [p.56, Fig.4].
Seasonal variation in (a) food concentration (grey bars, in µg per litre) and (b) composition (%) over the distribution range of Temora longicornis females at the central station of the bornholm Basin during March 2002 to August 2003.
The solid line in (a) represents the food concentration at the surface (0-30 m), and symbols represent supplemental stations. In figure (b) the black color indicates other groups of protists. |
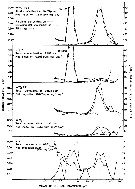
 Issued from : J. Dutz, J.E.E. van Beusekom & R. Hinrichs in Mar. Ecol. Prog. Ser., 2012, 462. [p.57, Fig.5]. Issued from : J. Dutz, J.E.E. van Beusekom & R. Hinrichs in Mar. Ecol. Prog. Ser., 2012, 462. [p.57, Fig.5].
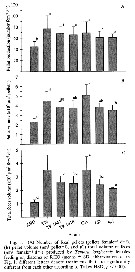
Temoea longicornis. Seasonal variation in (a) mean (±SE) egg production (EPR°, (b) spawning frequency (%FS), (c) mean (±SE) spawning female egg production (sfEPR), (d) egg hatching success (HS), (e) mean (±SE) specific egg production (spEPR) and (f) female abundance and female:male ratio (F:M) at the central station (filled circles) and supplemental stations in the study area in the Bornholm Basin during March 2002 to August 2003.
Grey lines show the model predictions for (a): See Table 4 (p.59).
Nota: Females reproduced throughout the year, but the mean EPR varied considerably depending of the season (fig.5a). It is hight in April in both years, with a mean (±SE) daily rate of 12.3 ± 1.8 and 9.8 ± 1.7 eggs per female.
The ratio in female/male abundance fluctuated around 1, with values varying from 0.6 to 1.3 (fig.5f). A low female/male ratio was observed in summer 2002 and spring 2003. |
 Issued from : M. Moison, F.G. Schmitt & S. Souissi in Aquatic Biology, 2012, 18. [p.153, Fig.2]. Issued from : M. Moison, F.G. Schmitt & S. Souissi in Aquatic Biology, 2012, 18. [p.153, Fig.2].
Temora longicornis. (a) Average instantaneous velocity (Vi) and (b) maximum Vi (mean ± confidence limits), averaged from trajectories extracted for each experiment (male: black line; female: grey line) on 31 August 2007 (dashed line) and 26 February 2008 (solid line).
Significant differences were noted between temperature conditions for the same sex and the same season (*), between both seasons for the same sex and the same temperature (triangle) and between both sexes for the same temperature and the same season (lozenge) (Mann-Whitney U-test, alpha = 5%). |
 Issued from : J.O. Evjemo, K.I. Reitan & Y. Olsen in Aquaculture, 2003, 227. [p.197, Fig. 1B]; Issued from : J.O. Evjemo, K.I. Reitan & Y. Olsen in Aquaculture, 2003, 227. [p.197, Fig. 1B];
Total lipid content (% of dry weigth) in Temora longicornis from late April until late June-early July during 1 week of sampling in Haapollen (Bømlo, SW Norway) during 3 successive years. |
 Peterson W.T. & Bellantoni, 1987 (p.415, Fig.6]. Peterson W.T. & Bellantoni, 1987 (p.415, Fig.6].
Fecundity of Temora longicornis and Temora tonsa in Long Island Sound (USA). |
 Peterson W.T. & Bellantoni, 1987 (p.416, Fig.7, a, b]. Peterson W.T. & Bellantoni, 1987 (p.416, Fig.7, a, b].
Scattergramms of egg production against chlorophyll concentration for Temora longicornis in Long Island Sound. |
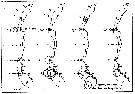
 Issued from S. Jansen in Helgol. Mar. Res., 2008, 62. [p.253, Fig.3 a-f]. Issued from S. Jansen in Helgol. Mar. Res., 2008, 62. [p.253, Fig.3 a-f].
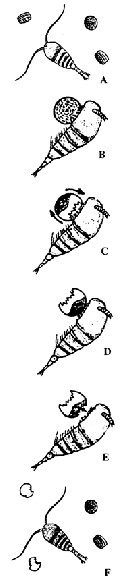
Schematic diagram of the behaviour of Temora longicornis grazing on Coscinodiscus wailesii.
After capture of the cell, the copepod was able to fix the position of the diatom relative to itself with considerable accuracy. When a piece of the frustule is bitten off, the protoplasma, i.e; the nutritious content of the diatom, concentrates on the opposite side of the cell which also occurs when a frustule is broken with a needle. During feeding, this happened as soon as the frustule is broken by the mandibles of the copepod (Fig. 3c). T. longicornis then turnede the cell with its feeding and locotory appendages till the concentrated protoplasma was directly adjacent to the mouth (Fig. 3d). The copepod bit again a piece out of the frustule and then could reach and ingest the cell content (Fig. 3e). The empty silica frustule was ultimately rejected. Almost no microscopically visible material digestible for the copepod remained within the diatom shell. The rejected emptied frustules showed a characteristic pattern with mostly two (up to five) parts bitten out of the frustules (Fig. 3f). The handling time ranged from 20 to 259 s (with a mean of 107 s). |
 Issued from S. Jansen in Helgol. Mar. Res., 2008, 62. [p.252, Fig.1]. Issued from S. Jansen in Helgol. Mar. Res., 2008, 62. [p.252, Fig.1].
Micrographs of Coscinodiscus wailesii, the largest diatom commonly found in the North Sea. a shows an intact cell, while in b the cell was locally damaged with a needle, in response to this treatment the protoplasma concentrates on the side opposite to the point of damage (as does the copepod in fig.3c). |
 Issued from S. Jansen in Helgol. Mar. Res., 2008, 62. [p.252, Fig.2]. Issued from S. Jansen in Helgol. Mar. Res., 2008, 62. [p.252, Fig.2].
Empty Coscinidiscus wailesii cells after grazing by Temora longicornis.
Most of the cells show destructions on two opposed sides of the frustule (as in the figure 3e). |
 Issued from S. Jansen in Helgol. Mar. Res., 2008, 62. [p.254, Fig.4]. Issued from S. Jansen in Helgol. Mar. Res., 2008, 62. [p.254, Fig.4].
Light micoscope micrographs of faecal pellets produced by T. longicornis grazing on a monoculture of Coscinodiscus wailesii from Helgoland Roads (North Sra).
The faecal pellet content consists mainly of brownish unidentifiable matter and only very few pieces of diatom frustules can be identified (arrow in B).
For the author (p.254), analyses of gut or faecal pellet contents can give a qualitative insight in what have been grazed by a copepod, but can rarely provide quantitative results (see Wexels Riser & al., 2003). In cases where copepods do not ingest whole cells, interpretation of stomach or faecal pellet contents may be difficult or even impossible as only a few pieces of evidence of the diatom prey may be found. |
 Issued from : J. Yen & R. Lasley in T. Breithaupt & M. Thiel (eds), Springer. 2010, Ch. 9.3 Ch. [p.184, Fig.9.2]. Representative mating events of the copepods Temora longicornis. Male and female trajectories (from Gulf of Maine). Issued from : J. Yen & R. Lasley in T. Breithaupt & M. Thiel (eds), Springer. 2010, Ch. 9.3 Ch. [p.184, Fig.9.2]. Representative mating events of the copepods Temora longicornis. Male and female trajectories (from Gulf of Maine). |
 Issued from : J. Yen & R. Lasley in T. Breithaupt & M. Thiel (eds), Springer. 2010, Ch. 9.3 Ch. [p.186, Fig.9.3]. Acceleration, lunging during mate tracking (a) and typical mating event (b) for Temora longicornis (from Gulf of Maine) Issued from : J. Yen & R. Lasley in T. Breithaupt & M. Thiel (eds), Springer. 2010, Ch. 9.3 Ch. [p.186, Fig.9.3]. Acceleration, lunging during mate tracking (a) and typical mating event (b) for Temora longicornis (from Gulf of Maine) |
 Issued from : G. B. Deevey in Bull. Bingham Oceanogr. Coll., 1960, 17 (2). [p.66, Fig.5]. Issued from : G. B. Deevey in Bull. Bingham Oceanogr. Coll., 1960, 17 (2). [p.66, Fig.5].
The calculed and observed mean cephalothorax length cycles of female Temora longicornis in Long Island Sound, (E coast U.S.A.) March 1952 to June 1953.
A: Calculated lengths based on mean temperature and Chlorophyll of the month previous to sampling. B: Calculated lengths based on the temperature and Chlorophyll of the day of sampling. |
 Issued from : G. B. Deevey in Bull. Bingham Oceanogr. Coll., 1960, 17 (2). [p.68, Table V]. Issued from : G. B. Deevey in Bull. Bingham Oceanogr. Coll., 1960, 17 (2). [p.68, Table V].
Simple, partial and multiple correlation coefficients. for mean length of cephalothorax with the temperature and Chlorophyll of the day of sampling and averaged for the previous month.
See p.66, Fig.5: The calculed and observed mean cephalothorax length cycles of female Temora longicornis in Long Island Sound, (E coast U.S.A.) March 1952 to June 1953. |
 Issued from : G.A. Deevey in Bull. Bingham Oceanogr. Coll., 1960, 17 (2); [p.76, Table IX]. Issued from : G.A. Deevey in Bull. Bingham Oceanogr. Coll., 1960, 17 (2); [p.76, Table IX].
Correlation coefficients for mean cephalothorax lengths for Temora longicornis with the temperature at sampled and averaged for the previous month from the North Sea (data from Adler & Jespersen, 1920). |
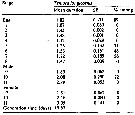
 Issued from: L. Dzierzbicka-Glowacka & al. in Appl. Sci., 2019 , 9, 2039 [p.7, Table 2]. Issued from: L. Dzierzbicka-Glowacka & al. in Appl. Sci., 2019 , 9, 2039 [p.7, Table 2].
Long-term monthly means (± standard deviation) for abundance (In ind. m3) for Temora longicornis in the Gulf of Gdansk (S Baltic Sea).
Sampling conduced during three separate projects spanning almost 14 years from 1998 to 2012.
Water temperature ranges from over 20°C at the surface during summer (maximum usually in August, to - 2°C in February. Due to the brackish character of the Baltic Sea, gulf water salinity stays within the range of 7 to 8. |
 Issued from: L. Dzierzbicka-Glowacka & al. in Appl. Sci., 2019 , 9, 2039 [p.8, Table 3]. Issued from: L. Dzierzbicka-Glowacka & al. in Appl. Sci., 2019 , 9, 2039 [p.8, Table 3].
Long-term monthly means (± standard deviation) for biomass (In mgC. m3) for Temora longicornis in the Gulf of Gdansk (S Baltic Sea).
Sampling conduced during three separate projects spanning almost 14 years from 1998 to 2012.
Water temperature ranges from over 20°C at the surface during summer (maximum usually in August, to - 2°C in February. Due to the brackish character of the Baltic Sea, gulf water salinity stays within the range of 7 to 8. |
 Issued from: L. Dzierzbicka-Glowacka & al. in Appl. Sci., 2019 , 9, 2039 [p.9, Fig.4 2]. Issued from: L. Dzierzbicka-Glowacka & al. in Appl. Sci., 2019 , 9, 2039 [p.9, Fig.4 2].
Interannual (a) abundance and (b) biomass monthly mean and anomaly of Temora longicornis in the Gulf of Gdansk (S Baltic Sea).
Sampling conduced during three separate projects spanning almost 14 years from 1998 to 2012.
Water temperature ranges from over 20°C at the surface during summer (maximum usually in August, to - 2°C in February. Due to the brackish character of the Baltic Sea, gulf water salinity stays within the range of t to 8.
Nota: The secondary production of T. longicornis was lower than for Acartia spp. (4 to 8 mg C/m2 in the summer 2006to 2012), in the first years (1998-2000), the average maximum value in the summer flustuated around 1 mg C/m2); during the second time interval (similarly to Acartia spp, significant variations in production values were observed, reaching ± 2 mg C/m2 in summer 2006, and ± 6 mg C/m2 a year later; in following years, the highrst averazge production rates wesre observed in spring-summer periods; in 2010 it fluctuated between 2 mg C/m2 in spring to 1.8 mg C/m2 in summer, while in 2011 and 2012 noted values were 1.7 mg C/m2 in spring and 2 mg C/m2 in summer.
The largest differences in production rates were recorded between summer and winter (p = 0.01, global R = 0.841). |
 Issued from: L. Dzierzbicka-Glowacka & al. in Appl. Sci., 2019 , 9, 2039 [p.21, Fig. 19]. Issued from: L. Dzierzbicka-Glowacka & al. in Appl. Sci., 2019 , 9, 2039 [p.21, Fig. 19].
Horizontal distribution of average mortality rates of T. longicornis in the Gulf of Gdansk (Baltic Sea, between Poland and Russia).
The bay is strongly influenced by river waters especially the Vistula (which on average brings 1080 m3per s of fresh water. The average depth of the gulf is 50 m with a maximum depth 115 m. Water temperatures ranges from over 20°C at the surface during summer (August), to - 2°C in February. Water stratification is frequent during the warmer months (thermocline), while during the winter gulf waters become well-mixed. Due to the brackish character of the Baltic Sea, the salinity stays within the range of 7 to 8 per 1000. |
 Issued from: L. Dzierzbicka-Glowacka & al. in Appl. Sci., 2019 , 9, 2039 [p.14, Fig. 11]. Issued from: L. Dzierzbicka-Glowacka & al. in Appl. Sci., 2019 , 9, 2039 [p.14, Fig. 11].
Horizontal distribution of average secondary production rates of T. longicornis in the Gulf of Gdansk. |
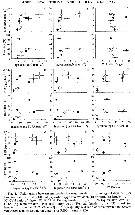
 Issued from : J. Dutz, M. Koski & S.H. Jonzsdottir in Limnol. Oceanogr., 2008, 53 (1). [p.228, Fig.1]. Issued from : J. Dutz, M. Koski & S.H. Jonzsdottir in Limnol. Oceanogr., 2008, 53 (1). [p.228, Fig.1].
(A) Egg production rate (eggs per female per day ± SD) and (B) egg hatching success (%) of Temora longicornis females feeding a cryptoflagellate (RHO: Rhodomonas spp.) or on diatoms 'TW: Thalassiosira weissflogii; TR: T. rotula 1647, 1018; CA: Chaetoceros affinis; LD: Leptocylindricus daniscus; SC: Skeletonema costatum) during the 10-d incubation.
See Table 1: Cell-specific content.
Temora longicornis sampled from the central North Sea and kept in the laboratory for more than 10 generations. Female Individuals isolated, cultured at 14°C in the dark and fed in excess (> 400 µg C /liter)
Nota: Although diatoms were ingested at high rates, they yielded a variable egg production response, ranging from high egg production in four species (Thalassiosira rotula, T. weissflogii, Chaetoceros affinis) to lox egg production in two species (Leptocylindricus danicus, Skeletonema costatum).
Egg hatching rates decreased after 4 days in all diatom treatments, irrespective of the egg production rate and without any relationship to diatom aldehyde production. Similarly, no evidence was found that diatoms are per se nutritionally inferior to nondiatom food.
The authors suggest that hatching^specific nutritional deficiences might be induced by incomplete digestion following from the low gut passage time of diatoms, as indicated by a strong correlation between egg viability and fecal pellet production. |
 Issued from : J. Dutz, M. Koski & S.H. Jonzsdottir in Limnol. Oceanogr., 2008, 53 (1). [p.226, Table 1]. Issued from : J. Dutz, M. Koski & S.H. Jonzsdottir in Limnol. Oceanogr., 2008, 53 (1). [p.226, Table 1].
The algae were kept in exponential growth phase and constant density by daily monitoring of cell concentration and dilution of the culture.
The strains were grown in 1-2-liter batch cultures at 18°C with a 16 : 8 h light : dark cycle at an irradiance of 100 µmol photons/m2/s in F/2 (+Si) media |
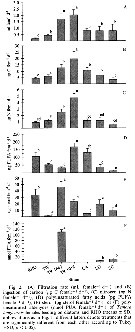 Issued from : J. Dutz, M. Koski & S.H. Jonzsdottir in Limnol. Oceanogr., 2008, 53 (1). [p.229, Fig.2]. Issued from : J. Dutz, M. Koski & S.H. Jonzsdottir in Limnol. Oceanogr., 2008, 53 (1). [p.229, Fig.2].
Filtration rate for Temora longicornis female vs Cell-specific contents of phytoplankton strains. |
 Issued from : J. Dutz, M. Koski & S.H. Jonzsdottir in Limnol. Oceanogr., 2008, 53 (1). [p.230, Table 2]. Issued from : J. Dutz, M. Koski & S.H. Jonzsdottir in Limnol. Oceanogr., 2008, 53 (1). [p.230, Table 2].
Rfficiency of egg production in terms of carbon and nitrogen for Temora longicornis, ratio of defecated to ingested volume, and gut passage time calcul from pellet production rates or pellet production rates normalized to a pellet volume. |
 Issued from : J. Dutz, M. Koski & S.H. Jonzsdottir in Limnol. Oceanogr., 2008, 53 (1). [p.231, Fig.3]. Issued from : J. Dutz, M. Koski & S.H. Jonzsdottir in Limnol. Oceanogr., 2008, 53 (1). [p.231, Fig.3].
Number, volume and C total volume of fecal pellets produced by T. longicornis females feeding on diatoms or Rgodomonas spp. |
 Issued from : J. Dutz, M. Koski & S.H. Jonzsdottir in Limnol. Oceanogr., 2008, 53 (1). [p.232, Fig.4]. Issued from : J. Dutz, M. Koski & S.H. Jonzsdottir in Limnol. Oceanogr., 2008, 53 (1). [p.232, Fig.4].
Relationship between egg production or hatching success of algae ingested by T. longicornis females feeding on diatoms or Rgodomonas sp. |
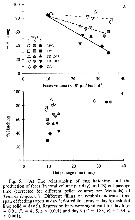 Issued from : J. Dutz, M. Koski & S.H. Jonzsdottir in Limnol. Oceanogr., 2008, 53 (1). [p.233, Fig.5]. Issued from : J. Dutz, M. Koski & S.H. Jonzsdottir in Limnol. Oceanogr., 2008, 53 (1). [p.233, Fig.5].
The relationship off egg hatching and the production of feces and gut passage yime of T. longicornis. |
 Issued from : W.C.M. Klein Breteler, N. Schogt & J. van der Meer in J. Plankton Res., 1994, 16 (8). [p.1045, Table I]. Issued from : W.C.M. Klein Breteler, N. Schogt & J. van der Meer in J. Plankton Res., 1994, 16 (8). [p.1045, Table I].
The mean duration (days), its standar error (SE) and the among-cultures variance (% of the total variance) of the life stages Temora longicornis cultured at 15°C and excess food.
Negative values of among-cultures variance are indicated by 0.
Nauplii (1-6) and copepodites (7-11).
The summed duration of females (generation time.br>
Nota: individuals from the North Sea (Texel, Netherlands Institute for Sea Research).
The brood was raised to maturity at excess food from continuous cultures of Rhodomonas sp. (4.8-8.5 µm ESD) and Isochrysis galbana (3.6-7.0 µm ESD). The heterotrophic dinoflagellate Oxyrrhis marina (10.4-19.0 µm) lived together with the copepods in the culture tank. |
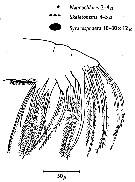
 Issued from : C. Halsband-Lenk, H.-J. Hirche & F. Carlotti in J. Exp. Mar. Biol. Ecol., 2002, 271. [p.124, Fig.1, b]. Issued from : C. Halsband-Lenk, H.-J. Hirche & F. Carlotti in J. Exp. Mar. Biol. Ecol., 2002, 271. [p.124, Fig.1, b].
Habit (after Rose, 1957; modified), range of prosome length in situ (Halsband-Lenk, partly unpublished) and geographical distribution in the Atlantic and adjacent seas of Temora longicornis and Temora stylifera (b).
The target is the temperature impact on reproduction and development of two congener copepod pairs inhabiting different biogeographic regions to their geographic distribution patterns (from two stations in the North Sea, Helgoland Island and the Mediterranean Sea, Villefrance -sur-Mer).
Nota: The differences of thermal tolerance between these congeners confirmed the classification as a cold-temperate (T. longicornis and a warm-temperate species (T. stylifera and hence their geographic distribution.
T longicornis tolerated the whole temperature range found in the North Sea as expected from its perennial occurrence rgere. The fact that it could not withstand temperatures > 22.5°C, expains its absence from warmer environments and its restriction to the northern hemisphere with a southern boundary coinciding with the 20°C isotherm of the Atlantic in summer (Lindau, 2001).
Temora stylifera, in contrast, was the only species that could survive temperaturs > 25°C, at least in the adult stage, and is accordingly distributed in lower latitudes. Limitation to the north corresponded to the 10°C isotherm (Lindau, 2001), representing probably the northern margin of reproductive success, while its occurrence in the English Channel seems more likely a result of advection. However, the thermal optimum of the female thermal tolerance and the reproductive thermal response at 10-15°C (see Table 5) seemed at first sight surprisingly low, since T. stylifera is considered as a warm-temperate species. On the other hand, Abou-Debs & Nival (1983) also found an optimum of the re^productive thermal response at 16°C and declining egg production rates towards the temperature extremes of their Mediterranean habitat (13 and 23°C). In fact, T. stylifera reproduces mainly during autumnal cooling in the western Mediterranean (Halsband-Lenk & al., 2001). Similar to female thermal tolerance and reproductive thermal response, development of some instars was favoured at 15°C. At 10°C, no development was possible in culture. Assuming that population development takes place in autumn following the reproduction peak, the preference of a low autumnal temperature matched the species' life strategy in situ. Although the limits of temperature tolerance would allow survival and development at higher temperatures, T. stylifera tended to prefer intermediate temperatures in the Mediterranean, possibly to avoid resource competition with other copepods (C. Razouls, 1974, up to date mainly with the more abundant species as Centropages typicus, before the climatic change, and the abundance of Clausocalanus spp.), consequently, thermal tolerance was not necessarily correlated with the optimum.
In the aurthors' conclusion, in a given environment, interactions between species lead to extinction of less adapted species and dominance of better adapted ones, resulting in a specific spatial and temporal species composition. A shift in temperature, either latitudinal or a seasonal scale, will modify these interactions and result in a changed combination of species, e.g. as result of climatic changes like global warming. The impact of such long-term changes on the zooplankton communities requires more information on how populations respond to critical temperatures, both from an ecological and physiological approach. [therefore the knowledge of the genome and the variability intraspecific, and probably existence of geographic stairs. CR]. |
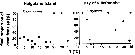 Issued from : C. Halsband-Lenk, H.-J. Hirche & F. Carlotti in J. Exp. Mar. Biol. Ecol., 2002, 271. [p.127, Fig.3, c, e]. Issued from : C. Halsband-Lenk, H.-J. Hirche & F. Carlotti in J. Exp. Mar. Biol. Ecol., 2002, 271. [p.127, Fig.3, c, e].
Total mortality of adult females after 5 days of incubation at different temperatures.
Nota: Rare in the W Mediterranean Sea, introduces by the superficial current from the Atlantic through Gibraltar Strait, inversely to T. stylifera well established. |
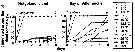 Issued from : C. Halsband-Lenk, H.-J. Hirche & F. Carlotti in J. Exp. Mar. Biol. Ecol., 2002, 271. [p.128, Fig.4, c, e]. Issued from : C. Halsband-Lenk, H.-J. Hirche & F. Carlotti in J. Exp. Mar. Biol. Ecol., 2002, 271. [p.128, Fig.4, c, e].
Cumulative proportions of dead females incubated 5 days at different temperatures. |
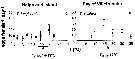 Issued from : C. Halsband-Lenk, H.-J. Hirche & F. Carlotti in J. Exp. Mar. Biol. Ecol., 2002, 271. [p.129, Fig.5, c, e]. Issued from : C. Halsband-Lenk, H.-J. Hirche & F. Carlotti in J. Exp. Mar. Biol. Ecol., 2002, 271. [p.129, Fig.5, c, e].
Temperature impact on egg production rates. |
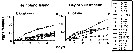 Issued from : C. Halsband-Lenk, H.-J. Hirche & F. Carlotti in J. Exp. Mar. Biol. Ecol., 2002, 271. [p.130, Fig.6, c, e]. Issued from : C. Halsband-Lenk, H.-J. Hirche & F. Carlotti in J. Exp. Mar. Biol. Ecol., 2002, 271. [p.130, Fig.6, c, e].
Cumulative egg production during 5 days at different temperatures. |
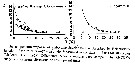 Issued from : C. Halsband-Lenk, H.-J. Hirche & F. Carlotti in J. Exp. Mar. Biol. Ecol., 2002, 271. [p.133, Fig. 9, c, e]. Issued from : C. Halsband-Lenk, H.-J. Hirche & F. Carlotti in J. Exp. Mar. Biol. Ecol., 2002, 271. [p.133, Fig. 9, c, e].
Embryonic development times fitted with Belehradek curves.
n.d. no development; EP = egg production. T = temperature °C, D = days, a = slope of the response, alpha = temperature scale position of the response.
Nota: Eggs obtained from freshly captured females incubated 24 h in filtered seawater at 15°C. Embryonic development times were determined from 2 to 30°C in summer 1999 for all North Sea species.. Complementary results for eggs of T. longicornis, incubated from 0 to 16°C in March and June 1996 were included. Development times in the Mediterranean were recorded from 2 to 30°C in June 1998, March and May 1999 and in November 1998 for T. stylifera.
In T. stylifera, survival of eggs increased linearly with temperature from 52 % at 10°C to 90 % at 20 and 25°C. |
 Issued from : C. Halsband-Lenk, H.-J. Hirche & F. Carlotti in J. Exp. Mar. Biol. Ecol., 2002, 271. [p.134, Table 2]. Issued from : C. Halsband-Lenk, H.-J. Hirche & F. Carlotti in J. Exp. Mar. Biol. Ecol., 2002, 271. [p.134, Table 2].
Belehradek functions of embryonic development at different temperatures. |
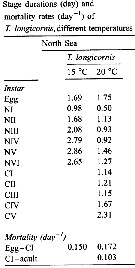 Issued from : C. Halsband-Lenk, H.-J. Hirche & F. Carlotti in J. Exp. Mar. Biol. Ecol., 2002, 271. [p.139, Table 3]. Issued from : C. Halsband-Lenk, H.-J. Hirche & F. Carlotti in J. Exp. Mar. Biol. Ecol., 2002, 271. [p.139, Table 3].
Stage durations (day) and mortality rates (day-1) of Temora longicornis at different temperatures in the North Sea.
Nota: Stage durations of nauplii were slightly shorter in T. longicornis than in T. stylifera at 15 and 20°C. Development times of T. longicornis decreased from 15 to 20°C, while NIV, NV and CI of T. stylifera developed more quickly at 15°C than at 20°C. At 10°C, no development was observed beyond NI in T. stylifera. Relative development times of both congeners were equiproportional (see in Table 6).
Mortality rates of T. longicornis were 0.150 and 0.172 day-1 for nauplii at 15 and 20°C, respectively, and 0.103 day-1 for copepodites at 20°C. T. stylifera had very high death rates in nauplii at 20°C (0.339 day-1 prior collapse of the culture and were considered as artefact. At 15°C, nauplii mortality was 0.092 day)-1. Negative mortality was observed in copepodites, due to the sampling technique, i.e. a misrepresentation of specimens in the subsamples, which is attributed to inefficient mixing of the culture before sampling. Compare with T. stylifera (Table 3, Ts) for the same authors. |
 Issued from : C. Halsband-Lenk, H.-J. Hirche & F. Carlotti in J. Exp. Mar. Biol. Ecol., 2002, 271. [p.140, Table 4]. Issued from : C. Halsband-Lenk, H.-J. Hirche & F. Carlotti in J. Exp. Mar. Biol. Ecol., 2002, 271. [p.140, Table 4].
Egg production rates (EPR) and development times of Temora longicornis.
NS = North Sea; M = Mediterranean; A = Atlantic.
I.g. = Isochrysis galbana; H.e.= Hymenomonas elongata; T.s. = Tetraselmis suecica; D.t. = Dunalliella tertiolecta; T.w. = Thalassiosira weissflogii; T.r. = Thalassiosira rotula; R.b. = Rhodomonas baltica; R.sp. = Rhodomonas sp.; O.m. = Oxyrrhis marina. |
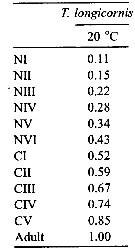 Issued from : C. Halsband-Lenk, H.-J. Hirche & F. Carlotti in J. Exp. Mar. Biol. Ecol., 2002, 271. [p.144, Table 6]. Issued from : C. Halsband-Lenk, H.-J. Hirche & F. Carlotti in J. Exp. Mar. Biol. Ecol., 2002, 271. [p.144, Table 6].
Proportion of total development time (egg-laying to adult) spent in each stage (cumulative median development time/generation time in Temora longicornis. |
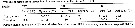 Issued from : C. Halsband-Lenk, H.-J. Hirche & F. Carlotti in J. Exp. Mar. Biol. Ecol., 2002, 271. [p.143, Table 5]. Issued from : C. Halsband-Lenk, H.-J. Hirche & F. Carlotti in J. Exp. Mar. Biol. Ecol., 2002, 271. [p.143, Table 5].
Temora longicornis and Temora stylifera comparison: Synthesis of results from incubation in a temperature gradient from 0 to 35°C.
FTT = female thermal tolerance. RTR = reproductive thermal response. ETR = embryonic thermal response.
The two Temora, from the North Sea and the Mediterranean Sea considered, showed quite different female thermal tolerance. T. stylifera females stayed alive and maintained reproduction up to 30°C, whereas T. longicornis could not withstand temperatures above 22°5. Optimal survival of T. stylifera occurred at 10 and 15°C, while 2 and 5°C were lethal. The mortality observed at 20°C can be considered as suspect. T. longicornis showed low mortality between 0 and 22°5 without any clear optimum.
The reproductive thermal response (RTR) also differed between the Temora congeners. Egg production of T. longicornis ranged between 5 and 10 eggs female-1 day-1 from 0 to 15°C, peaked at 20°C with 18.8 eggs female-1 day-1 and decreased sharply at 22°5 (see in fig.6c).
In contrast, T. stylifera produced no eggs below 8°C; optimum occurred at 15°C with 25.7 eggs female-1 day-1, at higher temperatures the egg production rates declined (see in fig. 6e).
The embryonic thermal response (ETR) showed different tolerance limits for T. longicornis (0-22°C) and T. stylfera (10-28°C).
The Belehradek function of T. stylifera had a similar curvilinearity as that of T. longicornis in March, but was displaced towards higher temperatures (see in fig. 9, c, e). Cold temperatures inhibited development of T. stylifera embryos. No nauplii hatched below 10°C and the proportion of viable eggs increased with temperature from 10 to 20°C and slightly decreased at 25°C. In contrast, hatching success of T. longicornis was high at all temperatuirs between 2 and 22.5°C, but no eggs developed beyond this limit.
A seasonal comparison of embryonic thermal response was available for T. longicornis (see in fig.9, c). Eggs developed relatively quickly at low temperatures in summer, but slower in winter; In March 1996, embryos needed more time to hatch at a given temperature than in June 1996 (p <0.10001), and than from June to September 1999 (p <0.0001). The difference was less significant between June 1996 and June to September 1999 (p <0.01).
Hatching success was maximum or very high at any temperature situation in T. longicornis. In T. stylifera, survival of eggs increased linearly with temperature from 52 % at 10°C to 90 % at 20 and 25°C.
In the Temora species, naupliar durations were similar to copepodite durations, except when mortality stopped development.
The thermal tolerance ranges were rather similar in all parameters considered. However, in some cases, a slight decrease of tolerance was observed in subsequent life phases, i.e. in T. stylifera whose temperature range was wider for female survival than for reproduction and even narrower for embryonic development.
Heat death occurred in T. longicornis, except T. stylifera, at 30°C or below, indicating that this temperature represents a threshold beyond which a selective measure is necessary to ascertain survival, e.g. the production of heat shock proteins reported for various marine organisms (Hofmann, 1999). Depression of development rate (i.e. increasing development time) as an expression of physiological inefficiency at the upper end of a species' thermal range (repoerted for embryos of Acartia clausi, Temora stylifera, Centropages chierchiae; Bernard, 1971; Landry, 1975). The authors observede prolonged embryonic duration at 25°C or above, both in the North Sea (Centropages hamatus) and in the Mediterranean (Centropages typicus). |
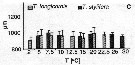 Issued from : C. Halsband-Lenk, H.-J. Hirche & F. Carlotti in J. Exp. Mar. Biol. Ecol., 2002, 271. [p.132, Fig.8]. Issued from : C. Halsband-Lenk, H.-J. Hirche & F. Carlotti in J. Exp. Mar. Biol. Ecol., 2002, 271. [p.132, Fig.8].
Prosome length of females incubated in experiments. vertical bars indicate standard deviation.
Nota: Prosome length of females used in experiments showed little variability within species in comparison to the range of prosome length compiled from different seasons and locations see in fig. 1 for the same authors).
Temora longicornis and Temora stylifera females had a similar mean prosome length of 951.1 ±71.3 and 965.7 ±47.9 µm, respectively.
The size range of T. longicornis from 774.3 to 1212.6 µm (mean: 951.1 ±71.3 µm) was broader than that of T. stylifera with 876.8-1073.7 µm (mean: 9565.7 ±47.9 µm).
Size differences between experiments were not significant in a given population. |
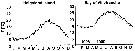
Plankton collected at the sampling sites ''Kabeltonne'' (54°11'03'' N, 7°54'00'' E) and ''Point B'' (43°41'10'' N, 7°19'00'' E). These stations are of a similar longitude position, but represent two different climatic regions. |
 Issued from : S. Ban, C. Burns, J. Castel, Y. Chaudron & al. in Mar. Ecol. Prog. Ser., 1997, 157. [p.289, Table 1]. Issued from : S. Ban, C. Burns, J. Castel, Y. Chaudron & al. in Mar. Ecol. Prog. Ser., 1997, 157. [p.289, Table 1].
Synopsis of feeding/reproduction experiments. A total of 17 diatom and 16 copepod species, representative of a variety of worldwide temperate and subarctic environments (E: estuarine, C: coastal ocean), were screened.
Data for fecundity and hatching success are average values measured at the start and end of the inciubations in a minimum of 3 replicate batches, showing the variation in time of the effects of diatoms on copepod reproduction.
Level of significance of the diatom effect between treatments and controls (e.g. non-diatom diets) in categories I to III was p < 0.01. No.. rank (for comparison with Table 2, p.290).
For the signification of the categories I to IV (fecundity vs. Hatching success vs. Duration of experiment days-1): See Calanus finmarchicus.
List of the 12 marine or estuarine species studied (fresh water excluded. CR): Acartia clausi, A. grani, A. steueri, A. tonsa, Calanus finmarchicus, C. helgolandicus, C. pacificus, Centropages hamatus, C. typicus, Eurytemora affinis, Temora longicornis, T. stylifera. |
 Issued from : S. Ban, C. Burns, J. Castel, Y. Chaudron & al. in Mar. Ecol. Prog. Ser., 1997, 157. [p.290, Table 2]. Issued from : S. Ban, C. Burns, J. Castel, Y. Chaudron & al. in Mar. Ecol. Prog. Ser., 1997, 157. [p.290, Table 2].
Combinations of copepod and non-diatom diets in controls in concentrations ranging from 104 to 105 cells ml-1. Data for fecundity and hatching success are average values measured at the start and end of incubation in a minimum of 3 replicate batches.
N.A: natural assemblages of phytoplankton at time of incubation were for Nos 15,16, >50% diatoms.
Nos 15 and 16: In Category I. |
| | | | Loc: | | | ? Angola, ? Congo, off Mauritania, Cap Ghir (Morocco), Portugal, Mondego estuary, off Coruña, Vigo, Santander, Bilbao & Urdaibai estuaries, Arcachon Bay, Gironde estuary, Bay of Biscay, La Pallice roadstead, off Gironde estuary, Belon estuary, N Brazil (Curuça estuary), G. of Mexico, Stony Brook harbor, Delaware Bay, New York Bight, Chesapeake Bay, Narragansett Bay, Long Island Sound, Woods Hole, Georges Bank,Massachusetts Bay, G. of Maine, Bay of Fundy, Passamaqupddy Bay, off SE & SW Nova Scotia, Northumberland Strait, Bedford Basin, Halifax Harbor, Northumberland Strait, Bay of Shédiac, G. of St. Lawrence, Bradelle Bank, Baie des Chaleurs (Shippegan Channel), Strait of Belle Isle, off E Nova Scotia, Bedford Basin, off Newfoundland, Strait of Frozen, Labrador (coast), Godthaab Fjord (W Greenland), SW Greenland (Nuuk), Fram Strait, S Greenland, Iceland, Ireland, off SW Ireland, Lough Hyne, Galway Bay, Bristol Channel, Faroe, Svalbard, Wyville Thomson Ridge, Norwegian Sea (Weather ship M: 66°N, 02°W), Norway (south-north, Bergen, Malangen fjord, Kosterfjorden, Nordvestbanken, Raunefjorden, Hakøybotn, Barents Sea, Pechora Sea, White Sea, Chupa Inlet, Yamal (W coast), Baidara Bay, Roadstead of Brest, English Channel, Roscoff, Plymouth, Southampton, Pas de Calais, Oosterschelde (Netherlands), North Sea, Texel, Helgoland Roads, Dogger Bank, Skagerrak, Gullmar Fjord, Kattegat, Oosterschelde estuary, Lake Grevelingen, Elbe (estuaire), Baie de Kiel, off Texel, Gulf of Mecklenburger, Baltic Sea,Gulf of Gdansk, Bornholm Basin, G. of Riga: Pärnu Bay, Ibero-moroccan Bay, off W Tangier, Medit. (M'Diq, Alboran Sea, Habibas Is., Sidi Fredj coast, Algiers, W Basin (rare), Marseille, Genoa, Strait of Sicily, Gulf of Taranto, Taranto Harbour, G. of Gabès, Sfax, Adriatic Sea, Venice, Po delta, G. of Trieste, N Aegean Sea, Bardawill Lagoon), ? Indian (Bay of Bengal, Mozambique, Mombasa) (in Thompson, 1900 c), ? [ G. of Thailand,Singapore, Philippines, Viet-Nam (Cauda Bay), China Seas, Japan ] | | | | N: | 348 (SE Pacif.: 1, S Atlant.: 3; Arctic: 25; N Atlant.: 183; Medit.: 143; Black Sea: 2; ? Singapore) | | | | Lg.: | | | (45) F: 1,5-1; M: 1,35-1; (47) F: 1,5-1; M: 1,35-1; (54) F: 1,51-1,06; M: 1,21-1,02; (65) F: 1,5; M : ± 1,5; (75) F: 1,29-0,98; M: 1,39-1,04; (327) F: 1,66-1,01; M: 1,56-1,04; (354) F: 1,54-1,2; M: 1,65-1,1; (449) F: 1,6-1,46; M: 1,5-1,4; (579) F: 1,31; 1,17; (796) F: 1,03-0,8; M: 1,12-0,82; (1123) F: 0,682-1,643; M: 0,634-1,285; (1220) F: 0,9-1,5; M: 1,0-1,5: (1302) F: 0,80-1,17; M: 0,76-1,07; {F: 0,682-1,660; M: 0,630-1,650} | | | | Rem.: | Les localisations dans le Pacifique NW in Marukawa (1921), C.B. Wilson (1950) et Rose (1956) semblent mises en doute. Certaines confusions ont été possibles entre cette espèce et T. turbinata (cf. Corral Estrada, 1970, p.171), mais les deux derniers auteurs précités ont noté ces espèces dans les mêmes pêches. La faune du Japon (1997) ne mentionne plus cette espèce dans les eaux japonaises.
La présence de l'espèce en Indien doit être confirmée.
Voir aussi les remarques en anglais | | | Dernière mise à jour : 25/10/2022 | |
|
|
 Toute utilisation de ce site pour une publication sera mentionnée avec la référence suivante : Toute utilisation de ce site pour une publication sera mentionnée avec la référence suivante :
Razouls C., Desreumaux N., Kouwenberg J. et de Bovée F., 2005-2026. - Biodiversité des Copépodes planctoniques marins (morphologie, répartition géographique et données biologiques). Sorbonne Université, CNRS. Disponible sur http://copepodes.obs-banyuls.fr [Accédé le 02 juin 2026] © copyright 2005-2026 Sorbonne Université, CNRS
|
|
|
|

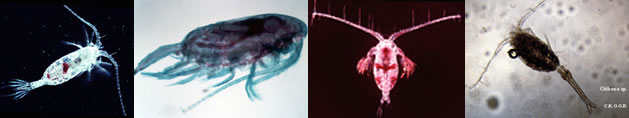


;)
;)
;)
;)
;)
;)
;)
;)
;)
;)
;)
;)
;)
;)

;)
;)
;)
;)
;)
;)
;)
;)
;)
;)
;)
;)
;)
;)
;)
;)
;)
;)
;)
;)
;)
;)
;)
;)
;)
;)
;)
;)
;)
;)
;)
;)
;)
;)
;)
;)
;)
;)
;)
;)
;)
;)
;)
;)
;)
;)
;)
;)
;)
;)
;)
;)
;)
;)
;)
;)
;)
;)
;)
;)
;)
;)
;)
;)
;)
