|
|
 |
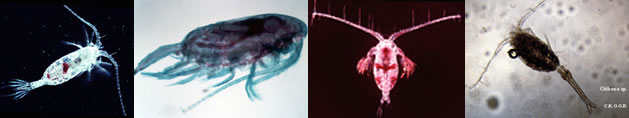
Fiche d'espèce de Copépode |
|
|
Calanoida ( Ordre ) |
|
|
|
Calanoidea ( Superfamille ) |
|
|
|
Paracalanidae ( Famille ) |
|
|
|
Paracalanus ( Genre ) |
|
|
| |
Paracalanus sp. Liang & Uye, 1996 (F,M, juv.) | |
| | | | | | | Ref.: | | | Liang & Uye, 1996 a (p.219, Rem.: morphologically more like Paracalanus quasimodo after Hiromi, pers. comm.) | | | | Ref. compl.: | | | Liang & Uye, 1996 a (p.219, figs.1, 2, 3, 4, 5, 6, 7, 8, 9, 10, 11, Table 1, 2; population dynamics, production) | | | | NZ: | 1 | | |
|
Carte de distribution de Paracalanus sp. par zones géographiques
|
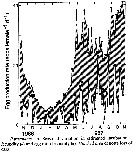
| | | 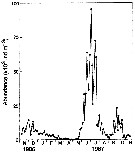 Issued from : D. Liang & S. Uye in Mar. Biol., 1996, 127. [p.220, Fig.1]. Issued from : D. Liang & S. Uye in Mar. Biol., 1996, 127. [p.220, Fig.1].
Seasonal variation in abundance of Paracalanus sp., older than nauplii III. in Fukuyama Harbor, Inland Sea, Japan).
Nota: Sampling from 7 November 1986 to 8 November 1987.
Copepods collected by oblique hauls by plankton net (62 µm mesh aperture) from the bottom (depth: 7-8 m) to the surface near nighttime high tide.
Nauplii I and II, too small excluded for analysis.
Carapace lengths of nauplii and prosome lengths of copepodites and adults. |
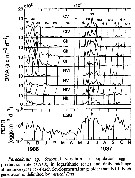
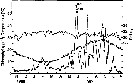 Issued from : D. Liang, S. Uye & T. Onbé in Mar. Biol., 1996, 124. [p.529, Fig.2]. Issued from : D. Liang, S. Uye & T. Onbé in Mar. Biol., 1996, 124. [p.529, Fig.2].
Seasonal variations in temperature (open circles), salinity (filled triangles) and chlorophyll a concentration (filled circles) in Fukuyama Harbor (Inland Sea, Japan) from November 1986 to November 1987. |
 Issued from : D. Liang & S. Uye in Mar. Biol., 1996, 127. [p.223, Fig.4]. Issued from : D. Liang & S. Uye in Mar. Biol., 1996, 127. [p.223, Fig.4].
Seasonal variation in body size of Paracalanus sp. in Fukuyama Harbor, Inland Sea, Japan). |
 Issued from : D. Liang & S. Uye in Mar. Biol., 1996, 127. [p.223, Table 2]. Paracalanus sp. in Fukuyama Harbor (Inland Sea, Japan). Issued from : D. Liang & S. Uye in Mar. Biol., 1996, 127. [p.223, Table 2]. Paracalanus sp. in Fukuyama Harbor (Inland Sea, Japan).
Regression equations describing the relationship between body size and water temperature (T, °C), CL: carapace length (µm), PL: prosome length (µm).
Nota: Mean body size of each developmental stage was inversely related to temperature at the time of sampling, and their relationships were described by Belehradek's functions. |
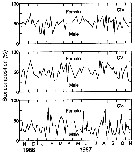
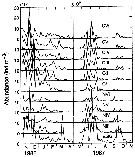 Issued from : D. Liang & S. Uye in Mar. Biol., 1996, 127. [p.221, Fig.2]. Paracalanus sp. in Fukuyama Harbor (Inland Sea, Japan). Issued from : D. Liang & S. Uye in Mar. Biol., 1996, 127. [p.221, Fig.2]. Paracalanus sp. in Fukuyama Harbor (Inland Sea, Japan).
Seasonal variation in stage-specific abundance. |
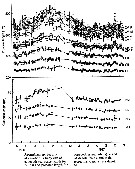
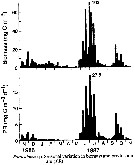
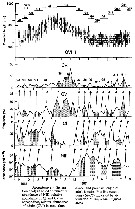 Issued from : D. Liang & S. Uye in Mar. Biol., 1996, 127. [p.222, Fig.3]. Paracalanus sp. in Fukuyama Harbor (Inland Sea, Japan). Issued from : D. Liang & S. Uye in Mar. Biol., 1996, 127. [p.222, Fig.3]. Paracalanus sp. in Fukuyama Harbor (Inland Sea, Japan).
Generation analysis based on numerical abundance of different developmental stages relative to the total abundance, and prosome length of adult females. Possible number of generations in the year (G1-G14) indicated by alternation of stippled/nonstippled areas. |
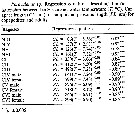
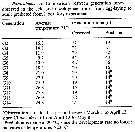 Issued from : D. Liang & S. Uye in Mar. Biol., 1996, 127. [p.221, Table 1]. Paracalanus sp. in Fukuyama Harbor (Inland Sea, Japan). Issued from : D. Liang & S. Uye in Mar. Biol., 1996, 127. [p.221, Table 1]. Paracalanus sp. in Fukuyama Harbor (Inland Sea, Japan).
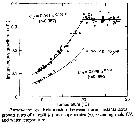
Comparison between generation times observed in the field and development times from egg-laying to adult predicted from laboratory experiments (Uye, 19921, investigated the temperature-dependent postembryonic development under excess food conditions).
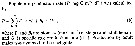
Nota: The development time from egg to adult (DE-CVI at temperatures < 20°C can be expressed by the Belehradek equation:
DE-CVI = 4210 (T + 2.2)-1.85
Comparisons are made between the generation times observed in the field and the development times predicted from the mean water temperature during each generation period. They were roughly in agreement with each other. |
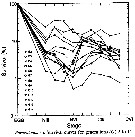 Issued from : D. Liang & S. Uye in Mar. Biol., 1996, 127. [p.225, Fig.8]. Paracalanus sp. in Fukuyama Harbor (Inland Sea, Japan). Issued from : D. Liang & S. Uye in Mar. Biol., 1996, 127. [p.225, Fig.8]. Paracalanus sp. in Fukuyama Harbor (Inland Sea, Japan).
Survival curves for generations G1 to G14.
Nota: A survival curve from egg to successive stages older than NIII for each generation was obtained from the mean egg production rate and the mean daily midstage abundance of a given generation.
Except for generations G1 and G15, generation showed a very irregular survival curve.
The mortality was always high between egg and NIII, ranging from 76.1% (G11) to 98.4% (G6) (overall mean: 92.9%). It is variable, but lower beyond NIII.
In many generations, negative mortality was calculated in early copepodite stages, which indicates that the stage duration, may differ from that of the laboratory-kept population. |
 Issued from : D. Liang & S. Uye in Mar. Biol., 1996, 127. [p.224, Fig.5]. Paracalanus sp. in Fukuyama Harbor (Inland Sea, Japan). Issued from : D. Liang & S. Uye in Mar. Biol., 1996, 127. [p.224, Fig.5]. Paracalanus sp. in Fukuyama Harbor (Inland Sea, Japan).
Seasonal variation in sex composition in copepodites IV, V, and adults (CVI).
Nota: The sexual composition in Copepodites IV, V, and VI (adults) varied with the season
There were no significant differences in sexual composition between CIV and CV, percentage of males being 50.7 ± 13.2 and 52.14% (mean ± SD), respectively.
In the adult stage, females outnumbered males (male: 31.5 ± 17.1%). Like generally in the copepods, the life span of males was often much shorter than that of females. |
 Issued from : D. Liang & S. Uye in Mar. Biol., 1996, 127. [p.224, Fig.7]. Paracalanus sp. in Fukuyama Harbor (Inland Sea, Japan). Issued from : D. Liang & S. Uye in Mar. Biol., 1996, 127. [p.224, Fig.7]. Paracalanus sp. in Fukuyama Harbor (Inland Sea, Japan).
Seasonal variation in population egg production rate and daily midstage abundance (DMA) of each developmental stage (older than NIII). Each generation is delimited by vertical line.
Nota: Assuming steady state of the population near each sampling date, the number passing through the midpoint of each stage per day can be calculated by:
DMAi = Ni / Di.
where DMAi is daily midstage abundance of stage i (indiv. m3 d-1, Ni is abundance of stage 1 (indiv. m3) and Di is duration of stage i (see Fager, 1973). This calculation was performed on each sampling date. |
 Issued from : D. Liang & S. Uye in Mar. Biol., 1996, 127. [p.224, Fig.6]. Paracalanus sp. in Fukuyama Harbor (Inland Sea, Japan). Issued from : D. Liang & S. Uye in Mar. Biol., 1996, 127. [p.224, Fig.6]. Paracalanus sp. in Fukuyama Harbor (Inland Sea, Japan).
Seasonal variation in estimated incubation fecundity (black point) and egg-ratio fecundity (black square).
Hatched area denotes loss of eggs.
|
 Issued from : D. Liang & S. Uye in Mar. Biol., 1996, 127. [p.220]. Issued from : D. Liang & S. Uye in Mar. Biol., 1996, 127. [p.220].
Fecundity estimations: specific egg production rate correlated with water temperature, chlorophyll a concentration, abundance of eggs and females, and egg development time. |
 Issued from : D. Liang & S. Uye in Mar. Biol., 1996, 127. [p.225, Fig.9]. Paracalanus sp. in Fukuyama Harbor (Inland Sea, Japan). Issued from : D. Liang & S. Uye in Mar. Biol., 1996, 127. [p.225, Fig.9]. Paracalanus sp. in Fukuyama Harbor (Inland Sea, Japan).
Relationship between mean instantaneous growth rates (empty circle) and copepodites (black circle), excluding male CV, and water temperature. gN : nauplii; gC : copepodites (excluding CV males, since their body size increment from CV to adult was very small).
At temperatures > 20°C, the mean growth rates were 0.19 per day for nauplii and 0.33 per day for copepodites. |
 Issued from : D. Liang & S. Uye in Mar. Biol., 1996, 127. [p.220]. Issued from : D. Liang & S. Uye in Mar. Biol., 1996, 127. [p.220].
Instantaneous growth rate for individual stage. |
 Issued from : D. Liang & S. Uye in Mar. Biol., 1996, 127. [p.225, Fig.10]. Paracalanus sp. in Fukuyama Harbor (Inland Sea, Japan). Issued from : D. Liang & S. Uye in Mar. Biol., 1996, 127. [p.225, Fig.10]. Paracalanus sp. in Fukuyama Harbor (Inland Sea, Japan).
Seasonal variation in biomass and production rate (PR).
Nota: A very large peak of biomass (103 mg m3) was observed in June/July, and a small peak in September/October. It was low in April/May
The production rate showed a similar seasonal pattern to that of biomass. The maximum production rate of 27.8 mg per m3 per day was recorded on 4 July.
Annual integration of the production rate was 734 mg C per m3 per year, or 5.5 g C per m2 per year.
The contribution of nauplii to the population production was minor (5.2%); the production was primarily attributed to copepodites (65.8%) and adult females as eggs (29.0%). |
 Issued from : D. Liang & S. Uye in Mar. Biol., 1996, 127. [p.220]. Issued from : D. Liang & S. Uye in Mar. Biol., 1996, 127. [p.220].
Population production rate (P, mg m-3 d-1 .
Production by adult males was assumed to be negligible. |
| | | | Loc: | | | Japan (Inland Sea, Fukuyama Harbor) | | | | N: | 1 | | | | Lg.: | | | [1256]* F: 0,600-0,900 [F: 0,650-0,850]
* Prosome length vs seasonal period (1986-1987) | | | | Rem.: | Dominant species with Centropages abdominalis and Acartia omorii in Fukuyama Harbor (see these species studied by Liang, Uye & Onbé, 1996, and Liang & Uye, 1996). | | | Dernière mise à jour : 11/01/2021 |
|
|
 Toute utilisation de ce site pour une publication sera mentionnée avec la référence suivante : Toute utilisation de ce site pour une publication sera mentionnée avec la référence suivante :
Razouls C., Desreumaux N., Kouwenberg J. et de Bovée F., 2005-2026. - Biodiversité des Copépodes planctoniques marins (morphologie, répartition géographique et données biologiques). Sorbonne Université, CNRS. Disponible sur http://copepodes.obs-banyuls.fr [Accédé le 18 juin 2026] © copyright 2005-2026 Sorbonne Université, CNRS
|
|
|
|


;)
;)
;)
;)
;)
;)
;)
;)
;)
;)
;)
;)
;)
;)
;)
