|
|
 |
Fiche d'espèce de Copépode |
|
|
Calanoida ( Ordre ) |
|
|
|
Calanoidea ( Superfamille ) |
|
|
|
Calanidae ( Famille ) |
|
|
|
Calanus ( Genre ) |
|
|
| |
Calanus finmarchicus (Gunnerus, 1770) (F,M) | |
| | | | | | | Syn.: | Monoculus finmarchicus Gunnerus, 1770; (at Rensholmen, Norway, 69.6413°N, 17.9781°E ).
Cyclops finmarchicus Müller, 1776;
? Cetochilus australis Roussel de Vauzème, 1834;
Calanus spitsbergensis (F) Kröyer,1842-45;
Calanus quinqueannulatus (M) Kröyer, 1842-45 (in Damkaer & Damkaer, 1979, p.21);
Calanus affinis Kröyer, 1842-45 (in Damkaer & Damkaer, 1979 (p.21);
? Cetochilus septentrionalis Goodsir, 1843;
Temora finmarchica Claus, 1863 (p.195);
Cetochilus helgolandicus Claus, 1866;
no C. finmarchicus pontica : Karavaev, 1893 (p.3); 1894 (p.5);
no Calanus finmarchicus : Brady, 1883 (p.32); Esterly, 1905 (p.125); 1924 (p.83); Farran, 1908 b (p.20, Rem.); 1929 (part., p.207, 212); Campbell, 1929 (p.307); 1930 (p.177); Mori, 1937 (1964) (p.13, figs.F); Sewell, 1947 (p.13); 1948 (p.513, 522, 526, 544, 548, 555, 559, 565); Brodsky, 1950 (1967) (p.87, figs.19); Vervoort, 1957 (p.24); Kos, 1960 (p.656); De Decker, 1964 (p.14, 18, 30); Marques, 1966 (p.2, fig.M); Park, 1968 (p.530, Rem.); Carter, 1977 (1978) (p.35); Kovalev & Shmeleva, 1982 (p.82); De Decker, 1984 (p.320, Rem.); Shih & Young,1995 (p.68)
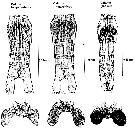
Calanus finmarchicus s.l. : Brodsky, 1964 (p.105, 107) | | | | Ref.: | | | Brady, 1878 (p.38, figs.F,M); Giesbrecht, 1892 (part. p.89, figs.M, no F); Giesbrecht & Schmeil, 1898 (part., p.14); Wheeler, 1901 (p.164, figs.F, Rem.); Sars, 1901 a (1903) (p.9, figs.F,M); Mràzek, 1902 (p.502, figs.F, Rem.); Sharpe, 1910 (p.409); Lysholm, 1913 (p.5); With, 1915 (p.10, 12, Rem.); Brady, 1918 (p.13); Sars, 1925 (p.5); Farran, 1929 (part., 207, 212); Rose, 1929 (p.5); Jespersen, 1934 (p.10, fig.F, Rem.); 1940 (p.4); Lysholm & al., 1945 (p.6); Sewell, 1948 (p.331, 495); Rees, 1949 (p.219, figs.F, M, IV, V); Farran & Vervoort, 1951 (n°32, p.3, fig.F); Marshall & Orr, 1953 (p.1, egg production); Wiborg, 1954 (p.79); 1955 (p.29); Jaschnov, 1957 (p.191, figs.); Woodhead & Riley, 1959 (p.465, Rem., 5, figs.F,M); Grainger, 1961 (p.663, figs.F,M, Rem.); Jaschnov, 1961 a (p.1323, biogéo); Brodsky, 1961 (p.14, figs.F,M); Harding, 1963 (p.81, karyotype); Grice, 1963 a (p.497, fig.F, Rem.); Manwell & al., 1967 (p.145, biochimy); Matthews, 1966 (p.479, Rem.); Matthews, 1967 a (p.159, Rev.); Maclellan D.C., 1967 (p.101, figs. 2, 4, , 5-8, table II, III, annual cycle, lengths); Koga, 1968 (p.16, fig.: egg); Vidal, 1971 a (p.12, 21,figs.F,M); Frost, 1971 (p.23, figs.M, Rem.); Brodsky, 1972 (1975) (p.2, 9, 65, 81,118, figs.); Williams, 1972 (p.53, figs.F, carte); Marshall & Orr, 1972 (p.4 & suiv., figs.F,M, juv.); Frost, 1974 (p.77, figs.,F,M, Rev.); Raymont & al., 1974 (p.409, ultrastucture); Fleminger & Hülsemann, 1977 (p.233, figs.F,M, geographical range-taxonomic divergence); Tande & Hopkins, 1981 (p.159, genital system); Brodsky & al., 1983 (p.155, figs.F,M, Rem.); Boxshall, 1983 (p.121, Rem.); Brodsky & al., 1983 (p.155, figs.F,M); McLaren & Marcogliese, 1983 (p.721, cell nucleus); Roe, 1984 (p.356); Sazhina, 1985 (p.21, figs.N) ; Fleminger, 1985 (p.274, 285, Table 1, 4, Rem.: A1); Grigg & al., 1987 (p.254, Rem. st.5); Bradford, 1988 (p.76); Nishida, 1989 (p.173, table 1, 2: dorsal hump); Schnack, 1989 (p.137, fig.7: Md);Huys & Boxshall, 1991 (p.60, 461, figs.F,M); Hulsemann, 1991 (p.620); Bradford-Grieve, 1994 (p.31); Karlson & Bamstedt, 1994 (p.79, fig.2: Md, F,M, juv.1-5); Bucklin & al., 1995 (p.658); Bucklin & al., 1996 (p.29, population genetics); Aksnes & Blindheim, 1996 (p.7); Gaard, 1996 (p.50); Harris, 1996 (p.85, 95, 98); Hirche, 1996 (p.111); 1996 a (p.129: diapause); Kann & Wishner, 1996 (p.65, genetic analysis); Bucklin & Kocher, 1996 (p.1665); Bucklin & Wiebe, 1998 (p.383, Rem.: genetic diversity); Sundt & Melle, 1998 (p.207, fig.2, 3, Rem.: mitochondrial sequence); Melle & Skjoldal, 1998 (p.211, Rem.); Lindeque & al., 1999 (p.91, Biomol.); Bucklin & al., 1999 (p.239, systematic molecular); Braga & al., 1999 (p.79, tab.1, Biomol.); Bucklin & al., 2000 (p.1237, Rem: analyse genetic molecular); Ferrari & Markhaseva, 2000 (p.84, fig.); Bucklin & al., 2000 (p.1592); Hill & al., 2001 (p.279, fig.2: phylogeny); G. Harding, 2004 (p.8, figs.F,M); Boxshall & Halsey, 2004 (p.79: figs.F,M); Arnkvaern & al., 2005 (p.528, dynamic); Conway, 2006 (p.6, 25, copepodite stages 1-6, Rem.); Ferrari & Dahms, 2007 (p.13, figs.A2: N, Rem.: p.15, 29, 31, 33, 35, 62, 63, 64, 65), 78, Table XI, XII, XIII; Vives & Shmeleva, 2007 (p.893, figs.F,M, Rem.); Dalpadado & al., 2008 (p.2266, Fig.2: Md, Table 2, 3); Provan & al., 2009 (p.301, long-term population stability); Parent & al., 2011 (p.1654, Table II: overlaping prosome size ranges, figs.2, 3, 4, 5, Table 4: molecular identification vs size range); Gabrielsen & al., 2012 (p.1621, identification problem); Parent & al., 2012 (p.1057, hybridization); Mercier & al., 2013 (p.760, neural ultrastructure); Christie & al. , 2013 (p.45, RNA vs CPO) | 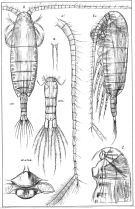 issued from : G.O. Sars in An Account of the Crustacea of Norway. Vol. IV. Copepoda Calanoida. Published by the Bergen Museum, 1903. [Pl. I]. Female. R: rostrum; or: oral parts (labrum, labium and Md blade (part.); Urs: urosome; c: cephalosome. Nota: forehead regulary rounded in lateral view.
|
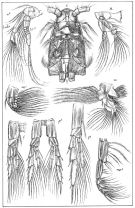 issued from : G.O. Sars in An Account of the Crustacea of Norway. Vol. IV. Copepoda Calanoida. Published by the Bergen Museum, 1903. [Pl. II]. Female. C: cephalosome; M: Md; m, Mx1; mp1: Mx2; mp2: Mxp.
|
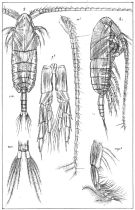 issued from : G.O. Sars in An Account of the Crustacea of Norway. Vol. IV. Copepoda Calanoida. Published by the Bergen Museum, 1903. [Pl. III]. Male. Urs: urosome; mp2: Mxp.
|
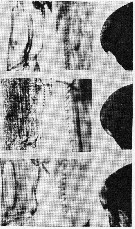 issued from : S.M. Marshall & A.P. Orr in The Biology of a Marine Copepod, Springer-Verlag (Ed.), 1972. [Fig.2]. Above drawings: Female (from North Sea): Coxa of the left P5; Proximal teeth of the coxa of the right P5; Forehead (lateral view). Middle drawings: Female (from Tromsö): Coxa of the left P5; Proximal teeth of the coxa of the right P5; Forehead (lateral view). Below drawings: Calanus helgolandicus Female (from North Sea): Coxa of the left P5; Proximal teeth of the coxa of the right P5; Forehead (lateral view). Diagnosis after Marshall & Orr (1972, p.7): - head and 1st thoracic segment distinct; - 5 free thoaracic segments; - Corners of the last thoracic segment gently rounded. - Caudal rami twice as long as broad. - A1 of 25 segments (in females) and longer than the body by 2 or 3 segments; on the 23rd and 24th segments posteriorly, conspicuous long plumose setae; - Exopods of A2 7-segmented. - Endopods of P1 to P5 3-segmented; - Inner margin of coxa in P5 in the stage V and female straight with a variable number of teeth, the number decreasing towards the south In the North Atlantic, there may be up to 40 teeth, near the Azores 27-28 and south of the equator 15-18. Some of the southerly specimens however may be helgolandicus. - P5 male asymmetrical, the right leg the shorter. Endopod of right leg reaching as far or farther than the middle of the 2nd segment of the left exopod. - The egg measures about 145 µm (138-151 µm).
|
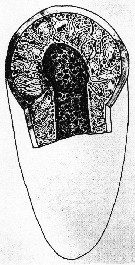 issued from : J.E.G. Raymont, S. Krishnaswamy, M.A. Woodhouse & R.L. Griffin in Proc. R. Soc. Lond., 1974, B. 185. [Fig.27]. Reconstruction of spermatophore.
|
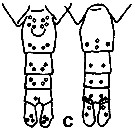 issued from K. Hulsemann in Invert. Taxon., 1994, 8. [p.1477, Fig.28, C]. Female: C, urosome (left: ventral); right: dorsal). Pore signature schematic by pooled samples (symbols are considerably larger than pores): Filled circle: 100 % presence; open circle: 95-99 % presence; triangle: 50-89 % presence. n =50.
|
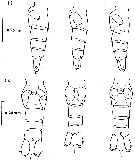 issued from : R. Williams in Bull. mar. Ecol., 1972, 8. [p.56, Fig.2]. Female (from N Atlantic): Lateral view (i) and ventral view (ii) of three urosomes showing the variation in shape of the spermathecae.
|
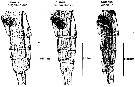 issued from : R. Williams in Bull. mar. Ecol., 1972, 8. [Plate XVII]. Female (from N Atlantic): lateral view of the urosome of the three species C. helgolandicus, C.finmarchicus and C. glacialis showing the differences in shape of their spemathecae. The edge of the operculum is easily seen in C. helgolandicus and C. finmarchicus.
|
 issued from : R. Williams in Bull. mar. Ecol., 1972, 8. [Plate XVIII, XIX]. Female (from N Atlantic): Above: Ventral view of the urosomes of the three species showing the obvious differences in shape of the spermathecae. The genital pore is in a more posterior position in C. glacialis than in the other two species. Below: A dorsal view of the spermathecae still attached to the basal plate. The spermatophore sac secretion which precedes the extrusion of the spermatozoa, is clearly seen in the spermathecae of C. finmarchicus. The lobed appearance of the spermathecal sacs of C. helgolandicus is also shown.
|
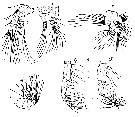 issued from : S.M. Marshall & A.P. Orr in The Biology of a Marine Copepod, Springer-Verlag (Ed.), 1972. [p.12, Fig.2]. The mouthparts of adult: a, A1; b, Md; c, Mx1; d, Mx2; e, Mxp.
|
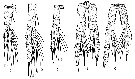 issued from : S.M. Marshall & A.P. Orr in The Biology of a Marine Copepod, Springer-Verlag (Ed.), 1972. [p.14, Fig.4]. Female & Male: a, P1; b, P4. Female: c, P5. Male: d, P5. C. helgolandicus male: e, P5.
|
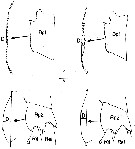 issued from : B.W. Frost in Mar. Biol., 1974, 26. [p.80, Fig.5]. limits for measurements of curvature (déviation D) of medial margin of basipodites 1 and 2 of female P6 (anterior view). C. finmarchicus (left drawings) compared to C. glacialis. Scale bar a = 0.05 mm; b = 0.02 mm.
|
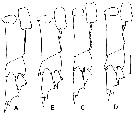 issued from : B.W. Frost in Mar. Biol., 1974, 26. [p.81, Fig.6]. Basipod, exopodite 1 and endopodite 1 of right P5 (anteerior view) illustrating differences between members of species groups C. finmarchicus and .
A: C. finmarchicus female.
B: C. helgolandicus female.
C: C. finmarchicus male.
D: C. helgolandicus male.
|
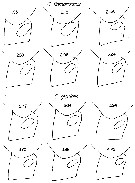 issued from : B.W. Frost in Mar. Biol., 1974, 26. [p.83, Fig.7]. Posterolateral margin of 5th thoracic segment and genital segment (right lateral view) for adult female C. finmarchicus (upper two rows) and C. glacialis (lower two rows). Length of prosome (measurred laterally) indicated par numbers.
|
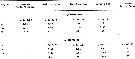 issued from : B.W. Frost in Mar. Biol., 1974, 26. [p.86, Table 2]. Range and variation of prosome length (measured laterally, in mm) of adult females from two regions of allopatry (western North Atlantic Ocean and Central Arctic Ocean), three regions of sympatry. r: range; m: mean length of specimens; cv: coefficient of variation of length measurements; n: number of specimens.
|
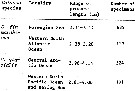 issued from : B.W. Frost in Mar. Biol., 1974, 26. [p.90, Table 4]. Range of prosome length (measured laterally) of adult females in allopatric populations.
|
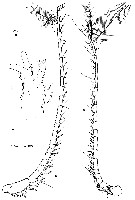 issued from : R. Huys & G.A. Boxshall in Copepod Evolution. The Ray Society, 1991, 159. [p.60, Fig.2.2.7, A-C]. Female (from Canada: Ungava Bay): B, right A1; C, detail of tip of A1. Male: A, right A1.
|
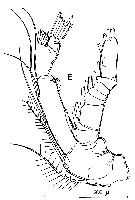 issued from : R. Huys & G.A. Boxshall in Copepod Evolution. The Ray Society, 1991, 159. [p.65, Fig.2.2.12, E]. E, A2.
|
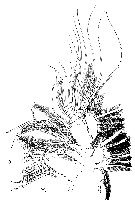 issued from : R. Huys & G.A. Boxshall in Copepod Evolution. The Ray Society, 1991, 159. [p.72, Fig.2.2.19, B]. B, Mx1.
|
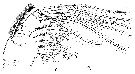 issued from : R. Huys & G.A. Boxshall in Copepod Evolution. The Ray Society, 1991, 159. [p.75, Fig.2.2.22, C]. C, Mx2.
|
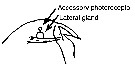 issued from : G. Harding in Key to the adullt pelagic calanoid copepods found over the continental shelf of the Canadian Atlantic coast. Bedford Inst. Oceanogr., Dartmouth, Nova Scotia, 2004. [p.8]. Female: forehead (lateral).
|
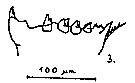 issued from : S.B. Schnack in Crustacean Issue, 1989, 6. [p.144, Fig.7: 3]. 3, Calanus finmarchicus (from Norwegian fjord): Cutting edge of Md.
|
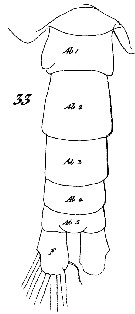 Issued from : W. Giesbrecht in Systematik und Faunistik der Pelagischen Copepoden des Golfes von Neapel und der angrenzenden Meeres-Abschnitte. - Fauna Flora Golf. Neapel, 1892, 19 , Atlas von 54 Tafeln. [Taf.7, Fig.33]. Male: 33, urosome (dorsal).
|
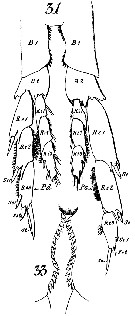 Issued from : W. Giesbrecht in Systematik und Faunistik der Pelagischen Copepoden des Golfes von Neapel und der angrenzenden Meeres-Abschnitte. - Fauna Flora Golf. Neapel, 1892, 19 , Atlas von 54 Tafeln. [Taf.8, Figs.31, 33]. . Male: 31, P5 (anterior view); 33, inner margin of basipodite (: coxa) of P5 (posterior view).
|
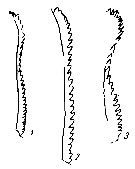 issued from : K.A. Brodsky in Zool. Zh., 1959, 38, 10. [p.1541, Fig.3]. Comparison of coxopodite inner edge of P5 female for Calanus glacialis (1), Calanus finmarchicus (2) and Calanus helgolandicus (3). Nota: Calanus glacialis : Dentate plate on coxopodite has very short, blunt teeth and is sligh curved in central position. Teeth are close together, without spaces, numbering 30-34. Calanus finmarchicus : Dentate plate on coxopodite has short, blunt teeth, with small spacings. Teeth-line not curved. Number of teeth 29-30. Calanus helgolandicus : Dentate plate on coxopodite very characteristic; teeth have more or less parallel edges, are relatively small, strongly marked curve in middle of line; distal part of plate has closely set, elongated teeth; spaces between teeth only in central part of line, teeth here are rounded, not flat. Number of teeth 28 (according to Jaschnov most specimens from the North Sea had 28-33 teeth).
|
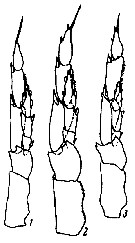 issued from : K.A. Brodsky in Zool. Zh., 1959, 38, 10. [p.1542, Fig.4]. Comparison of left leg of P5 for Calanus glacialis (1), Calanus finmarchicus (2) and Calanus helgolandicus (3). Nota: Calanus glacialis : In segments of exopodite of left leg, the relation of width of 1st and 2nd segments to length of corresponding segments is 1 : 3. Left endopodite reaches almost half the length of the 2nd segment of the exopodite of the same leg. Calanus finmarchicus : Relation of width to length of 1st and 2nd segments of exopodite of left leg is 1 : 2.5. Left endopodite extends beyond middle of 2nd segment of exopodite. Calanus helgolandicus : Relation od width to length of 1st and 2nd segments of exopodite of left leg is 1 : 2.5. left endopodite reaches distal limit of first third of 2nd segment of exopodite of same leg.
|
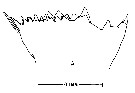 issued from : M. Anraku & M. Omori in Limnol. Oceanogr., 1963, 8. [p.122, Fig. 7, A] Calanus finmarchicus (from Woods Hole): Cutting edge of Md. Nota: The toothed grinding surface has 9 teeth and one margnal denticulate spine. Each tooth has a few small processes.
|
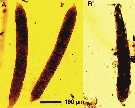 Issued from : K.E. Arendt in PhD Thesis, Univ. of Copenhagen, 2011. [p.24, Fig.10]. Lugol fixed fecal pellets of Calanus finmarchicus (from Godthabsfjord, Southwest Greenland) when feeding on a diatom diet A) without suspended sediments and B) with suspended sediments. Photo K.E. Arendt.
|
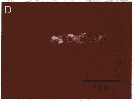 Issued from : B.H. Hansen, D. Altin, A.J. Olsen & T. Nordtug in Ecotoxicol. Environ. Saf., 2012, 86. [p.43, Fig.4, D]. Oil droplets in fecal pellet (higher magnification). For interpretation of the references to color, the reader is referred to the web version http://dx.doi.org/10.1016/j.ecoenv.2012.09.009.
|
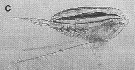 Issued from : B.J. Hansen, K. Degnes, I.B. Øverjordet, D. Altin & T.R. Størseth in Polar Biol., 2013, 36. [p.1578, Fig.1, C]. Calanus finmarchicus Stage V from Kongsfjorden, Svalbard (79°N, 12°E)
|
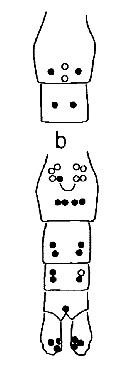 Issued from : A. Fleminger & K. Hulsemann in Mar. Biol., 1977, 40. [p.243, Fig.6 b]. Pore signature patterns of female urosome (ventral view shown below, dorsal view of genital segment and segment 2 (above). Specimens (n = 50) from North Atlantic localities. Filled circles: integumental pore present in all specimens examined; open circles: pore present in from 90 to 99% of specimens examined. Symbols used to indicate pores are not proportionate to actual pore size (latter range from 1 to 3 µm in diameter). Nota: The distribution of integumental organs on the urosome of adult females was determined in specimens selected at random from samples representing a variety of localities within the North Atlantic distribution. Calanus helgolandicus is most distinctive in lacking the 2 pairs of pores found in C. finmarchicus and C. glacialis on the ventral side of urosomal segments 2 and 3 and in having only 3 pores on the dorsal side of the genital segment. C. finmarchicus is distinguished from C. glacialis chiefly by the presence of 4 pairs of pores on the ventral side of the genital segment anterior to the genital operculum.
|
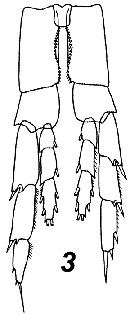 Issued from : V.N. Andronov in Russian Acad. Sci. P.P. Shirshov Inst. Oceanol. Atlantic Branch, Kaliningrad, 2014. [p.73, Fig.19, 3]. Calanus finmarchicus after Sars, 1903. Male P5.
|
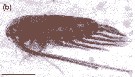 Issued from : M. Daase, Ø. Varpe & S. Falk-Petersen in J. Plankton Res., 2013, 36 (1). [p.135, Fig.1 b].
b: carcass of adulte female with intacy carapace and complete lipid sacd (above the gut).
Scale bar = 1 mm.
|
 Issued from M. Rose in Résult. Camp. scient. Prince Albert I, 1929, 78, p.6. Remarques concernant Calanus finmarchicus et Calanus helgolandicus. See differences between the two species after S.M. Marshall & A.P. Orr, 1972 (p.7-8, fig.2)
|
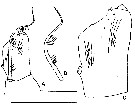 Issued from : J.A. Fornshell & F.D. Ferrari in Crustaceana, 2014, 87 (1). [p.107, Fig.3, A-C]. Von Vaupel Klein's organ on right endopodal segment 1 and right basal seta of P1. A, anterior, distal up (showing denticles and pores); B, right basal seta; C, proximal endopodal segment Scale line; short = 25 µm; long = 80 µm. The Von Vaupel Klein organ is an association (srtucture) of the distal seta from basis and the proximal endopodal segment of P1. This structure shows significant variability among many gymnoplean copepods, in the shape of the distodorsal corner of the proximal endopodal segment, presence and location of denticles on the anterior face of the segment, presence and size of denticles along the distal margin of the segment , number of pores on the segment, shape of the seta that originates on the basis, and the morphology of the basis at the origin of the seta. The function of this complex structure is not known.
|
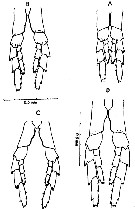 Issued from : D.C. Maclellan in Can. J. Zool., 1967, 45. [p.104, Fig.2]. Camera lucida drawings of P5 of adult females of Calanus, showing differences in the curve of the 1st basipodite inner edge, with cephalothorax length. (A) C. finmarrchicus s.str., 2.9 mm; (B) C. finmarchicus s.str., 3.4 mm. (C) C. glacialis from inner fjord (± 64°15' N, 52°40' W), 3.0 mm; (D) C. glacialis (Yaschnov), 3.7 mm.
|
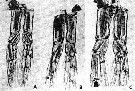 Issued from : D.C. Maclellan in Can. J. Zool., 1967, 45. [Pl. I]. Adult males of Calanus showing differences in curvature of P5, with cephalothorax lengths. (A) C. finmarchicus s.str., 2,9 mm. (B) C. glacialis from inner fjord (± 64°15' N, 52°40' W); (C) C. glacialis (Yaschnov), 3.7 mm.
|
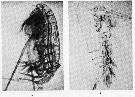 Issued from : S.M. Marshall & A.P. Orr in The Biology of Marine Copepod Calanus finmarchicus (Gunnerus). 1972, Springer-Verlag, Berlin. [53, Fig. 27]. (a) Copepodite IV from Calanus finmarchicus moulting to V; the back has been cast off and the antennules and urosome are partly withdrawn; (b) cast of Copepodite V. Nota: When Calanus copepodite moults, the exoskeleton splits horizontally just above the rostrum and the junction of the limbs, and the cephalosome is pushed back off the head like a hood. Through this opening the copepod slips out and the process usually occurds very rapidly. A number of experiments were made to test the effect which these factors had on the moult in the laboratory. Each factor tested seemed to have some positive effect, i.e. those in the light moulted better than those in the dark, those fed than those starved, and those at aquarium temperature better than those near 0°C. (a): the heart (middle back) , like the oil sac and gut are well visible.
| | | | | Ref. compl.: | | | Gadeau de Kerville, 1894 (p.81); Damas & Koefoed, 1907 (part., p.382, tab.II, III); Sars, 1909 b (p.16); Farran, 1926 (? part., p.226); Currie, 1918 (p.207, exuviation, variation); Cannon, 1928 (p.131, feeding mechanism); Harvey J.M., 1929 (p.85, light vs. heart ); Hilton, 1931 (p.193, oogenese); Wilson, 1932 (p.21); W.H. Johnson, 1933 (p.1, vertical distribution vs. light); Gardiner, 1933 (p.575, vertical distribution); Gibbons, 1933 (p.1, biology); Orr, 1934 (p.613, chemical composition); Bond, 1934 (p.461, digestive enzymes); Sømme, 1934 (p.1, production); Fish, 1936 (p.118, biology); Gibbons, 1936 a (p.1, composition); Harvey H.W., 1937 (p.97, diatoms clearance: equation); Hasler, 1937 (p.290, digestive enzymes); Jespersen, 1939 (p.8, Rem., Table 25, 26, 27, 28, 29, 30); Clarke & Bonnet, 1939 (p.371, survival, respiration vs. temperature); Raymont & Gross, 1942 (p.267, feeding & breeding); Wilson, 1942 a (part., p.172); Barnes, 1949 (p.429, statistical variations); Wilson C.B., 1950 (part., p.177, non st. Pacif.); Fleury, 1950 (p.47, fig.2); Raymont & Gauld, 1951 (p.681, respiratory rate); Marshall & Orr, 1952 (p.527, Table I: egg sizes, egg production); 1953 (p. 1, fig.1: egg, egg production, rate of sinking, time of egg laying, development time); Gundersen, 1953 (p.1, 9, Table 1-8, seasonal abundance, Fjords distribution); Marshall & Orr, 1954 (p.393, hatching); 1955 (p.495, nutrition, excretion); 1955 a (p.110, feeding); 1956 (p.587, feeding, young stages); Østvedt, 1955 (p.14: Table 3, p.17, 29); Deevey, 1956 (p.127, Table IV); Marshall & Orr, 1958 (p.459, oxygen consumption); Jaschnov, 1958 (p.838, fig.2); Woodhead & Riley, 1959 (p.465, stage 5 M & F, sex ratio); Cushing, 1959 (p.455, Rem.: p.459); Lacroix, 1960 (p.11, 25); Conover, 1960 (p.399, Table I, respiratory rate); Deevey, 1960 (p.5, Table II, fig.8: annual abundance, Rem.: p.31, fig.18, 19); Wiborg, 1960 (p.1, fig.10, 15, abundance distribution); Grainger, 1961 (p.663, fig.); Carlisle & Pitman, 1961 (p.827, neurosecretion-diapause); Cowey & Corner, 1961 (p.124, amino acids); Raymont & Conover, 1961 (p.154, carbohydrate content); Sushkina, 1961 (p.1208, vertical distribution vs lipid-; Wickstead, 1962 (p.546, food & feeding); Grice, 1962 a (p.101, 103); Grice & Hart, 1962 (p.287, table 4: abundance); Fischer, 1962 (p.129, % lipids); Curl, 1962 (p.183, Table I, CNP composition); 1962 a (p.181, Table II, C composition); Lacroix & Bergeron, 1963 (p.59, Tableau III, IV); Anraku & Omori, 1963 (p.117, figs. juv.); Halcrow, 1963 (p.1, temperature v.s. respiration, acclimation); McLaren, 1963 (p.685, 691, fig.1b, hatching v.s. temperature); Cowey & Corner, 1963 (p.485, amino acid composition); Cushing & Vucetic, 1963 (p.349, grazing); Grainger, 1963 (p.66, Table I, II, fig.5, 6, 7, 8, chart, size); Zeiss, 1963 (p.110, oxygen consumption vs. animal concentrations); M.W. Johnson, 1963 (p.89, Table 1, 2); Anraku, 1964 a (p.221, grazing, predation); 1964 b (p.195, respiration-grazing vs. temperature); Martin, 1965 (p.188); Grice Hulsemann, 1965 (p.223); Corner & al., 1965 (p.429, feeding-excretion); [Mazza, 1966 (p.69)]; Cowey & Corner, 1966 (p.225, amino acids, diet, faecal pellets); Comita & al., 1966 (p.1, Table 1-6, figs.1-6, weight-calorific value-organic matter); Manwell & al., 1967 (p.145, electrophoresis-enzymes); Corner & al., 1967 (p.259, feeding efficiency); Glover, 1967 (p.189, fig.5, annual abundance); Matthews, 1967 (p.159, Table 1, Rem.); Robertson, 1968 (p.185, Text-Fig.5, abundance); Conover & Corner, 1968 (p.49, 57, respiration & nitrogen excretion); Corner & Cowey, 1968 (p.393, Table 6, 7, 8, fatty acid composition, respiration, assimilation); Vinogradov, 1968 (1970) (p.44, 61, 62, 63, 65, 87, 90, 94, 105, 106, 110, 234, 278); Mullin, 1969 (p.308, Table I: estimates of production); Strömgren, 1969 (p.5); Keegan, 1969 (p.137, abundance); Butler & al., 1969 (p.977, nutrition/metabolism); 1970 (p.525, N/P excretion); Jaschnov, 1970 (p.202, chart); Itoh, 1970 a (p.1, tab.1, 2, fig.Md); Shih & al., 1971 (p.32, 201); Marshall & Orr, 1972 (pp.1-195: biology); Corkett, 1972 (p.171, eggs: development rate); Bainbridge & Forsyth, 1972 (p.21, Table I: indictor species); Gaudy, 1972 (p.175, Rem.: p.223-4); Matthews & Sands, 1973 (p.19, Table 4); Conover & Francis, 1973 (p.272, Table 3, grazing rate measured by isotope); Arndt & Heidecke, 1973 (p.599, 603); Beaudouin J., 1973 (p.69); Grice & al., 1973 (p.45, Table 2, mortality vs. pH); Eriksson, 1973 (p.37, fig.6, 7, 9, annual cycle); 1973 b (p.113, 117); Harding, 1973 (p.670, decomposition, bacteria); 1974 (p.141, Table 2, 3, gut contents); Raymont & al., 1974 (p.409, ultrastucture); Raymont & al., 1974 (p.409, structure); Corner & al., 1974 (p.319, feeding, nauplii diet); Landry, 1975 a (p.434, Rem.: p.437, fig.3);nBousfield & al., 1975 (p.1, estuary); Mayzaud & Martin, 1975 (p.297, chemical composition); Mayzaud, 1976 (p.47, respiration/nitrogen excretion); Davis C.C., 1976 (p.37, fig.2, reproductive characteristics); Gruzov & Voloshina, 1976 (p.498, feeding); Deevey & Brooks, 1977 (p.256, Table 2, Station "S"); Skjoldal & Bamstedt, 1977 (p.197, adenosides); Beers & al., 1977 (p.66, Rem.: p.77, Cu pollution); Harding & Vass, 1977 (p.177, clearance-DDT); Sameoto, 1977 (p.1, fig.9, abundance); Colebrook, 1978 (tab.1); Honjo & Roman, 1978 (p.45, fecal pellet, sinking rate); Matthews & al., 1978 (p.277, annual cycles); McLaren, 1978 (p.1330, 1335: life history); Gamble, 1978 (p.303, grazing rates); Hopkins & al., 1978 (p.261, Table 3, Rem.: DSL); Hernroth, 1978 (p.1, Rem.: p.7); O'Hara & al., 1979 (p.331, sex hormone); Longhurst & Williams, 1979 (p.1, Table IVb, V, fig.5, 8a, vertical distribution/North Atlantic Drift); Poulet & Marsot, 1980 (p.198, Table 1, 4, feeding); Hallberg & Hirche, 1980 (p.283, gut ultrastructure, enzymes); Williams & Lindley, 1980 a (p.47, vertical distribution, population dynamic, production); Herman & Dauphinee, 1980 (p.79, Table 2, 3, length-volume); Bamstedt & Skjoldal, 1980 (p.304, weight-RNA); Pipe & Coombs, 1980 (p.223, figs. 1, 2, 4, table 1, vertical distribution); Herman & Mitchell, 1981 (p.739, Table 1, length-volume); Herman & al., 1981 (p.1065, front effect- chlorophyll production); Huntley, 1981 (p.831, ingestion rate vs. food concentration); Hirche, 1981 (p.174, enzymes); Gagnon & Lacroix, 1981 (p.401, fig.5, Table 1, tidal effect); Tande & Hopkins, 1981 (p.159, gonad development); Grigg & al., 1981 (p.885, variation prosome length); Grigg & Bardwell, 1982 (p.62, moulting-maturation stage 5); Harding G.C. & al., 1981 (p.101, diet contaminated); [Kovalev & Shmeleva, 1982 (p.82) ]; Citarella, 1982 (p.791, 798: listing, frequency, Tableau II, V); Buchanan & Sekerak, 1982 (p.41, vertical distribution, Rem.: p.47); Tande, 1982 (p.129, generation cycles); Tande & Slagstad, 1982 (p.63, enzyme activity); Gagnon & Lacroix, 1982 (p.9, fig.4); 1983 (p.289, fig.2, tidal estuary); Maranda & Lacroix, 1983 (p.247, estuary); Aksnes & Magnesen, 1983 (p.195, development, production); Turner & Dagg, 1983 (p.14, fig.8), Haury & al., 1983 (p.65, internal wave effect); van der Spoel & Heyman, 1983 (p.62); McLaren & Marcogliese, 1983 (p.721, body size vs. nucleus counts); Hirche, 1983 (p.281); Huntley & al., 1983 (p.143, Table 2, 3); Hernroth, 1983 (p.835, Rem.: p.840); Hassel, 1983 (p. 1, fig.3, 4, abundance, distribution); Herman A.W., 1983 (p.709, vertical abundance vs. Chl.a); Sameoto, 1984 (p.213, Table 1, fig.3, 5, 8); 1984 a (p.767, vertical migration); Bamstedt & Ervik, 1984 (p.843, size, enzymes, chemical composition); Norrbin & Bamstedt, 1984 (p;47, Table 2: calorific value); Davis C.S., 1984 (p.31, population dynamic, predation); Hirche, 1984 (p.233, seasonal distribution); Baars & Fransz, 1984 (p.120, Table 1, grazing); De Ladurantaye & al., 1984 (p.21, fig.5, advective processes in fjord); Hopkins C. & al., 1984 (p.77, life history); Tremblay & Anderson, 1984 (p.4); Baars & Helling, 1985 (p.81, Table 2: comparison gut fluorescence-gut clearance rate); Baars & Oosterhuis, 1985 (p.71, grazing, gut passage time); Colebrook, 1985 (p.261, tab.1, fig.2); Bamstedt, 1985 (p.607, excretion rate); Helling & Baars, 1985 (p.41, grazing); Smith & al., 1985 (p.693); Simard & al., 1985 (p.598, grazing rhythm); Runge, 1985 a (p.33, egg production); Williams R., 1985 (p.145, vertical distribution); Hargrave & al., 1985 (p.221, annual abundance); Williams & Collins, 1985 (p.28); Bamstedt & Tande, 1985 (p.259, Table 2: literature data respiration & excretion); Wishner & Allison, 1986 (tab.2); Harding & al., 1986 (p.952, Table 1 2, 3, 4, 6, fig.7, diel vertical movements); Anderson & Gardner, 1986 (p.1111, abundance distribution); Diel & Klein Breteler, 1986 (p.85, growth, development rate); Hassel, 1986 (p.329, spatial distribution); Mikhailovsky, 1986 (p.83, Table 1, ecological modelling); Runge, 1987 (p.2009, egg production); Williams R. & al., 1987 (p.248: Rem.); Grigg & al., 1987 (p.253, biometry, development); Davis C.S., 1987 (p.947, production); Bathmann & al., 1987 (p.45, Rem.: p.47, fecal pellets); Falk-Petersen & al., 1987 (p.115, lipid composition); Hirche, 1987 (p.347, activity, respiration vs. temperature); 1987 a (p.431, spatial distribution, dogestive enzymes, nutrition); Huntley, 1988 (p.83, Table 1, feeding history); Tiselius, 1988 (p.215, grazing); S.L. Smith, 1988 (p.145, feeding, respiration, ammonium, excretion ice-edge effect); Tande, 1988 (p.51, development); McLaren & al., 1988 (p.275, DNA content, development rate: egg-nauplius); Aksnes & Magnesen, 1988 (p.57, Rem.: p.67: productivity); Bamstedt, 1988 (p.15, protein content); Bamstedt & Tande, 1988 (p.31, respiration, excretion); Grigg & al., 1989 (p.101, stage 5/body size/weight); McLaren & al., 1989 (p.560, life history, annual production); Kattner & Krause, 1989 (p.261, table 1, 2, 5, lipids); Ikeda & Skjoldal, 1989 (p.173, oxygen consumption, N & P excretion, O:N vs. body weight); Citarella, 1989 (p.123, abundance); Kattner & al., 1989 (p.473, Table 1, 2, 5, dry weight, lipids); Hirche, 1989 (p.431, spatial distribution, enzyme activity); Kosobokova, 1989 (p.26); Meise-Munns & al., 1990 (p.225, long-term change abundance); Andeson J.T., 1990 (p.127, abundance, stratification, interannual variation); Hansen B. & al., 1990 (p.5, grazing); Estep & al., 1990 (p.235, grazing); Hirche, 1990 (p.53, egg production); Bathmann & al., 1990 (p.117, fecal pellets, sedimentation); S.L. Smith, 1990 (p.59, egg production, lipid, gut content); Sameoto & Herman, 1990 (p.225, life history, distribution); Aksnes & Giske, 1990 (p.209, model); Fransz & al., 1991 (p.4 & suiv.); Hirche, 1991 (p.351); Miller & Grigg, 1991 (p.479); Miller C.B. & al., 1991 (p.79, phenology); Hirche & al., 1991 (p.477, Fig.3, 6, 7, 8, Table 2); Hay & al., 1991 (p.1453, Table 2); Morales C.E. & al., 1991 (p.455, Table I, grazing); W.T. Peterson & al., 1991 (p.131, egg production, growth rates, secondary production); Conover & Huntley, 1991 (p.1, Table 2, 6, 9, 10, 11, polar seas comparison); Pedersen & Tande, 1992 (p.183, acclimatation); Head, 1992 (p.583, gut pigment destruction); Huntley & Lopez, 1992 (p.201, Table 1, A1, eggs, egg-adult weight, temperature-dependent production); Urban & al., 1992 (p.255, fecal pellet contents); Hirche & Mumm, 1992 (p.S485, geographic distribution, egg production); Herman, 1992 (p.395, fig.7, size distribution by OPC); Diel & Tande, 1992 (p.21, egg production, spawning periods); Tande & Slagstad, 1992 (p.309, interannual variations, production model); Mumm, 1993 (tab.1, fig.2); Plourde & Runge, 1993 (p.217, reproduction vs. phytoplankton production); Turner & al., 1993 (p.255, feeding behavior; cinematographic study); Urban & al., 1993 (p.607, fecal pellet production); Morales C.E. & al., 1993 (p.185, Rem.: p.199); Ashjian & Wishner, 1993 (p.483, abundance, species group distributions); Urban & al., 1993 (p.607, seasonal variations in fecal pellets); Carlotti & al., 1993 (p.1125, growth, development vs. temperature, modelisation); Hays & al., 1994 (tab.1); Pasternak, 1994 (p.241); Richter, 1994 (tab.4.1a); Hansen & al., 1994 (p.395, Table 1, selectivity); Ohman & Runge, 1994 (p.21, lipid content, egg production, omnivory); Munk & Nielsen, 1994 (p.1225, fig.4, Table III: egg production, predation); Ashjian & al., 1995 (p.4371, Fig.4, 5, 6, Table 4); Southward & al., 1995 (p.127, fig.3); Hays, 1995 (p.301, Table 1, vertical migration); 1995 a (p.650, vertical distribution vs. herring stock variations, 1960-1990); Pedersen & al., 1995 (p.266, tabl. II); Krause & al., 1995 (p.81, Rem.: p.127); Meise & O'Reilly, 1996 (p.1473, long-term abundance change/climate); Fromentin & Planque, 1996 (p.101, spatial & temporal pattern); 1996a (p.111, distribution vs. NAO); Albers & al., 1996 (p.347, lipids vs. diet); Hays & al., 1996 (p.159, Rem.: Herring correlation); Hirche, 1996 (p.129, Rem.: diapause); Niehoff & Hirche, 1996 (p.601, oogenesis, gonad maturation, egg production); Slagstad & Tande, 1996 (p.189, vertical migration); DFO, 1996 (p.1, fig.6, interannual abundance); Zauke & al., 1996 (p.141, Table 7, metal bioaccumulation); Runge & de Lafontaine, 1996 (p.21, feedin vs. microplankton); Hanssen, 1997 (tab.3.1); Falkenhaug & al., 1997 (p.449, spatio-temporal pattern); Hirche & Kwasniewski, 1997 (p.299, Table 1, 2, 4, 5, Fig.4, 12); Ashjian & al., 1997 (p.279, Table 1, 2, Figs. 2, 3, 4 E,F); Nejstgaard & al., 1997 (feeding, reproduction); Hirche & al., 1997 (p.609, egg production vs. temperature, food, season); Carlotti & Hirche, 1997 (p.91, egg production); Ban S, Burns C. & al., 1997 (p.287, figs.1, 2, Table 1, 2, fig.2, feeding, reproduction); Durbin & al., 1997 (p.103, abundance vs. spatial distribution, depth distribution, recruitment vs. winter, gonad maturation, egg production); Planque & al., 1997 (p.315, seasonal abundance vs. spatial variations); Mauchline, 1998 (p.508: Rem.); Kosobokova & al., 1998 (tab.2); Miller & al., 1998 (p.488, storage lipids); Sameoto & al., 1998 (p.1, 7, figs. 8, 9, 12, spatial distribution, interannual variation); Hannah & al., 1998 (p.1887, transport pathway mechanisms); Weslawski & Legezynska, 1998 (p.1238); Titelmann & Tiselius, 1998 (343, table 1, 2, 3); Reid & Hunt, 1998 (p.310, figs.2, 3, Rem.); Mumm & al., 1998 (p.189, Figs.3, 4); Melle & Skjoldal, 1998 (p.211, egg production, development); Planque & Reid, 1998 (p.1015, abundance vs. climate); Wagner & al., 1998 (p.173, RNA: DNA ratios vs. nutritional condition); Hirst & Batten, 1998 (p.307, diel vertical migration vs. fish predation); Fiksen & Carlotti, 1998 (p.129, life history vs. diel vertical migration, modeling); Hirche, 1998 (p.359, dormancy); Irigoien & al., 1998 (p.127, feeding vs. spring bloom, Station M); Starr & al., 1999 (p.379, figs.: egg, N, egg production); Niehoff & al., 1999 (p.81, reproduction vs. spring bloom); Thibault & al., 1999 (p.1391); Beare & McKenzie, 1999 (p.241, fig.4, 5); Corten, 1999 (p.191, Table 1); Meyer-Harms & al., 1999 (p.154, selective feeding); B.W. Hansen & al., 1999 (p.233, seasonal abundance & biomass); Bamstedt & al., 1999 (p.19, feeding vs. algae diet); Harvey & al., 1999 (p.1, 49: Appendix 5, in ballast water vessel); Jonasdottir, 1999 (p.61, lipid content vs. developmental stages); DFO, 2000 (p.1, Rem.: p.4, fig.2, interannual variations); 2000 a (p.1, Rem.: p.6, fig., interannual variations); Visser & Jonasdottir, 1999 (p.100, lipids vs. vertical migration); Pepin & Maillet, 2000 (p.1, Rem.: p.8, table 2, interannual variations); Kaartvedt, 2000 (p.1819, relationship with planktivorous fishes); Miller & al., 2000 (p.1786, oil storage); Heath & al., 2000 (p.628, abundance distribution); Kosobokova & Hirche, 2000 (p.2029, tab.2); Beare & al., 2000 (p.1545, Atlantic index indicatot); Campbell & Head, 2000 (p.518, egg production); 2000 a (p.1780, egg viability); Gislason & al., 2000 (p.1619, life history); Planque & Batten, 2000 (p.1528, climate change); Gislason & Astthorson, 2000 (p.1727, distribution, ontogenic migration, egg production); Fiksen, 2000 (p.1825, adaptative timing of diapause); Helle, 2000 (p.1636, regional distribution); Hygum & al., 2000 (p.1075, development, growth rates/nauplii vs. diatom bloom); Musaeva & Suntsov, 2001 (p.511); Irigoien & al., 2000 (p.1752, sex ratio vs. diet); Niehoff, 2000 (p.1764, reproduction vs. starvation); Crain & Miller, 2000 (p.1773, sex ratio vs. diapause); Greene & Pershing, 2000 (p.1536, populations vs. climate variability, NAO); Holmes, 2001 (p.36, Rem.); Fransz & Gonzalez, 2001 (p.255, tab.1); Lischka & al., 2001 (p.186); Ashjian & al., 2001 (p.245); Campbell & al., 2001 (p.531, production vs. food limitation); 2001 a (p.161, Growth & Development rates); Ohman & Hirche, 2001 (p.628, egg mortality rates vs. cannibalism); Beare & al., 2002 (p.917, fig.2); Sameoto, 2001 (p.749, Table 4, Rem.: decadal changes); Ohman & Hirche, 2001 (p.638, egg mortality rates vs. female abundance); Madsen & al., 2001 (p.75, development & production vs. annual); Plourde & al., 2001 (p.647, life cycle); Pasternak & al., 2001 (p.1141, seasonal changes in feeding, gonad & lipid stores); Beare & al., 2002 (p.29, Rem.); Beaugrand & al., 2002 (p.1692); Beaugrand & al., 2002 (p.179, figs.5, 6); Wexels Riser & al., 2002 (p.175, fecal pellets); Pasternak & al., 2002 (p.147, fig.8, Table 4, feeding activity vs. egg production, faecal pellets); Ringuette & al., 2002 (p.5081, Table 1, 2, Fig.6, population dynamic); Auel & Hagen, 2002 (p.1013, tab. 2, 3); Arashkevich & al., 2002 (p.125, seasonal & regional variations); Sameoto & al., 2002 (p.12); Kosobokova, 2003 (p.118: fig.2); Evjemo & al., 2003 (p.191, Table I, fig.1, lipids & fatty acids); Hirche & Kosobokova, 2003 (p.769, 3, 4, 5, Table 2, 3); Reid al., 2003 (p.260, figs.3, 5); Astthorsson & Gislason, 2003 (p.843); Kahle & Zauke, 2003 (p.409, metals concentration); Baumgartner, 2003 (p.855, comparison nets/ LOPC); Halvorsen & al., 2003 (p.339, habitat selection); Karnovsky & al., 2003 (p.289, Table 1, fig. 9, Appendix 1, 2, auks relation/copepods); Heath & al., al., 2004 (p.698, Rem: life-cycle patterns); Irigoien, 2004 (p.259, lipids vs life cycle); Gislason & Astthorsson, 2004 (p.472, tab.1, fig.4); Lindeque & al., 2004 (p.121, fig.2); Bonnet & Frid, 2004 (p.485, fig.5); Ohman & al., 2004 (p.687, mortality rate); Eiane & Ohman, 2004 (p.183, stage-specific mortality); CPR, 2004 (p.50, fig.137); Beaugrand, 2004 (p.3, fig.7); Vallet Dauvin, 2004 (p.539, tab.2); Fiksen & al., 2004 (p.980 , lipids vs. life cycle); Arashkevich & al., 2004 (p.119, life cycle, gnathobase, gonads, oil sac); Miller C.B., 2005 (p.221, 356: CPR time series vs. NAO, fig. 16.11, 16.12, Rem.); Mullin C.B., 2005 (p.163, figs. 8.3, 8.4, 8.5, egg production); Dmoch & Walczowski, 2005 (p.102 + poster); Jonasdottir & al., 2005 (p.1239, egg production & hatching success); Thor & al., 2005 (p.341); Bonnet & al., 2005 (p.41-45, tab.2); Manning & Bucklin, 2005 (p.233, Table 1, fig.5); Torgersen & Huse, 2005 (p.1301, model of retention); Hays & al., 2005 (p.337, fig.1, climate change); Frangoulis & al., 2005 (p.254, Table I: C/N/P fecal pellet composition); Reigstad & al., 2005 (p.265, fate of fecal pellets); Blachowiak-Samolyk & al., 2006 (p.101, tab.1); Lindeque & al., 2006 (p.221); Basedow & al., 2006 (p.1181, fig.3, Table II, spatial patterns, recruitment dynamic); Durbin & Casas, 2006 (p.2537, Table 2a, 2b, Fig.4); Runge & al., 2006 (p.2618, egg production); Neverdal & al., 2006 (p., oil effect); Johnson C. & al., 2006 (p.2520, diapause vs. transport & retention); Saumweber & Durbin, 2006 (p.2597, diapause duration); Hop & al., 2006 (p.182, Table 4, 5: inter-annual variability, fig.17); Willis & al., 2006 (p.39, Table 2, advection vs changes in community structure); Hassett, 2006 (p.997, lipid contents vs morphotypes); Speirs & al., 2006 (p.173, Ocean-scale modeling vs distribution, abundance, seasonal dynamics); Deibel & Daly; 2007 (p.271, Table 1, 2, 3, Rem.: Arctic polynyas); Slagstad & Tande, 2007 (p.2702, overwintering structure & resilience); Kattner & al., 2007 (p.1628, Table 1, Rem.: p.1634, seasonal pulsing phytoplankton vs dominance); Cook & al., 2007 (p.757, Naupliar development times); Bonnet & al., 2007 (p.313, histology digestive epithelium vs diapause); Walkusz & al., 2007 (p.43); Ferrari & Dahms, 2007 (p. 64, Rem.: diapause; p.107); B.H. Hansen & al., 2007 (p.250, biology molecular); Magnusson & al., 2007 (p.67, bioaccumulation of PCB); Helaouët & Beaugrand, 2007 (climate change sffects); Orlova & al., 2007 (p.145, climate effects); Falk-Petersen & al., 2007 (p.147, Table 9.1); Stenevik & al., 2007 (p.2672, egg production); Broms & Melle, 2007 (p.2760, seasonal development vs phytoplankton bloom); Daase & al., 2007 (p.903, abundance/T°S); Blachowiak-Samolyk & al., 2007 (p.2716, Table 2); Hirche & Kosobokova, 2007 (p.2729, geographic distribution, expatriation); Mayor & al., 2007 (p.91, hatcing vs pH); Head & Sameoto, 2007 (p.2686, abundance vs interdecadal variability); Christie & al., 2008 (p.526, genetic); Hansen B.H. & al., 2008 (p.115, endocrinology); Teegarden & al., 2008 (p.33, Rem.: feeding and toxicity); Saage & al., 2008 (p.162, nutrition); Yen & al., 2008 (p.283, Rem.: kinematic); Johnson C.L. & al., 2008 (p.339, dormancy patterns): Gaard & al., 2008 (p.59, Table 1, N Mid-Atlantic Ridge); Heath & al., 2008 (p.39, Rem.: spatial demography); Pasternak & al., 2008 (p.2245, Table 1, 2, 3, grazing); Jensen & al., 2008 (p.99, pyrene effect); Søreide & al., 2008 (p.2225, feeding strategy); Hansen & al., 2008 (p.157, naphthalene effect, mol. biol.); Jonasdottir & al., 2008 (p.471, figs. 5, 6, 7, 8, 9, Tables 1, 2, 3; Rem.: production); Hansen B.H. & al., 2008 (p.115, lipid/reproduction); Madsen & al., 2008 (p.177, egg production); Madsen & al., 2008 (p.63, development, production); Falk-Petersen & al., 2008 (p.2275, depth distribution); Blachowiak-Samolyk & al., 2008 (p.2210, Table 2, 3, 5, fig.4, biomass, composition vs climatic regimes); Kimmel & Sultan, 2008 (p.111, NAO effect); Pepin & al., 2008 (p.1, 9, figs. 21, 23, 24, 26, 30, 31, 32, interannual variations); DFO, 2008 (p.1, fig.4: interannual variations); Gislason & al., 2008 (p.72, abundance, feeding, egg production); Campbell, 2008 (p.55, overwintering habitat); Ohman & al., 2008 (p.1643, mortality vs predation); Tarrant & al., 2008 (p.193, gene vs diapausing); Harvey & Devine, 2009 (p.3, interannual variation); Johnson C.L. & al., 2008 (p.339, dormancy patterns); Helaouët & Beaugrand, 2009 (p.1235, fig.3, 4, 5); Telesh & al., 2009 (p.18: Table 2.1); Mayor & al., 2009 (p.505, egg production vs diets); 2009 a (p.511, egg production); Calliari & Tiselius, 2009 (p.111); Plourde & al., 2009 (p.371, mortality & survival); Plourde & al., 2009 a (p.1942, mortality vs Atlantic zones); Norrbin & al., 2009 (p.1945, Table 4, 5, abundance); Pepin & Head, 2009 (p.989, vertical distribution vs season, lipid contents); Kosobokova & Hirche, 2009 (p.265, Table 4, fig.11: chart, biomass); Hansen B.H. & al., 2009 (p.131, genetic expression); Dvoretsky & Dvoretsky, 2009 a (p.11, Table 2, abundance); DFO, 2009 (p.1, Rem. p.9, figs.11, 12, 13, seasonal change, interannual variation); Mackas & Beaugrand, 2010 (p.296, figs.11, 12); Beaugrand & Kirby, 2010 (p.1268, fig.3, 4); Petursdottir & al., 2010 (p.1, fatty acid); ; Head & Pepin, 2010 (p.1633, inter-decadal variability); Pershing & al., 2010 (p.1661, interannual variability); Templeton, 2010 (p.1, p.15: fig.12, interannual variability); Leandro & al., 2010 (p.88, biotoxin trophic transfer); Hansen B.H. & al., 2010 (p.212, chemical polluant); Gaardsted & al., 2010 (p.1465, abundance distribution vs advection); Medellin-Mora & Navas S., 2010 (p.265, Tab. 2); Kwasniewski & al., 2010 (p.72, Table 2, abundance vs hydrography); Arendt & al., 2010 (p.49, egg & faecal pellets production vs. environmental conditions); Dünweber & al., 2010 (p.11, biomass, gut content); Hirst & al., 2010 (p.2193, sex ratio); Vogedes & al., 2010 (p.1471, lipid sac area vs lipid content); Dvoretsky & Dvoretsky, 2010 (p.991, Table 2); 2011 a (p.1231, Table 2: abundance, biomass); Gaardsted & al., 2010 (p.480, abundance vs deep water winter); Dvoretsky V.G., 2011 (p.361, abundance, stage composition); 2011 b (p.469, Table A, abundance, biomass); Jonasdottir & Koski, 2011 (p.85, vertical distribution, production); Tang & al., 2011 (p.77, composition & biomass); Maps & al., 2011 (p.183, seasonal & diel migration vs water circulation); Hansen B.H; & al., 2011 (p.704, ecotoxicology); Hirche & Kosobokova, 2011 (p.2359, Table 3, abundance, biomass %); Kosobokova & al., 2011 (p.29, Table 2, 3, figs.4, 6, Rem.: Arctic Basins); Colombo-Hixson & al., 2011 (p.115, lipid & fatty acid composition / fish); Leu & al., 2011 (p.18, biomass vs monthes); Pomerleau & al., 2011 (p.1779, Table III, IV, V, VI); Arendt, 2011 (p.1, Fig.10, fecal pellets); Arendt & al., 2011 (p.1526, clearance rate, fecal pellet production, egg production); Pepin & al., 2011 (p.273, Table 2, seasonal abundance); Swalethorp & al., 2011 (p.429, grazing, egg production and life strategies); Turner & al., 2011 (p.1066, Table I, II, figs.10, 13, abundance 1998-2008); Fields & al., 2011 (p.1, grazing vs UV radiation); Gaardsted & al., 2011 (p.1477, vertical distribution vs hydrography); Jonasdottir & al., 2011 (p.1943, egg & faecal pellet production vs fatty acids & sterols diet); Bogevik & al., 2011 (p.781, oil vs fish); Hjorth & Nielsen, 2011 (p.1339, fecal pellets production, egg production); Aruda & al., 2011 (p.665, protein expression vs diapausing); Van Ginderdeuren & al., 2012 (p.10, 17: Rem.); Pond, 2012 (p.443, Rem.: p.445, wax esters); Carstensen & al., 2012 (p.951, Fig.2, 8, biomass); Lauritano & al., 2012 (p.22, Table 1, 2, gene/polluants); Dalpadado & al., 2012 (p.1, abundance vs climate change); Sigurdardottir, 2012 (p.1, Table 2.3, annual abundance, feeding activity, fecundity); Tammilehto & al., 2012 (p.165, nutition, algal toxicity); Johnson C & al., 2012 (p.1, 15, figs. 19, 20a, 20b, 21, 23a, 23b, 25b, 26b, 28, 29, interannual variarions); Fields & al., 2012 (p.1, behavioral sensitivity and escape reaction); Pasternak & al., 2012 (p.377, feeding rate); Dvoretskii & Dvoretskii, 1912 (p.563, biomass variation vs time-series vs NAO index); Hansen B.H. & al., 2012 (p.38, toxicity of oil spilled); Klok & al., 2012 (p.24, ecotoxicology); Dvoretsky & Dvoretsky, 2012 (p.1321, Table 2, 3, 4, 5, abundance, biomass, production); Trudnowska & al., 2012 (p.18, Table 1, abundance vs. hydrography); McGinty & al., 2012 (p.122, time series abundance); Koski & al., 2012 (p.643, hatching success vs. food environment); Kwasniewski & al., 2012 (p.890, interannual variability); Davies & al., 2012 (p.614, energy content vs methods); Lenz & al., 2012 (p.110, lipid-rich, lipid-poor, molecular biology vs environmental cues); Head & al., 2012 (p.281, egg production vs. Labrador sub-region); Parrish & al., 2012 (p.356, nutrition, lipids vs protists); Ji & al., 2012 (p.40, Table 1, fig.2: development, life history, biogeography); Svensen & al., 2012 (p.39, faecal pellets vs degradation); Jensen L.K. & al., 2012 (p.225, bioaccumulation of hydrocarbons); Teerawanichpan & Qiu, 2012 (p.227-236, molecular analysis, amino acid sequence, lipid composition); Eilertsen & al., 2012 (p.508, oil extracted vs human dietary); Berge & al., 2012 (p.191, evolution vs predation pressure by extinct baleen whales); Hjøllo & al., 2012 (p.508, figs.1-8, abundance, biomass, production vs modelling); Alvarez-Fernandez & al., 2012 (p.21, Rem.: Table 1); Demontigny & al., 2012 (p.221, Table II, fig.5, abundance, prey by ichthyoplankton); Kjellerup & al., 2012 (p.87, egg , fecal pellet production vs temperature & food); Maps & al., 2012 (p.36, dormancy vs. modelling); Møller & al., 2012 (p.211, development time vs temperature & food); Miljetig & al., 2013 (p.14426, phototaxis behaviour vs. oil polluant); Gusmao & al., 2013 (p.279, Table 3, sex-specific predation by fish); Helaouët & al., 2013 (p.1, long-term changes abundance; 1958-2008); Hansen B.H. & al., 2013 (p.1577, metabolism); Colombo-Hixson & al., 2013 (p.687, aquaculture meal); Hsiao & Fang, 2013 (p.175, Table 2: Hg bioaccumulation); Pasternak & al., 2013 (p.547, egg production); Pepin & al., 2013 (p.371, drift effects, seasonal variations); Olsen A.J. & al., 2013 (p.2045, mortality, reproduction vs. dispersed oil effects); Unal & al., 2013 (p.76, analysis of gene expression patterns); Christie & al., 2013 (p.165, diel migration, diapause vs molecular analysis); Head E.J.H. & al., 2013 (p.46, population dynamics vs geographic regions); Christie & al., 2013 (p.117, peptidergic system); Pierson & al., 2013 (p.504, dormancy duration vs temperature); Zamora Terol, 2013 (p.97: fig.3, abundance, biomass); Peijnenburg & Goetze, 2013 (p.2765, Table 1, genetic data); Kürten & al., 2013 (p.167, Table 1, C:N, fatty acid); Pepin, 2013 (p.119, fig.3, abundance vs transect); Hansen B.W. & al., 2013 (p.276, toxicity effect, gene expression); Maar & al., 2013 (p.24, spatial distribution, long-term changes); Beaugrand & al., 2013 (p.75, climate change effects); Broch & al., 2013 (p.84, toxic dispersion effects vs biomass); Wilson R.J. & al., 2013 (p.438, Rem. p.439: lipid vs diapause, buoyancy); Kwasniewski & al., 2013 (p.83, Table 2, 3, abundance); Aubert & al., 2013 (p.19, CNP, lipids); Grenvald & al., 2013 (p.184, hatching success vs. pyrene toxicity); Lidvanov & al., 2013 (p.290, Table 2, % composition); Pedersen S.A. & al., 2013 (p.7481, pCO2 effects vs survival, growth, development); Basedow & al., 2013 (p.72, abundance vs. multinet, LOPC & VPR, vertical distribution); Dvoretsky & Dvoretsky, 2013 a (p.205, Table 2, % abundance); Arendt & al., 2013 (p.105, fig.3, abundance) ; Barton & al., 2013 (p.522, Table 1: metabolism, diapause, population dynamic, feeding mode, biogeo)); Lenz & al., 2014 (p.1, molecular biology vs. lipids synthesis vs. environmental diet); Miljeteig & al., 2014 (p.16, irradiance sensitivity, behavior); Daase & al., 2014 (p.129, fig.1, 2, mortality, carcasses, Table III, IV: abundance vs depth); Melle & al., 2014 (p.244, life history vs. environmental factors); Tarrant & al., 2014 (p.1, lipid storage & moult /last stage); Nielsen & al., 2014 (p.1299, discrimination with C. glacialis); Batnes & al., 2015 (p.51, Rem.); Tarrant & al., 2016 (p.1157, metabolism vs. development & diapause); Miesner & al., 2016 (p.564, grazing, fecundity vs. feeding on domoic acid from diatom); Espinasse & al., 2016 (p.604, Table 1, abundances vs. cod larvae); Albouy-Boyer & al., 2016 (p.589, Table III, fig.4, 6, life cycle model vs. environmental factors); Møller & al., 2016 (p.1206, egg production vs northern border); Eriksen & al., 2017 (p.206, recent warming water, Barents Sea); Häfker & al., 2017 (p.2194, vertical migration vs. circadian clock genes); Aarflot & al., 2017 (p.2342, biomass); Baumgartner & Tarrant, 2017 (p.387, figs. 2, 3, Table 1, diapause, Rem.); El Arraj & al., 2017 (p.272, table 2 as Calocalanus finmarchicus, spatial distribution, no in fig.6); Record & al., 2018 (p.2238, Table 1: diapause); Belmonte, 2018 (p.273, Table I: Italian zones: mainly Tyrrhenian Sea); Weydmann & al., 2018 (p.172, development vs. warming subarctic waters); Møller & Nielsen, 2019 (p.1, biomass vs. sea ice cover changing). | | | | NZ: | 5 + 2 douteuses | | |
|
Carte de distribution de Calanus finmarchicus par zones géographiques
|
| | | | | | | | | 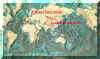 Carte de 1996 Carte de 1996 | |
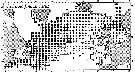 issued from : R. Williams in Bull. mar. Ecol., 1972, 8. [p.55, Fig.1]. issued from : R. Williams in Bull. mar. Ecol., 1972, 8. [p.55, Fig.1].
Ditribution of stages V and VI in the North Atlantic from the Continuous Plankton Recorder.
The chart show the average abundance and distrubution derived from more than 43.000 samples taken a depth of 10 m during 1958 to 1968. The samples were assigned to rectangles of 1° lat. by 2° long. The boundary of the sampled area (defined as those rectangles sampled in more than 5 months) is shown by the straight lines in the chart; within this area the average abundance in each rectangle is shown by circular symbols; the presence of the species in the occasional samples outside this area is indicated by plus signs. The absence (in the sampled area) indicates that the species was not found in CPR.
large and small filled in circles and open circles, respectively, are used to indicate the following categories of abundance (average numbers per sample of 3.3 m3: >6.4 : 6.4-1.7 : <1.7 |
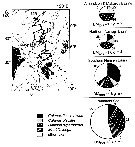 issued from : N. Mumm, H. Auel, H. Hanssen, W. Hagen, C. Richter & H.-J. Hirche in Polar Biol., 1998, 20. [p.192, Fig.1, p.194, Fig.3] issued from : N. Mumm, H. Auel, H. Hanssen, W. Hagen, C. Richter & H.-J. Hirche in Polar Biol., 1998, 20. [p.192, Fig.1, p.194, Fig.3]
Fig.1 after Diepenbroek & al., 1997; Station map, the dark line connects stations of different expeditions to a transpolar transect (AB: Amundsen Basin, BS: Barents Sea; GL: Greenland; GS: Greenland Sea; LR: Lomonov Ridge; MB: Makarov Basin; MJP: Morris Jessup Plateau; NB: Nansen Basin; NG: Nansen-Gakkel Ridge; SB: Spitsbergen; WSC: West Spitsbergen Current; YP: Yermak Plateau
Fig.3: Biomass share (% of total mesozooplankton dry mass) of Calanus finmarchicus, C. glacialis, C. hyperboreus, Metridia longa and other taxa in 0- to 500 m depth of different Arctic regions (DM total: mean total dry mass).
Note the co-occuring of the three species, but the the different abundance according to the basins.
C. finmarchicus reached a maximum abundance in the WSC, this form was the dominant species in the West Spitsbergen Current and south of the central Nansen Basin. |
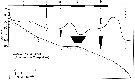 issued from : J.T. Turner & M.J. Dagg in Biol. Oceanogr., 1983, 3 (1). [p.18, Fig.8]. issued from : J.T. Turner & M.J. Dagg in Biol. Oceanogr., 1983, 3 (1). [p.18, Fig.8].
Vertical and inshore-offshore distributions of Calanus finmarchicus in relation to the 15°C isotherm at pump stations on the Long Island (NW Atlantic) transect (40°31.8'-39°53.2' N, 72°23.6'-72°59.4' W; October 1978).
Station numbers are given on the top axis, and dark horizontal bars identify stations sampled at night. |
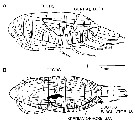 issued from : K.S. Tande & C.C.E. Hopkins in Mar. Biol., 1981, 63. [p.161, Fig.3]. issued from : K.S. Tande & C.C.E. Hopkins in Mar. Biol., 1981, 63. [p.161, Fig.3].
Calanus finmarchicus( from 69°21'N, 19°16'E): A, left lateral view of genital system in male copepodite V (26 November 1977); B: dorsal view of genital system in more advanced male copepodite stage V (31 January 1977). |
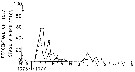 issued from : K.S. Tande & C.C.E. Hopkins in Mar. Biol., 1981, 63. [p.162, Fig.7]. issued from : K.S. Tande & C.C.E. Hopkins in Mar. Biol., 1981, 63. [p.162, Fig.7].
Calanus finmarchicus( from 69°21'N, 19°16'E): Seasonal variation in proportion of males (November 1976 to December 1977 in copepodite satges V and VI.
Black circle: copepodite stage V males; white circle: copepodite stage VI; square : absent.
The copepodite stage IV cannot be separated into males and females owing to the gonad being still sexually undifferentied. The gonad of copepodite stage V in its most immature condition resembles that seen in copepodite stage IV, whereas the sex of stage V copepodites with mature gonads can be easily determined. The genital ducts are the key characters for separating males and females. It appears that the stage V males represent a situation where the right genital duct has degenerated (see Lowe, 1935).
The adult sex-ratios often favour females, and the highest proportion of males often coincides with the time of fertilization. The females appear to undergo a longer and more extensive development of the reproductive system than males in copepodite stage V.
The pre-adult gonad maturation process in C. finmarchicus seems to be an adaptation to overwintering so that spawning can occur as soon as possible after the start of the spring diatom increase. |
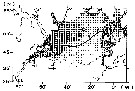 issued from : R. Wulliams in Mar. Biol., 1985, 86. [p.146, Fig.2]. issued from : R. Wulliams in Mar. Biol., 1985, 86. [p.146, Fig.2].
Calanus finmarchicus. Annual mean distribution and abundance from sampling at 10 m depth by the Continuous Plankton Recorder. Data for all months sampled from 1960 to 1981. The boudary of the sampled area is shown by straight lines. Position of the 14°C isotherm in August is shown. |
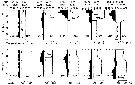 issued from : R. Wulliams in Mar. Biol., 1985, 86. [p.148, Fig.6]. issued from : R. Wulliams in Mar. Biol., 1985, 86. [p.148, Fig.6].
Calanus finmarchicus (a) and C. helgolandicus (b) from Celtic Sea (53°30'N, 07°00'W). Vertical distribution of Copepodite V and VI. Numbers in each night (black) and day (white) hauls are plotted in 5 m depth intervals as percentagges of total numbers (n) present in the haul.
Temperature and Salinity profiles are shown for the day hauls. GMT: Greenwhich Mean Time.
Nota: The two congeneric copepods are morphologically very similar and show little phenotypic divergence. No hybrids are produced between the species which demonstrates that their isolating mechanisms are fully evolved. The only reason that C. finmarchicus, a northern species, is able to persist in the Celtic Sea, which has a sea-surface temperature of ca. 18° C, is because the sea becomes seasonally thermally stratified and a winter sea-temperature is retained below the thermocline. C. finmarchicus is associated with the colder (ca. 8.5° C), more saline water below the thermocline, while is distributed in the warmer, less saline water above the thermocline. When the water comumn is thermally stratified, two separate water masses are formed; the upper wind-mixed and the lower tidally-mixed water. From July into autumn, C. finmarchicus remained below the thermocline , presumably feeding on sedimented and tidally re-suspended particulates, whereas C. helgolandicus remained within the euphotic zone in close association with autotrophic phytoplankton. |
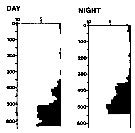 issued from : A. Longhurst & R. Williams in J. Plankton Res., 1979, 1 (1). [p.23, Fig.8a]. issued from : A. Longhurst & R. Williams in J. Plankton Res., 1979, 1 (1). [p.23, Fig.8a].
Day/night percentage numerical profiles at India Station (59°N, 19°W) at end of March 1975.
Depth in meter.
Sampling by LHPRs (Longhurst-Hardy Plankton Recorders). |
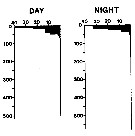 issued from : A. Longhurst & R. Williams in J. Plankton Res., 1979, 1 (1). [p.24, Fig.8b]. issued from : A. Longhurst & R. Williams in J. Plankton Res., 1979, 1 (1). [p.24, Fig.8b].
Day/night percentage numerical profiles at India Station (59°N, 19°W) in early May 1975.
Depth in meter. |
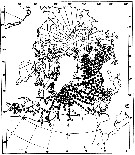 issued from : W.A. Jaschnov in Int. Revue ges. Hydrobiol., 1970, 55 (2). [p.203, Fig.2] issued from : W.A. Jaschnov in Int. Revue ges. Hydrobiol., 1970, 55 (2). [p.203, Fig.2]
Distribution of Calanus finmarchicus from literary sources, and unpublished data.
Solid lines indicate the position of the convergence zones. Arrows denote some of the currents; arrows in the eastern part of the Polar Basin indicate cyclonic circulation of Atlantic waters (after Worthington, 1953). Dark circles indicate occurrence in reproduction areas, semi-dark circles in immigrated areas and white circles in expatriation areas (usual single findings).
Nota: C. finmarchicus is carried eastward with the southern branch of the North Atlantic Current and then southward. It occurs in small numbers in the surface water layers along the coasts of the Iberian Peninsula ans west Madeira (Rose, 1929 and unpublished data) within the area of expatriation. The presence of the species in Mediterranean Sea. The occurrence at stations in the Mediterranean Sea, in the western part, is explained by the penetration of Atlantic surface waters into this region (cf in Remarks). |
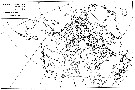 issued from : E.H. Grainger in J. Fish. Bd. Canada, 1961, 18 (5). [p.673, Fig.6]. issued from : E.H. Grainger in J. Fish. Bd. Canada, 1961, 18 (5). [p.673, Fig.6].
Distribution of Calanus glacialis and C. finmarchicus in northern North America.
Circles indicate collection first reported by the author, squares collections described by others (mostly Jespersen, 1934). Arrows denote principal water movements. |
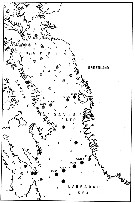 issued from : E.H. Grainger in R. Soc. Canada, Spec. Publs., 1963, 5. [p.77, Fig.5]. issued from : E.H. Grainger in R. Soc. Canada, Spec. Publs., 1963, 5. [p.77, Fig.5].
Baffin Bay and Davis Strait. White circles show stations where C. glacialis occurred without C. finmarchicus, stipped and black circles relative occurrence of all copepodites stages of C. glacialis (stipped) and C. finmarchicus (black) at stations where both species occurred.
Numbers of a few stations are shown. |
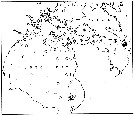 issued from : E.H. Grainger in R. Soc. Canada, Spec. Publs., 1963, 5. [p.78, Fig.6]. issued from : E.H. Grainger in R. Soc. Canada, Spec. Publs., 1963, 5. [p.78, Fig.6].
Hudson Bay and Hudson Strait. White circles show stations where C. glacialis occurred without C. finmarchicus, stipped and black circles relative occurrence of all copepodites stages of C. glacialis (stipped) and C. finmarchicus (black) at stations where both species occurred. |
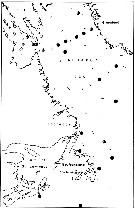 issued from : E.H. Grainger in R. Soc. Canada, Spec. Publs., 1963, 5. [p.79, Fig.7]. issued from : E.H. Grainger in R. Soc. Canada, Spec. Publs., 1963, 5. [p.79, Fig.7].
Labrador and southeast Canadian waters. White circles show stations where C. glacialis occurred without C. finmarchicus, stipped and black circles relative occurrence of all copepodites stages of C. glacialis (stipped) and C. finmarchicus (black) at stations where both species occurred. |
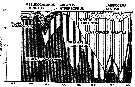 issued from : B.T. Hargrave, G.C. Harding, K.F. Drinkwater, T.C. Lambert & W.G. Harrison in Mar. Ecol. Prog. Ser., 1985, 20. [p.227, Fig.7]. issued from : B.T. Hargrave, G.C. Harding, K.F. Drinkwater, T.C. Lambert & W.G. Harrison in Mar. Ecol. Prog. Ser., 1985, 20. [p.227, Fig.7].
Major species of zooplankton present at the central station in St. Georges Bay (45°45'N, 61°45'W) during 1977.
Nota: All zooplankton collections were made after sunset. The net towed obliquely throughout the water column (± 34 m in depth). |
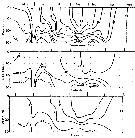 issued from : B.T. Hargrave, G.C. Harding, K.F. Drinkwater, T.C. Lambert & W.G. Harrison in Mar. Ecol. Prog. Ser., 1985, 20. [p.223, Fig.2]. issued from : B.T. Hargrave, G.C. Harding, K.F. Drinkwater, T.C. Lambert & W.G. Harrison in Mar. Ecol. Prog. Ser., 1985, 20. [p.223, Fig.2].
Seasonal profiles of water temperature and salinity in St. Georges Bay (45°45'N, 61°45'W) near the central station during 1977. |
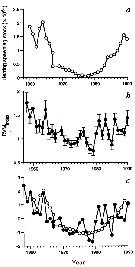 issued from : G.C. Hays in Nature, 1995, 376. [p.650]. issued from : G.C. Hays in Nature, 1995, 376. [p.650].
a: the estimated spawning stock of herring (Clupea harengus), after A. Corten & G. van de Kamp, 1992, in the North Sea during 1960-1990. Herring spawning-stock size in millions of tonnes.
b: The normal diel vertical migration (DVM) behaviour of C5-C6 Calanus finmarchicus in the North Sea (54°-60°N, 3°W-10°E).
c: The two time series in a and b reduced to zero mean and unit variance to facilite visual comparison.
Nota: The normal DVM behaviour of copepodite stages C5-C6 of C. finmarchicus co-varied with the abundance of herring. The implication is that in those years when herring were abundant, a smaller proportion of C. finmarchicus occurred near the surface during the day because of the increased risk of mortality. |
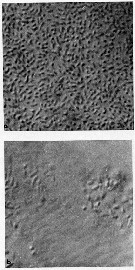 issued from : G.A. Harding in Limnol. Oceanogr., 1973, 18 (4). [p.671, Fig.1]. issued from : G.A. Harding in Limnol. Oceanogr., 1973, 18 (4). [p.671, Fig.1].
Examples of selected copepod tissues (Calanus finmarchicus) stained with carbol thionin (see Baker, 1967) to demonstrate the presence or absence of bacteria (non classified).
Photographs taken through a Zeiss compound microscope using Nomarsky interference lightting;
a: Bacteria on chitin after 2 days. Calanus incubated at 20-22 °C.
b: Bacteria between muscle sheets.
Nota: Killed copepods decomposed within 11 days in 4°C Halifax water and within 3 days in 22 °C Sargasso Sea water. In both cases initial infection occurred on the exoskeleton and apparently progrssed into the organisms through the mouth. The urosome and internal extremities were the last to be attacked.
Rod-shaped bacteria were responsable for the degradation of dead Calanus in the surface water collected off Nova Scotia and Bermuda (for example specimens damaged when caught in nets or from natural causes). It is unlikely that the copepod's normal intestinal flora contribute significantly to this decomposition. Temperature has a large effect on rrate of decomposition. Although the bacteria were superficially alike, in Sargasso Sea (water at 20-22 °C) decomposition was 4 times as rapid as at 4 °C in coastal Halifax water. Autolysis of copepod tissues after death does not appear to have an observable effect on carcass appearances although it may aid bacterial effect. |
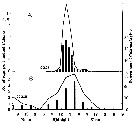 issued from : J.P. Harding, S.M. Marshall & A.P. Orr in Nature, Lond., 1951, 167 (4258). [p.953] issued from : J.P. Harding, S.M. Marshall & A.P. Orr in Nature, Lond., 1951, 167 (4258). [p.953]
.Time of egg-laying for Calanus finmarchicus at Millport (SW Scotland). The continuousline represents the number of eggs laid per hour (A) or in 3 hr (B). The verical columns represent the percentage of Calanus laying.
Nota: In diagram A: 68 ù spawned between midnight and 3 a.m. and the bulk of the rest by 4 a.m. Only 5 of the 10d individuals did not lay. The average number of eggs was very constant at about 40 per female. This result might have been caused by the shock of capture and examination, or by the sudden reduction of pressure (specimens captured between 50 and 100 m at 4 p.m., examination at about 6 P.m.), acting after an interval of about 8 hours.
Diagram B shows that laying was still concentrated in the early hours of the morning. The peak is not so marked, possibly because of the longer period of starvation. It has been found that the number of eggs laid by Calanus is closely dependent on the amount of food available.
The eggs are heavier than sea water and sink about 36 m hr., which is about the minimum time it takes for the eggs to hatch. |
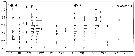 issued from : S. Eriksson in ZOON, 1973, 1. [p.46, Fig.9]. issued from : S. Eriksson in ZOON, 1973, 1. [p.46, Fig.9].
Size distribution of adult females of Calanus finmarchicus (offshore station H6:11°30'N, 57°40'.5, The Kattegatt) during 1969-70 in the main series. |
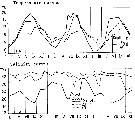 issued from : S. Eriksson in Mar. Biol., 1974, 26. [p.320, Figs. 2-3] issued from : S. Eriksson in Mar. Biol., 1974, 26. [p.320, Figs. 2-3]
Salinity and temperature curves for main series at offshore station H6 (11°30' N, 57°40'.5 E, The Kattegatt) from March 1968 to November 1970. |
 issued from : I.A. McLaren, M.J. Tremblay, C.J. Corkett & J.C. Roff in Can. J. Fish. Aquat. Sci., 1989, 46. [p.565, Fig.3]. issued from : I.A. McLaren, M.J. Tremblay, C.J. Corkett & J.C. Roff in Can. J. Fish. Aquat. Sci., 1989, 46. [p.565, Fig.3].
Annual cycle of Calanus finmarchicus on Browns Bank (42°35'N, 65°50'W), April 1984 to Febriary 1985.
Successive generations labelled Go, etc. Upper panel: abundances as proportions of stages (AD: adults; males clear section of adult bar). Lower panel: numbers of CIV, CV, and adult females in arbitrary subsamples from samples.
The samples were obtained by vertical hauls from near bottom (usually 70-80 m) by Hensen-type nets (one of 0.202 mm mesh and the other of 0.064 mm mesh). |
 issued from : I.A. McLaren, M.J. Tremblay, C.J. Corkett & J.C. Roff in Can. J. Fish. Aquat. Sci., 1989, 46. [p.565, Fig.4]. issued from : I.A. McLaren, M.J. Tremblay, C.J. Corkett & J.C. Roff in Can. J. Fish. Aquat. Sci., 1989, 46. [p.565, Fig.4].
Annual cycle of Calanus finmarchicus on Emerald Bank (43°30'N, 63°00'W), 1979-80.
Successive generations labelled Go, etc. For convenience, Nov. 1979 sample placed at end. Upper panel: proportions of stages (AD: adults). Lower panel: size-frequencies of adult females.
The samples were obtained by vertical hauls from near bottom (usually 25 m) by Hensen-type nets (one of 0.250 mm mesh and the other of 0.064 mm mesh). |
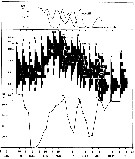 issued from : I.A. McLaren inJ. Fish. Res. Board Can., 1978, 35. [p.1336, Fig.4]. issued from : I.A. McLaren inJ. Fish. Res. Board Can., 1978, 35. [p.1336, Fig.4].
Life cycles of Calanus finmarchicus in Loch Striven (55°55'N, 05°10'W).
Relative abundance of C V as a percentage of all copepodids (lower panel); size and numbers per haul (including combined hauls from 60 m to 10 m and 10 to 0 m) of adult females (middle panel), and percentage of nauplii and copepodids above 10 m (from split hauls, taken from 60 to 10 m and 10 to 0 m) (upper panel).
Successive generations as infered from peaks in the C V cohorts and size changes designated as Go, G1, etc.
Data from Marshall (1949, tables I and II). |
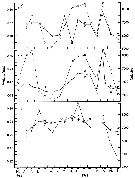
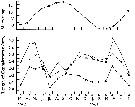 issued from : G.W. Comita, Marshall S.M. & Orr A.P. in J. mar. biol. Ass. U.K., 1966, 46. [p.12, Fig.5]. issued from : G.W. Comita, Marshall S.M. & Orr A.P. in J. mar. biol. Ass. U.K., 1966, 46. [p.12, Fig.5].
Monthly temperature (above) and length of cephalothorax (below) in mm of Calanus finmarchicus female (open circles), male (crosses) and stage V (full circles) , 1962-1963, from Bute Channel (SW Scotland).
Nota: length is not necessarily correlated with weight or calorific value, although in 1962-63 it also showed three maxima during the period usually coinciding with the weight maxima.
The length of males, for instance, was much the same at all three maxima, although the weight and calorific value differ widely.
Females increased slightly in length at the time of their weight and caloric minimum and stage V showed no mid-winter increase in length but rather a fall. |
 issued from : G.W. Comita, Marshall S.M. & Orr A.P. in J. mar. biol. Ass. U.K., 1966, 46. [p.10, Fig.4, D]. issued from : G.W. Comita, Marshall S.M. & Orr A.P. in J. mar. biol. Ass. U.K., 1966, 46. [p.10, Fig.4, D].
Weights of Calanus finmarchicus male (crosses), female (open circles) and stage V (full circles), 1962-63, from Bute Channel (SW Scotland). |
 issued from : G.W. Comita, Marshall S.M. & Orr A.P. in J. mar. biol. Ass. U.K., 1966, 46. [p.6, Fig.2]. issued from : G.W. Comita, Marshall S.M. & Orr A.P. in J. mar. biol. Ass. U.K., 1966, 46. [p.6, Fig.2].
Weight and calories per g Calanus finmarchicus male (crosses), female (open circles) and stage V (full circles), 1962-63, from Bute Channel (SW Scotland), by bomb calorimeter. |
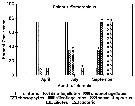 Issued from : J.L. Urban, McKenzie C.H. & Deibel D. in Mar. Ecol. Prog. Ser., 1992, 84. [p.262, Fig.21]. Issued from : J.L. Urban, McKenzie C.H. & Deibel D. in Mar. Ecol. Prog. Ser., 1992, 84. [p.262, Fig.21].
Calanus finmarchicus from Logy Bay, Newfoundland, Canada). Percent occurrence in the fields viewed per faecal pellet of phytoplankton species within general taxonomic groups at each sampling date. * At least 1 identifiable heterotrophic species was found in this group. |
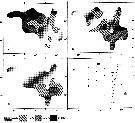 Issued from : A. Hassel in Biol. og kjem. oceanografi, 1983, BKO 8308. [p.6, Fig.4]. Issued from : A. Hassel in Biol. og kjem. oceanografi, 1983, BKO 8308. [p.6, Fig.4].
Relative distribution of copepodite stage I-III of Calanus finmarchicus from 0-200 m depth, in percent of total numbers of copepodites. 5-12 May 1981. Stations are indicated to lower right. |
 Issued from : A. Hassel in Biol. og kjem. oceanografi, 1983, BKO 8308. [p.7, Fig.5]. Issued from : A. Hassel in Biol. og kjem. oceanografi, 1983, BKO 8308. [p.7, Fig.5].
Main surface currents in the western Barents Sea. |
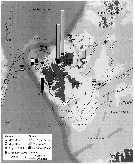 Issued from : J.E. Søreide, S. Falk-Petersen, E.N. Hegseth, H. Hop, M.L. Carroll, K.A. Hobson & K. Blachowiak-Samolyk in Deep-Sea Res., II, 2008, 55. [p.2228, Fig.1]. Issued from : J.E. Søreide, S. Falk-Petersen, E.N. Hegseth, H. Hop, M.L. Carroll, K.A. Hobson & K. Blachowiak-Samolyk in Deep-Sea Res., II, 2008, 55. [p.2228, Fig.1].
Study sites in the Svalbard region. The biomass (dry-weight b/m2) of the population of Calanus hyperboreus, C. glacialis and C. finmarchicus (CI-adult) is shown for the main sampling locations (data from Stn. NK2 is missing) and the Atlantic and Arctic water masses are indicated by arrows (WCS: west Spitsbergen Current). The location of the ice edge (defined as 30% ice concentrations) is indicated for selected dates.
Nota: Stable isotope and fatty acid trophic marker techniques were employed together to assess trophic level, carbon sources (phytoplankton vs. ice algae), and diet of the three Calanus species.
Patterns in absolute fatty acid and fatty alcohol composition revealed that diatoms were the most important food for C. hyperboreus and C. glacialis, followed by Phaeocystis, whereas diatoms, Phaeocystis and other small autotrophic flagellates were equally important for C. finmarchicus. |
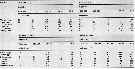 Issued from : S. Falk-Petersen & al. in Deep-Sea Res., 2008, 55. [p.2282, Table 5]. Issued from : S. Falk-Petersen & al. in Deep-Sea Res., 2008, 55. [p.2282, Table 5].
Arctic Ocean, Ice Stations 1 (82°N, 11°E) on 2 September 2004, and 2 (82°30'N, 21°E) on 4 September 2004: Depth distribution of mesozooplankton in the upper 1200 m. |
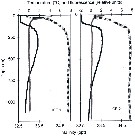 Issued from : S. Falk-Petersen & al. in Deep-Sea Res., 2008, 55. [p.2281, Fig.8]. Issued from : S. Falk-Petersen & al. in Deep-Sea Res., 2008, 55. [p.2281, Fig.8].
Arctic Ocean, Ice Stations 1 (82°N, 11°E) on 2 September 2004, and 2 (82°30'N, 21°E) on 4 September 2004: Temperature (black profile), relative fluorescence values (red line), salinity (dotted line). |
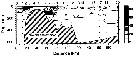 Issued from : K.W. Tang, T.G. Nielsen, P. Munk, J. Mortensen, E.F. Møller, K.E. Arendt, K. Tönnesson, T. Juul-Pedersen in Mar. Ecol. Prog. Ser., 2011, 434. [p.83, Fig.4] Issued from : K.W. Tang, T.G. Nielsen, P. Munk, J. Mortensen, E.F. Møller, K.E. Arendt, K. Tönnesson, T. Juul-Pedersen in Mar. Ecol. Prog. Ser., 2011, 434. [p.83, Fig.4]
Calanus finmarchicus (from the continental slope off Fyllas Bank to the inner part of Godthabsfjord, SW Greenland, corresponding to stations 0 to 20) in the summer (2008).
Contour plots of biomass (mg C/m3) of all developmental stages collected from 4 to 9 strata with a multinet samples (300 µm mesh aperture)
Dots are mid-points of sampling intervals. Numbers on top are stations. Hatched area = bottom topography.
Compare this distribution with the other dominant large zooplankton species Calanus glacialis, Calanus hyperboreus and Metridia longa for the same transect. |
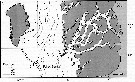 Issued from : K.W. Tang, T.G. Nielsen, P. Munk, J. Mortensen, E.F. Møller, K.E. Arendt, K. Tönnesson, T. Juul-Pedersen in Mar. Ecol. Prog. Ser., 2011, 434. [p.79, Fig.1] Issued from : K.W. Tang, T.G. Nielsen, P. Munk, J. Mortensen, E.F. Møller, K.E. Arendt, K. Tönnesson, T. Juul-Pedersen in Mar. Ecol. Prog. Ser., 2011, 434. [p.79, Fig.1]
Station positions along Godthabsfjord in southwestern Greenland. |
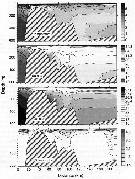 Issued from : K.W. Tang, T.G. Nielsen, P. Munk, J. Mortensen, E.F. Møller, K.E. Arendt, K. Tönnesson, T. Juul-Pedersen in Mar. Ecol. Prog. Ser., 2011, 434. [p.81, Fig.2] Issued from : K.W. Tang, T.G. Nielsen, P. Munk, J. Mortensen, E.F. Møller, K.E. Arendt, K. Tönnesson, T. Juul-Pedersen in Mar. Ecol. Prog. Ser., 2011, 434. [p.81, Fig.2]
Contour plots of water temperature (°C), salinity, density (kg/m3) and chlorophyll a (mg/m3) along the transect of Godthabsfjord.
Distances were measured from Station o. Note the different contour line scales for different panels.
Hatched area in each panel represents bottom topography. |
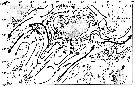 iSsued from : A. Gislason & O.S. Astthorsson in ICES J. Mar. Sci., 2000, 57 (6). [p.1728, Fig.1]. iSsued from : A. Gislason & O.S. Astthorsson in ICES J. Mar. Sci., 2000, 57 (6). [p.1728, Fig.1].
Map of the study area southwest of Iceland showing the sampling stations and the positions od the two transects.
Inserted on the figure are the main ocean currents in the upper layers, adapted from Valdimarsson & Malmberg (1999), and the main overflow paths over the Greenland-Scotland Ridge, adapted from Hansen & al. (1998).
Grey arrows, Atlantic Water; black arrows, Polar Water; black broken arrows, mixed water; grey broken arrows, main overflow paths.
Based on CPR data, the distribution area of C. finmarchicus in the North Atlantic may be divided into two main centres of high abundance, one in the Labrador Sea and the other in the Norwegian Sea. Analysis of individuals from both sides of the North Atlantic has revealed genetic differentiation between the main distribution centres (See in Bucklin & al., 1996). Iceland is situated at the boundary between those two centres, and the current system in the North Atlantic suggests that C. finmarchicus may be advected to deep water southwest of Iceland from both these areas. |
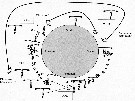 Issued from : Ø. Fiksen in ICES J. Mar. Sci., 2000, 57 (6). [p.1827, Fig.1]. Issued from : Ø. Fiksen in ICES J. Mar. Sci., 2000, 57 (6). [p.1827, Fig.1].
A general overview of how the lfe cycle alternatives are modelled. Depending on which day the copepods wake up (WUD), switch allocation pattern (AFD), and reach its fat-soma ratio (FSR), the life cycle may consist of one or several generations, and a long or short diapause.
Nota : In environments with strong and variable seasonal fluctuations, organisms are selected on the basis of their phenology, such as the timing of diapause, reoroduction, or assembling of storage products.
A simulation model of the dynamic balance of various phenologies within a population facing density-dependence and varying annual, environmentaly determined growth opportunities is presented by the author.
The main assumption is that the timing of phenological events is heritable and cued by a single signal (day length).Then, the balance between alternative strategies is regulated by natural selection and reproduction success.
The model is developed for C. finmarchicus, which must decide when to start preparing for diapause by allocating to storage rather than somatic growth, how much storage (lipids) to bring with it during wintering and when to ‘’wake up’’ to complete development and to reproduce. |
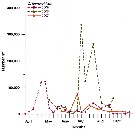 Issued from : V. Sigurdardottir inmaster's thesis, Faculty of Life and Environmetal Sciences, Univ. of Iceland, Reykjavik: 2012. [p.27, Fig.2.5]. Issued from : V. Sigurdardottir inmaster's thesis, Faculty of Life and Environmetal Sciences, Univ. of Iceland, Reykjavik: 2012. [p.27, Fig.2.5].
Total abundance (number/m2) of Calanus finmarchicus from Breidafjördur (W Iceland) during spring and summer 2007, 2008 and 2009.
Collected with WP-2 net, towed vertically from the bottom to surface. |
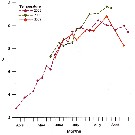 Issued from : V. Sigurdardottir inmaster's thesis, Faculty of Life and Environmetal Sciences, Univ. of Iceland, Reykjavik: 2012. [p.21, Fig.2.2]. Issued from : V. Sigurdardottir inmaster's thesis, Faculty of Life and Environmetal Sciences, Univ. of Iceland, Reykjavik: 2012. [p.21, Fig.2.2].
Average temperatiure from 0-50 meter depth from Breidafjördur (W Iceland) during spring and summer 2007, 2008 and 2009.
Numbers are average from measurements of both stations. |
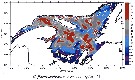 Issued from : S. Plourde & I. McQuinn inSecr. can. de consult. sci. du MPO Doc. de rech. 2009/104, 2010. [p.25, Fig.9]. Issued from : S. Plourde & I. McQuinn inSecr. can. de consult. sci. du MPO Doc. de rech. 2009/104, 2010. [p.25, Fig.9].
Biomasse moyenne de C. finmarchicus en Juin 1999 dans le Golfe du Saint-Laurent estimée à l'aide du modèle couplé biologique-physique en 3 dimensions.
Nota: Results from 3-D coupled biological-physical model of the copepod C. finmarchicus ran for the uear 1999.
Twelve zoneshave been identified, with the lower estuary, the northern area in the northwest Gulf of St-Lauwrence, the Gaspé Current, the coastal area in the southern Gulf of St-Lawrence (including the Baie-des-Chaleurs), the maximum turbidity zone (middle estuary), and the region extending from the tip of the Gaspé Peninsula into the outer Baie-des-Chaleurs being the most important |
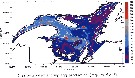 Issued from : S. Plourde & I. McQuinn inSecr. can. de consult. sci. du MPO Doc. de rech. 2009/104, 2010. [p.23, Fig.7]. Issued from : S. Plourde & I. McQuinn inSecr. can. de consult. sci. du MPO Doc. de rech. 2009/104, 2010. [p.23, Fig.7].
Production d'oeufs (indice de production secondaire) moyenne de C. finmarchicus en juin 1999 dans le golfe du Saint-Laurent estimée à l'aide du modèle couplé biologique-physique en 3 dimensions. |
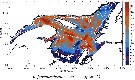 Issued from : S. Plourde & I. McQuinn inSecr. can. de consult. sci. du MPO Doc. de rech. 2009/104, 2010. [p.26, Fig.10]. Issued from : S. Plourde & I. McQuinn inSecr. can. de consult. sci. du MPO Doc. de rech. 2009/104, 2010. [p.26, Fig.10].
Biomasse moyenne de C. finmarchicus en septembre 1999 dans le Golfe du Saint-Laurent estimée à l'aide du modèle couplé biologique-physique en 3 dimensions. |
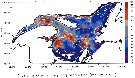 Issued from : S. Plourde & I. McQuinn inSecr. can. de consult. sci. du MPO Doc. de rech. 2009/104, 2010. [p.24, Fig.8]. Issued from : S. Plourde & I. McQuinn inSecr. can. de consult. sci. du MPO Doc. de rech. 2009/104, 2010. [p.24, Fig.8].
Production d'oeufs (indice de production secondaire) moyenne de C. finmarchicus en septembre 1999 dans le golfe du Saint-Laurent estimée à l'aide du modèle couplé biologique-physique en 3 dimensions. |
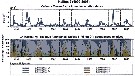 Issued from : DFO Can. Sci. Advis. Sec. Sci. Advis. Rep. 2009/154. [p.10, Fig.12]. Issued from : DFO Can. Sci. Advis. Sec. Sci. Advis. Rep. 2009/154. [p.10, Fig.12].
Time-series (1999-2008) of Calanus finmarchicus abundance and developmental stages at the Halifax-2 fixed station (Nova Scotia). |
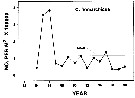 Issued from : DFO in DRO Sci. Stock Status Rep. G3-02 (2000). [p.8]. Issued from : DFO in DRO Sci. Stock Status Rep. G3-02 (2000). [p.8].
Abundance of C. finmarchicus in Emerald Basin (Nova Scotia) during the years 1982 to 1998.
Nota: Compare with Calanus hyperboreus and Calanus glacialis.
See in Sameoto & al., 1997. |
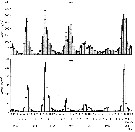 Issued from : V.G. Dvoretskii & A.G. Dvoretskii in Biol. Bull., 2012, 39 (6). [p.567, Fig.3]. Issued from : V.G. Dvoretskii & A.G. Dvoretskii in Biol. Bull., 2012, 39 (6). [p.567, Fig.3].
Dynamics of total zooplankton biomass (a) and Calanus finmarchicus biomass (b) in the upper 50-m water layer in the southern Barents Sea in 1952-1958.
Vertical lines indicate standard errors. |
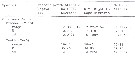 Issued from : A. Fleminger & K. Hulsemann in Mar. Biol., 1977, 40. [p.245, Table 4]. Issued from : A. Fleminger & K. Hulsemann in Mar. Biol., 1977, 40. [p.245, Table 4].
Length of prosome (mm) and number of teeth on coxopodite of P5 in adult females selected at random from samples used to determine urosome pore signature. |
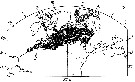 Issued from : A. Fleminger & K. Hulsemann in Mar. Biol., 1977, 40. [p.241, Fig.5 b]. Issued from : A. Fleminger & K. Hulsemann in Mar. Biol., 1977, 40. [p.241, Fig.5 b].
Distribution of Calanus finmarchicus sensu stricto in North Atlantic and adjacent seas based on published litterature (squares: Edinburg Oceanographic Laboratory, 1973; open triangles: Jaschnov, 1970; present records: dots and half-filled circles). Stippled areas approximate inhabited region beyond or at perimeter of North Atlantic Ocean.
Nota: From time to time equivocal determinations of C. finmarchicus from Mediterranean Sea localities have been published. The authors are unaware of any convincing evidence that this species occurs even occasionally in the Mediterranean Sea, although its presence there would not be surprising in view of prevailing circulation of the mixed layer in the Strait of Gibraltar. |
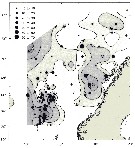 Issued from : E.K. Stenevik, W. Melle, E. Gaard, A. Gislason, C.T.A. Broms, I. Prokopchuk & B. Ellerstsen in Deep-Sea Res. II, 2007, 54. [p.2681, Fig.7]. Issued from : E.K. Stenevik, W. Melle, E. Gaard, A. Gislason, C.T.A. Broms, I. Prokopchuk & B. Ellerstsen in Deep-Sea Res. II, 2007, 54. [p.2681, Fig.7].
Individual daily egg production (eggs/female/day) in Calanus finmarchicus from Norwegian, Icelandic and Faroe Island surveys (25 April-10 June 2003).
Isohalines show integrated chorrophyll a (mg. m2) in the upper 30 m. |
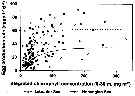 Issued from : E.J.H. Head, W. Melle, P. Pepin, E. Bagøien & C. Broms in Progress in Oceanography, 2013, 114. [p.50, Fig.4]. Issued from : E.J.H. Head, W. Melle, P. Pepin, E. Bagøien & C. Broms in Progress in Oceanography, 2013, 114. [p.50, Fig.4].
Egg production rates (EPRs) of Calanus finmarchicus females in relation to integrated chlorophyll concentration (0-30 m) in the Labrador and Norwegian seas.
Nota: Average individual female egg production rates showed a strong dependence on near surface chlorophyll concentration in both the Labrador and Norwegian seas. The relationships could be described by Ivlev functions, which tended to maximum values of 62 and 35 eggs by female and by day in the Labrador and Norwegian seas, respectively.
Egg production rates showed no obvious relationship with temperature, bur the values fell under roughly bell-shaped curves, with peaked at approximately 5 and 7 ¨C in the Labrador and Norwegian seas, respectively. Females from the Labrador Sea were generally larger than those from the Norwegian Sea. |
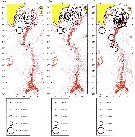 Issued from : A. Gislason, E. Gaard, H. Debes & T. Falkenhaug in Deep-Sea Res. Part II, 2008 , 55. [p.75, Fig.3] Issued from : A. Gislason, E. Gaard, H. Debes & T. Falkenhaug in Deep-Sea Res. Part II, 2008 , 55. [p.75, Fig.3]
Abundance (all stages combined) (A) and relative number of stages C1-3 (B) and C4-6 (C) of Calanus finmarchicusin June 2003 and 2004. All panels are based on samples collected from 100 m to the surface. |
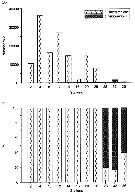 Issued from : A. Gislason, E. Gaard, H. Debes & T. Falkenhaug in Deep-Sea Res. Part II, 2008 , 55. [p.77, Fig.5] Issued from : A. Gislason, E. Gaard, H. Debes & T. Falkenhaug in Deep-Sea Res. Part II, 2008 , 55. [p.77, Fig.5]
Total depth-integrated (0-2500 m) abundance (A) and relative number (B) of C. finmarchicus and C. helgolandicus in June 2004 along the transect from SW Iceland (Station 2: 60°N, 25°W) to N Azores (Station 36: 41°N, 28°W). |
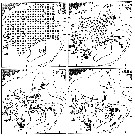 Issued from : C.G. Hannah, C.E. Naimie, J.W. Loder & F.E. Werner in Cont. Shelf Res., 1998, 17 (15). [p.1895, Fig.5]. Issued from : C.G. Hannah, C.E. Naimie, J.W. Loder & F.E. Werner in Cont. Shelf Res., 1998, 17 (15). [p.1895, Fig.5].
Snapshots of particle positions for a 5-m fixed depth release in the March/April flow field at 0, 15.5, 31 and 45.5 days: The initial grid contains 316 particles on a 15-km grid which fills most of the Gulf with depth greater than 100.
CC: Cape Cod; CS: Cape Sable; GM: Gulf of Maine; GB: Georges Bank.
Nota: Potential upper-ocean pathways for the supply of biota from the Gulf of Maine to Georges Bank are investigated by numerically tracking particles in realistic 3-d seasonal-mean and tidal flow fields. The seasonality and location of the identified pathways are generally consistent with observed distributional patterns of Calanus finmarchicus based on the 11-year MARMAP surveys. |
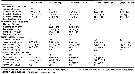 Issued from : E.J.H. Head, L.R. Harris, M. Ringuette & R.W. Campbell in J. Plankton Res., 2013, 35 (2). [p.286, Table II]. Issued from : E.J.H. Head, L.R. Harris, M. Ringuette & R.W. Campbell in J. Plankton Res., 2013, 35 (2). [p.286, Table II].
Average prosome lengths and carbon and nitrogen content for individual female Calanus finmarchicus along the transect between Hamilton Bank (Labrador Shelf) and Cape Desolation (Eastern Labrador Sea) in late May to late July, 1997 to 2010. |
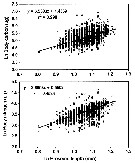 Issued from : E.J.H. Head, L.R. Harris, M. Ringuette & R.W. Campbell in J. Plankton Res., 2013, 35 (2). [p.286, Fig.3]. Issued from : E.J.H. Head, L.R. Harris, M. Ringuette & R.W. Campbell in J. Plankton Res., 2013, 35 (2). [p.286, Fig.3].
Relationship between Ln-transformed female body carbon and prosome length (upper panel) and between female body nitrogen and prosome length (lower panel) for Calanus finmarchicus along transect across the Labrador Sea. |
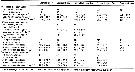 Issued from : E.J.H. Head, L.R. Harris, M. Ringuette & R.W. Campbell in J. Plankton Res., 2013, 35 (2). [p.288, Table 3]. Issued from : E.J.H. Head, L.R. Harris, M. Ringuette & R.W. Campbell in J. Plankton Res., 2013, 35 (2). [p.288, Table 3].
Averages of individual clutch size (for spawning females only) and experimental average spawning frequencies and egg production rates for female Calanus finmarchicus along transect across the Labrador Sea. |
 Issued from : S.A. Pederson, B.H. Hansen, D. Altin & A.J. Olsen in Biogeosciences, 2013, 10. [p.7485, Fig.2]. Issued from : S.A. Pederson, B.H. Hansen, D. Altin & A.J. Olsen in Biogeosciences, 2013, 10. [p.7485, Fig.2].
Calanus finmarchicus: Mortality recorded after 28-day exposure to different levels of CO2-acidified seawater.
The bars show mean ±1 std and significant differences between control (390 ppm) and exposed groups are indicated by asterisks (*). |
 Issued from : S.A. Pederson, B.H. Hansen, D. Altin & A.J. Olsen in Biogeosciences, 2013, 10. [p.7487, Fig.3]. Issued from : S.A. Pederson, B.H. Hansen, D. Altin & A.J. Olsen in Biogeosciences, 2013, 10. [p.7487, Fig.3].
Calanus finmarchicus: Stage distribution (percentage) of the copepodites exposed to different levels of CO2-acidified seawater.
Three replicate groups at each exposure level. The bars show mean ±1 std. Significant differences (p <0.05) between the experimental groups are indicated by asterisks (*). |
 Issued from : S.A. Pederson, B.H. Hansen, D. Altin & A.J. Olsen in Biogeosciences, 2013, 10. [p.7488, Fig.4]. Issued from : S.A. Pederson, B.H. Hansen, D. Altin & A.J. Olsen in Biogeosciences, 2013, 10. [p.7488, Fig.4].
Calanus finmarchicus: Stage-specific prosome and lipid (volume %) of the animals following 28-day exposure to different levels of CO2-acidified seawater.
The bars indicate mean ±1 std (n = 3), and significant differences (p < 0.05) between control and exposed groups are indicated by asterisks (*). The total number of individuals measured in the experiment was CIII = 43, CIV = 254, CV = 610. |
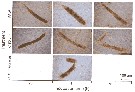 Issued from : C. Svensen, C.W. Riser, M. Reigstadt & L. Seuthe in Mar. Ecol. Prog. Ser., 2012, 462. [p.45, Fig.4]. Issued from : C. Svensen, C.W. Riser, M. Reigstadt & L. Seuthe in Mar. Ecol. Prog. Ser., 2012, 462. [p.45, Fig.4].
Faecal pellets degradation from Calanus finmarchicus incubated with filtered seawater (FSW), the microbial community < 180 µm and C. finmarchicus.
Copepod faecal pellets are considered important contributors to vertical carbon flux. From a series of experiments, the authors found that the degradation of large faecal pellets is time-dependent, as no degradation was apparent after 20 or 48 hours of incubation, but after 72 hours the faecal pellet volume was reduced by 32%; also the large filter-feeding copepods (sa C. finmarchicus) may facilitate the degradation process.
Water was collected in May 2009 at station Svartnes in Balsfjord.
Properties of faecal pellets used in the degradation experiments produced by C. finmarchicus feeding on Rhodomonas sp. (mean ± SD, n = 100):
Length (µm) = 590 ± 97; Width (µm) = 66 ± 10; Volume (µm3) = 2.12 x 1.000.000 ± 0.82 x 1.000.000; Carbon (µg C) = 0.26 ± 0.016; Nitrogen (µg N) = 0.041 ± 0.0038; C:V (µgC/mm3) = 123.2.
|
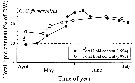 Issued from : J.O. Evjemo, K.I. Reitan & Y. Olsen in Aquaculture, 2003, 227. [p.197, Fig. 1C]. Issued from : J.O. Evjemo, K.I. Reitan & Y. Olsen in Aquaculture, 2003, 227. [p.197, Fig. 1C].
Total lipid content (% of dry weigth) of Calanus finmarchicus in Vestfjorden (N Norway) from May to July during 2 successive years, sampled from syurface waters (0-35 m). |
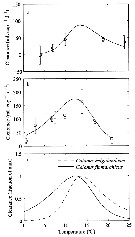 Issued from : E.F. Møller, M. Maar, S.H. Jonasdottir, T.G. Nielsen & K. Tönnesson in Limnol. Oceanogr., 2012, 57 (1). [p.214, Fig.1]. Issued from : E.F. Møller, M. Maar, S.H. Jonasdottir, T.G. Nielsen & K. Tönnesson in Limnol. Oceanogr., 2012, 57 (1). [p.214, Fig.1].
Experimental data and the fitted function on clearance rate (mL./ Copepode/day) of (a) Calanus helgolandicus (R2 = 0.57, p <0.001) and (b) Calanus finmarchicus (R2 = 0.45, p <0.001) as a function of temperature. Error bars are SD. (c) Clearance rate for both species normalized to fraction of its maximum.
For parameter values see Table 1.
Nota: The ingestion response to temperature was determined in the laboratory where the copepods were fed the diatom Thalassiosira weissflogii.
C. finmarchicus from Gullmar fjord (58°19.2'N, 11°32.8'E) on 06 April 2009; C. helgolandicus from off Plymouth (U.K.) in June 2009. |
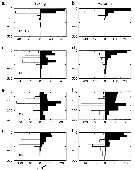 Issued from : F. Maps, B.A. Zakardjian, S. Plourde & F.J. Saucier in J. Mar. Systems, 2011, 88. [p.188, Fig.3]. Issued from : F. Maps, B.A. Zakardjian, S. Plourde & F.J. Saucier in J. Mar. Systems, 2011, 88. [p.188, Fig.3].
Diel vertical distribution of C. finmarchicus copepodite stages observed in the northwest Gulf of St. Lawrence and the St. Lawrence Estuary during spring (left column) and autumn (right column) 1998.
Daytime: white; nightime: black. (a-b) C1-C3; (c-d) C4; (e-f) total C5 (active and dormant); (g-h) C6 females |
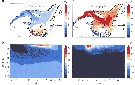 Issued from : F. Maps, B.A. Zakardjian, S. Plourde & F.J. Saucier in J. Mar. Systems, 2011, 88. [p.190, Fig.5]. Issued from : F. Maps, B.A. Zakardjian, S. Plourde & F.J. Saucier in J. Mar. Systems, 2011, 88. [p.190, Fig.5].
Environmental condition simulated for 1999 in the Gulf of St. Lawrence.
(a) Annual mean of temperature averaged between 0 and 30 m (°C). (b) Temporal evolution of temperature (°C) horizontally averaged over the whole area deeper than 100 m. White line: 100 m isobath. (c) Annual mean of chlorophyll a integrated between 0 and 30 m (mg /m2). (d) Temporal evolution of chlorophyll a (mg/m2) horizontally averaged over the whole area deeper than 1200 m. Thin line: maximum depth (100 m) of migrating active copepodites. |
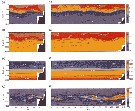 Issued from : F. Gaardsted, K.S. Tande & O.-P. Pedersen in J. Plankton Res., 2011, 33 (10). [p.1480, Fig.2]. Issued from : F. Gaardsted, K.S. Tande & O.-P. Pedersen in J. Plankton Res., 2011, 33 (10). [p.1480, Fig.2].
Transects of temperature (a and b), salinity (c and d), in situ density (e and f) and C. finmarchicus abundance (g and h).
Data from 2009 are shown in the left figure column and data from 2010 in the right column. Transect positions between 69°N and 71°30"N, 10°E and 16°E (NE Norwegian Sea) in January 2009 and January 2010.
Nota: The objective is to provide new quantitative data with a high vertical and horizontal resolution. Combined LOPC (Laser Optical Plankton Counter) and CTD data allow to quantify the variability in the vertical distribution of C. finmarchicus and relate this to hydrography. |
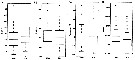 Issued from : F. Gaardsted, K.S. Tande & O.-P. Pedersen in J. Plankton Res., 2011, 33 (10). [p.1481, Fig.4]. Issued from : F. Gaardsted, K.S. Tande & O.-P. Pedersen in J. Plankton Res., 2011, 33 (10). [p.1481, Fig.4].
Boxplots of median C. finmarchicus depth (a), C. finmarchicus layer thickness (b), temperature at median depth (c), and salinity at median depth (d), at stations deeper than 1500 m.
Data from 2009 (left side) and 2010 (right side. 45 and 75 stations were included from 2009 and 2010, respectively. The boxes have lines at the lower quartile, median and upper quartile values. Maximum whisker length is 1.5 times the inter quartile range. Stars mark observations outside the whisker range. |
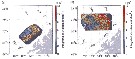 Issued from : F. Gaardsted, K.S. Tande & O.-P. Pedersen in J. Plankton Res., 2011, 33 (10). [p.1480, Fig.7]. Issued from : F. Gaardsted, K.S. Tande & O.-P. Pedersen in J. Plankton Res., 2011, 33 (10). [p.1480, Fig.7].
Vertically integrated abundance of C. finmarchicus (ind. m2) from January 2009 (a) and January 2010 (b). All stations are included in the figures. |
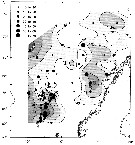 Issued from : E.K. Stenevik, W. Melle, E. Gaard, A. Gislason, C.T.A. Broms, I. Prokopchuk & B. Ellertsen in Depp-Sea Res. II, 2007, 54. [p.2681, Fig.7]. Issued from : E.K. Stenevik, W. Melle, E. Gaard, A. Gislason, C.T.A. Broms, I. Prokopchuk & B. Ellertsen in Depp-Sea Res. II, 2007, 54. [p.2681, Fig.7].
Individual daily egg production (eggs/ female/day). Isolines show integrated chlorophyll a (mg/m3) in the upper 30 m. |
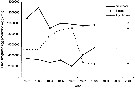 Issued from : E.K. Stenevik, W. Melle, E. Gaard, A. Gislason, C.T.A. Broms, I. Prokopchuk & B. Ellertsen in Depp-Sea Res. II, 2007, 54. [p.2682, Fig.11]. Issued from : E.K. Stenevik, W. Melle, E. Gaard, A. Gislason, C.T.A. Broms, I. Prokopchuk & B. Ellertsen in Depp-Sea Res. II, 2007, 54. [p.2682, Fig.11].
Time-integrated egg production during three bloom phases. |
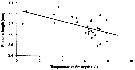 Issued from : E.K. Stenevik, W. Melle, E. Gaard, A. Gislason, C.T.A. Broms, I. Prokopchuk & B. Ellertsen in Depp-Sea Res. II, 2007, 54. [p.2682, Fig.10]. Issued from : E.K. Stenevik, W. Melle, E. Gaard, A. Gislason, C.T.A. Broms, I. Prokopchuk & B. Ellertsen in Depp-Sea Res. II, 2007, 54. [p.2682, Fig.10].
Female size versus temperature at 5 m depth. Only data from the Norwegian survey were included. |
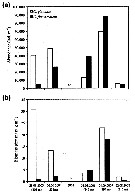 Issued from : E. Leu, J.E. Søreide, D.O. Hessen, S. Falk-Petersen & J. Berge in Progress in Oceanography, 2011, 90. [p.29, Fig. 12]. Issued from : E. Leu, J.E. Søreide, D.O. Hessen, S. Falk-Petersen & J. Berge in Progress in Oceanography, 2011, 90. [p.29, Fig. 12].
Calanus glacialis and calanus finmarchicus abundance (a) and biomass (b) in Rijpfrorden 80°15'N, 22°E (Svalbard) in August/September 2003-2008 (nd : no data).
Samples were collected vertically with a multiple plankton sampler (MPS; Hydro-Bios, Kiel) consisting of five closing nets (mesh size of 180-200 µm) and a WP2 of same mesh size in 2003. Samples were collected close to the mooring station; bottom sampling depths ranged from 195 to 245 m (bottom depths are indicated below the sampling date in parenthese). The abundance and biomass data were integrated from 5 m above the sea floor to the surface.
C. finmarchicus overwinters as CV and mainly has a 1-year life cycle north of the polar front. Highter sea-water temperature and longer ice-free periods are assumed to favor the boreal C. finmarchicus over the larger and more energy-rich Arctic C. glacialis. These species start their gonad development during winter, using reserves accumulated during the previous year. To successfully complete reproduction, however, C. glacialis and C. finmarchicus rely to different extents on the access to fresh food. The boreal C. finmarchicus is completely dependent on pelagic algae, whereas C. glacialis is able to actively feed upon the ice algal bloom and use this high quality food source to fuel gonad maturation and egg production. They can even spawn using exclusively their lipid reserves, but gonad maturation and egg production increase dramatically when fresh algal food is available.
The accelerating decrease of Arctic sea ice extent and thickness over the last decade (Stroeve & al., 2007; Camiso & al., 2008) has far-reaching consequences for the underwater light climate and thus the timing, quantity, and quality of primary production (Arrigo & al., 2008). As algae are intimately linked to the ice cover, them to be flexible and respond fast to a new climatic regime, but this flexibility may be less manifested in consumers and higher trophic levels with complex life history adaptations. Thinner ice and earlier ice breakup may thus lead to a temporal mismatch between the timing of the bloom and the zooplankton production. (Melle & Skjoldal, 1998; hansen & al., 2003). Less ice will also cause a shift in primary production from ice algae to phytoplankton (Hegseth, 1998), with a shorter temporal difference between the ice algal and phytoplankton blooms (Søreide & al., 2010). It is therefore unclear whether an elevated primary production really yields a corresponding increase in secondary production. |
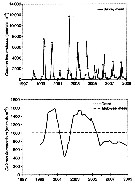 Issued from : J.T. Turner, D.G. Borkman & P. S. Libby inJ. Plankton Res., 2011, 33 (7). [p.1075, Fig.10]. Issued from : J.T. Turner, D.G. Borkman & P. S. Libby inJ. Plankton Res., 2011, 33 (7). [p.1075, Fig.10].
Trend in abundance (animals per m3) for total Calanus finmarchicus (copepodites + adults combined) 1998 - 2008.
Upper panel shows survey means (Station offshore from Boston Harbors, in Masssachussets Bay). Lower panel shows the de-seasonalized trend and the multi-year mean.
Nota: Zooplankton samples were collected with vertical tows over the upper 25 m (mesh size 102 µm).
The only zooplankton category that exhibited significant relationships to hydrographic factors such as surface salinity was the copepod Calanus finmarchicus. The copepod also exhibits correlations with the North Atlantic Oscillation (NAO) (Greene & Parshing, 200; 2003; Turner & al., 2006).
The relationship between C. finmarchicus and climate is important because Massachusetts Bay and Cap Cod Bay are major feeding areas for endangered right whales Eubalaena glacialis, which feed heavily on abundant surface accumulations of C. finmarchicus and other copepods in late winter and early spring (Mayo & Marx, 1990). |
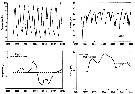 Issued from : J.T. Turner, D.G. Borkman & P. S. Libby inJ. Plankton Res., 2011, 33 (7). [p.1076, Figs. 11, 12]. Issued from : J.T. Turner, D.G. Borkman & P. S. Libby inJ. Plankton Res., 2011, 33 (7). [p.1076, Figs. 11, 12].
Trends in surface temperature (°C) and salinity (psu). Upper panels show survey means (stations combined at Massachusetts Bay); Lower panels show the de-seasonalized trends and the multi-year means. |
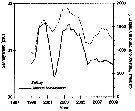 Issued from : J.T. Turner, D.G. Borkman & P. S. Libby inJ. Plankton Res., 2011, 33 (7). [p.1077, Fig. 13]. Issued from : J.T. Turner, D.G. Borkman & P. S. Libby inJ. Plankton Res., 2011, 33 (7). [p.1077, Fig. 13].
Trends in abundance of Calanus finmarchicus (animals per m3) and surface salinity (psu) 1998 - 2008.
Nota: Mean annual surface salinity and mean annual abundance of C. fimarchicus were positively correlated (Pearson r = +0.73, n = 11, P = 0.0114), with elevated C. finmarchicus abundance positively associated with periods of elevated salinity. |
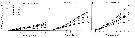 Issued from : M. Hjorth & T.G. Nielsen in Mar. Biol., 2011, 158. [p.1342, Fig. 2, a-c]. Issued from : M. Hjorth & T.G. Nielsen in Mar. Biol., 2011, 158. [p.1342, Fig. 2, a-c].
Cumulated specific faecal pellet production (SPP) in C. finmarchicus during exposure to six concentrations of pyrene at three temperatures (from left to right: 0.5 , 5 and 8°C). Asterisks denote a significant different (P <0.05) development from control.
Sampling of copepods conducted from 23 to 25 April 2008 in Disko Bay (69°15'N, 53°33'W). |
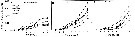 Issued from : M. Hjorth & T.G. Nielsen in Mar. Biol., 2011, 158. [p.1343, Fig. 3, a-c]. Issued from : M. Hjorth & T.G. Nielsen in Mar. Biol., 2011, 158. [p.1343, Fig. 3, a-c].
Cumulated specific egg production (SEP) in C. finmarchicus during exposure to six concentrations of pyrene at three temperatures (from left to right: 0.5 , 5 and 8°C). Asterisks denote a significant different (P <0.05) development from control.
Sampling of copepods conducted from 23 to 25 April 2008 in Disko Bay (69°15'N, 53°33'W). |
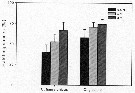 Issued from : M. Hjorth & T.G. Nielsen in Mar. Biol., 2011, 158. [p.1344, Fig. 5]. Issued from : M. Hjorth & T.G. Nielsen in Mar. Biol., 2011, 158. [p.1344, Fig. 5].
Hatching data for each species at the three water temperature, pooled across pyrene treatments and exposure times..
Sampling of copepods conducted from 23 to 25 April 2008 in Disko Bay (69°15'N, 53°33'W). |
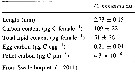 Issued from : M. Hjorth & T.G. Nielsen in Mar. Biol., 2011, 158. [p.1341, Table 1]. Issued from : M. Hjorth & T.G. Nielsen in Mar. Biol., 2011, 158. [p.1341, Table 1].
Size, carbon and lipid content of adult females of Calanus finmarchicus and carbon content of eggs and faecal pellets.
Sampling of copepods conducted from 23 to 25 April 2008 in Disko Bay (69°15'N, 53°33'W). |
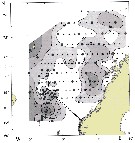 Issued from : E.K. Stenevik, W. Melle, E. Gaard, A. Gislason, C.T.A. Broms, I. Prokopchuk & B. Ellertsen in Deep-Sea Res. II, 2007, 54. [p.2678, Fig.4]. Issued from : E.K. Stenevik, W. Melle, E. Gaard, A. Gislason, C.T.A. Broms, I. Prokopchuk & B. Ellertsen in Deep-Sea Res. II, 2007, 54. [p.2678, Fig.4].
Classification of egg productin stations according to bloom development.
Blue circles indicate pre-bloom, green circles indicate bloom and red circles indicate post-bloom phases.
Integrated chlorophyll a (mg per m2 in the upper 30 m) is shown.
Nota: Sampling area of Calanus finmarchicus female in the Norwegian Sea between 25 April and 26 May 2003.
A total of 79 egg production experiments were effectued on each station. Samples for gut fluorescence analysis were taken to measure gut pigment content of female. |
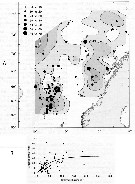 Issued from : E.K. Stenevik, W. Melle, E. Gaard, A. Gislason, C.T.A. Broms, I. Prokopchuk & B. Ellertsen in Deep-Sea Res. II, 2007, 54. [p.2681, Figs.7, 8]. Issued from : E.K. Stenevik, W. Melle, E. Gaard, A. Gislason, C.T.A. Broms, I. Prokopchuk & B. Ellertsen in Deep-Sea Res. II, 2007, 54. [p.2681, Figs.7, 8].
A (fig.7): Individual daily egg production (eggs per female per day). Isohalines show integrated chlorophyll a (mg per m2) in the upper 30 m.
B (fig.8): Individual egg production rate versus chlorophyll a (integrated in the upper 30 m). The curve is a fitted Ivlev curve. |
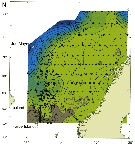 Issued from : E.K. Stenevik, W. Melle, E. Gaard, A. Gislason, C.T.A. Broms, I. Prokopchuk & B. Ellertsen in Deep-Sea Res. II, 2007, 54. [p.2673, Fig.1]. Issued from : E.K. Stenevik, W. Melle, E. Gaard, A. Gislason, C.T.A. Broms, I. Prokopchuk & B. Ellertsen in Deep-Sea Res. II, 2007, 54. [p.2673, Fig.1].
Horizontal distribution of temperature at 10 m depth composed of data from Norwegian, Icelandic and Faroe Island surveys CTD stations are indicated with triangles, and egg production stations with circles in April-June 2003.
Nota: The upper water layer (about 500 m) in the Norwegian Sea consists of three different water masses (see Blindheim, 2004). In the eastern part, over the Norwegian continental shelf, low-salinity Norwegian Coastal water flows northwards while warm and saline Atlantic water enters the central Norwegian Sea from the south.
In the south-western part of the Norwegian Sea, the East Icelandic Current transports cold and less-saline Arctic water south-eastwards to the north Faroes.
According to Rey (2004), seasonal development of the phytoplankton production in the Norwegian Sea can be divided into 5 phases. The winter period is characterized by low chlorophyll levels, high nutrient concentrations, a deep upper mixed layer and low light conditions. During the pre-bloom period, a faint increase in the vertical stability of the upper 100 m combined with more light favours some phytoplankton production.
The subsequent spring bloom usually starts in early May, coinciding with a considerable increase in the vertical stability due to warming.
During the post-bloom phase, production is mostly based on regenerated nutrients and chlorophyll a concentration is lower than during the bloom.
The last phase occurs during autumn, when in some areas a secondary smaller bloom can be observed. |
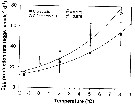 Issued from : H.-J. Hirche & K. Kosobokova in Deep-Sea Research II, 2007, p.2742, Fig.8]. Issued from : H.-J. Hirche & K. Kosobokova in Deep-Sea Research II, 2007, p.2742, Fig.8].
Egg production rates of Calanus finmarchicus and C. glacialis at different temperatures and optimum food concentrations. Vertical bars ± SD.
Specimens collected in the Norwegian Sea at 9°C in June 1989, , incubated at five temperatures after acclimatation at 0°C for 4-7 days. They laid eggs in regular intervals during ca. 2 weeks.
Egg production rate increased exponentially with temperature over the range between - 1.5 and 8°C.
Nota: See remark concerning the adaptation the congener Calanus glacialis. |
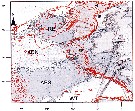 Issued from : N. McGinty, A.M. Power & M.P. Johnson in J. Exp. Mar. Biol. Ecol., 2011, 400. [p.125, Fig. 2]. Issued from : N. McGinty, A.M. Power & M.P. Johnson in J. Exp. Mar. Biol. Ecol., 2011, 400. [p.125, Fig. 2].
Locations of the ten clusters defined as ecosystem regions in the North Atlantic, by K-means partitioning of satellite-derived Chl-a data. The locations of CPR samples throughout the study area are marked by black dots. Red contours indicate the underlying bathymetry at 200, 400, 800, 1600 and 3200 m intervals. Abbreviations and attributes that relate to each region are described in Table I.
See in Calanus helgolandicus for complementary figures and account. |
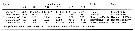 Issued from : M. Daase, J.E. Søreide & M. Martynova in Mar. Ecol. Peog. Ser., 2011, 429. [p.119, Table 6]. Issued from : M. Daase, J.E. Søreide & M. Martynova in Mar. Ecol. Peog. Ser., 2011, 429. [p.119, Table 6].
Length distribution (mm) of total length of nauplii of North Atlantic and Arctic Calanus spp. Comparison between C. finmarchicus, C. glacialis, C. hyperboreus.
nd: no data. |
 Issued from : H. Bi, K.A. Rose & M.C. Benfield in Mar. Ecol. Prog. Ser., 2011, 427. [p.157, Table 5]. Issued from : H. Bi, K.A. Rose & M.C. Benfield in Mar. Ecol. Prog. Ser., 2011, 427. [p.157, Table 5].
Instantaneous mortality rates (individuals per day) from litterature. |
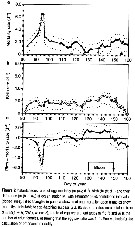 Issued from : M.D. Ohman & H.-J. Hirche in Nature, 2001, 412. [p.639, Fig.2]. Issued from : M.D. Ohman & H.-J. Hirche in Nature, 2001, 412. [p.639, Fig.2].
Instantaneous rates of egg mortality (a), birth (b) and their difference (c) at Station 'M' (central Norwegian Sea) for 80 days time series of Calanus finmarchicus.
Nota: Sampling shows a springtime emergence of juvenile (C5) and adult females in late March. These individuals originate from the overwintering generation in deep water. The onset of reproductive maturity and egg production occur at least 40-50 days before the phytoplankton bloom (contrary to the assumptions in many ecosystem models) although per capita rates of egg production increase at the time of the bloom. Grazing rates are low before the bloom, suggesting that stored wax esters are used during gonad maturation and oogenesis with nutritional supplements obtained from microplankton grazed from the water column.
The recruitment r(ate (number of eggs produced per m2 of sea surface per day) is initially quite high, but for the first 20 days of the series virtually no eggs survive to the first larval stage (nauplius). Subsequently, nauplius larvae appear and the population increases as a developing spring generation.
Stage-specific mortality rates from this series were estimated using inverse methods (see Wood, 1994; Aksnes & al., 1997) and Ohman & Hirche, 2001 (p.640) . |
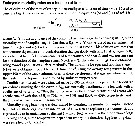 Issued from : M.D. Ohman & H.-J. Hirche in Nature, 2001, 412. [p.640]. Method for estimated embryonic mortality rates as a function of time. Issued from : M.D. Ohman & H.-J. Hirche in Nature, 2001, 412. [p.640]. Method for estimated embryonic mortality rates as a function of time. |
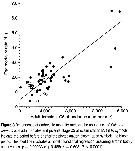 Issued from : M.D. Ohman & H.-J. Hirche in Nature, 2001, 412. [p.640, Fig.3]. Issued from : M.D. Ohman & H.-J. Hirche in Nature, 2001, 412. [p.640, Fig.3].
Egg mortality rates function of abundance of calanus finmarchicus adult females and juvenile satge C5 in the central Norwegian Sea (Station 'M').
Nota: The most parsimonious explanation for the density-dependance of egg mortality seems to be egg cannibalism. Egg predation would be particularly important during the prebloom period when phytoplankton concentrations are low. |
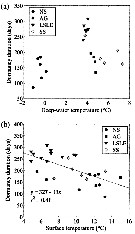 Issued from : C.L. Johnson, A.W. Leising, J.A. Runge, E.J.H. Head, P. Pepin, S. Plourde & E.G. Durbin in ICES J. Mar. Sc., 2008, 65. [p.346, Fig.7]. Issued from : C.L. Johnson, A.W. Leising, J.A. Runge, E.J.H. Head, P. Pepin, S. Plourde & E.G. Durbin in ICES J. Mar. Sc., 2008, 65. [p.346, Fig.7].
Dormancy duration: difference between entry and emergence dates as a function of (a) deep-water temperature representative of dormancy depth at each station, and (b) surface (5m) temperature on the onset date. The regression relationship in (b) is significant (p < 0.05).
For stations see fig.1 Northwest Atlantic from New Foundland, Gulf of St Lawrence, Gulf of Maine, Georges Bank. |
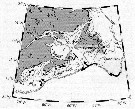 Issued from : C.L. Johnson, A.W. Leising, J.A. Runge, E.J.H. Head, P. Pepin, S. Plourde & E.G. Durbin in ICES J. Mar. Sc., 2008, 65. [p.341, Fig.1]. Issued from : C.L. Johnson, A.W. Leising, J.A. Runge, E.J.H. Head, P. Pepin, S. Plourde & E.G. Durbin in ICES J. Mar. Sc., 2008, 65. [p.341, Fig.1].
Northwest Atlantic study region, including schematic surface currents. AZMP (data from Fisheries and Oceans Canada) fixed stations: AG (Anticosti Gyre), LSLE (the lower St Lawrence E stuary) and the SS (station H2). Other important locations include Georges Bank (GB), Gulf of Maine (GOM), Gulf of St Lawrence (GSL) and the Strait of Belle Isle (SBI°
|
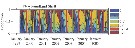 Issued from : C.L. Johnson, A.W. Leising, J.A. Runge, E.J.H. Head, P. Pepin, S. Plourde & E.G. Durbin in ICES J. Mar. Sc., 2008, 65. [p.344, Fig.2]. Issued from : C.L. Johnson, A.W. Leising, J.A. Runge, E.J.H. Head, P. Pepin, S. Plourde & E.G. Durbin in ICES J. Mar. Sc., 2008, 65. [p.344, Fig.2].
Time-series demography of C. finmarcicus at the AZMP fixed stations. Proportion of naupliar (RIM station only) and cipepodid stages for each year which data are available. Red line, estimated time of onset into dormancy; solid green line, estimated time of exit from dormancy based on proportion of females present; dashed green line, estimated time of exit based on back-calculation from presence of early copepodid stages (saturating food condition). See details of method for determinating timing of onset and exit. |
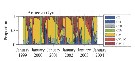 Issued from : C.L. Johnson, A.W. Leising, J.A. Runge, E.J.H. Head, P. Pepin, S. Plourde & E.G. Durbin in ICES J. Mar. Sc., 2008, 65. [p.344, Fig.2]. Issued from : C.L. Johnson, A.W. Leising, J.A. Runge, E.J.H. Head, P. Pepin, S. Plourde & E.G. Durbin in ICES J. Mar. Sc., 2008, 65. [p.344, Fig.2].
Time-series demography of C. finmarcicus at the AZMP fixed stations. Proportion of naupliar (RIM station only) and cipepodid stages for each year which data are available. Red line, estimated time of onset into dormancy; solid green line, estimated time of exit from dormancy based on proportion of females present; dashed green line, estimated time of exit based on back-calculation from presence of early copepodid stages (saturating food condition). See details of method for determinating timing of onset and exit. |
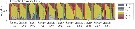 Issued from : C.L. Johnson, A.W. Leising, J.A. Runge, E.J.H. Head, P. Pepin, S. Plourde & E.G. Durbin in ICES J. Mar. Sc., 2008, 65. [p.344, Fig.2]. Issued from : C.L. Johnson, A.W. Leising, J.A. Runge, E.J.H. Head, P. Pepin, S. Plourde & E.G. Durbin in ICES J. Mar. Sc., 2008, 65. [p.344, Fig.2].
Time-series demography of C. finmarcicus at the AZMP fixed stations. Proportion of naupliar (RIM station only) and cipepodid stages for each year which data are available. Red line, estimated time of onset into dormancy; solid green line, estimated time of exit from dormancy based on proportion of females present; dashed green line, estimated time of exit based on back-calculation from presence of early copepodid stages (saturating food condition). See details of method for determinating timing of onset and exit. |
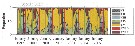 Issued from : C.L. Johnson, A.W. Leising, J.A. Runge, E.J.H. Head, P. Pepin, S. Plourde & E.G. Durbin in ICES J. Mar. Sc., 2008, 65. [p.344, Fig.2]. Issued from : C.L. Johnson, A.W. Leising, J.A. Runge, E.J.H. Head, P. Pepin, S. Plourde & E.G. Durbin in ICES J. Mar. Sc., 2008, 65. [p.344, Fig.2].
Time-series demography of C. finmarcicus at the AZMP fixed stations. Proportion of naupliar (RIM station only) and cipepodid stages for each year which data are available. Red line, estimated time of onset into dormancy; solid green line, estimated time of exit from dormancy based on proportion of females present; dashed green line, estimated time of exit based on back-calculation from presence of early copepodid stages (saturating food condition). See details of method for determinating timing of onset and exit. |
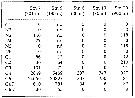 Issued from : E.G. Durbin, J.A. Runge, R.G. Campbell, P.R. Garrahan, M.C. Casas & S. Plourde in Mar. Ecol. Prog. Ser., 1997, 151. [p.107, Table 1]. Issued from : E.G. Durbin, J.A. Runge, R.G. Campbell, P.R. Garrahan, M.C. Casas & S. Plourde in Mar. Ecol. Prog. Ser., 1997, 151. [p.107, Table 1].
Calanus finmarchicus. Abundance and age structure of copepods at Stns 7 and 9 in the Southern Gulf of Maine, at Stns 6 and 19 on Georges Bank, and at Stn 20in slope waters during November 1994.
Abundance of nauplii are from pump samples collected in the upper 60 m while the 1 m2 MOCNESS samples were taken over the entire water column (upper 400 m at Stn 20). Station depths are shown in parentheses. Data are presented as no. m2 over the depth range of the samples. nd: no data. |
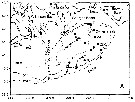 Issued from : E.G. Durbin, J.A. Runge, R.G. Campbell, P.R. Garrahan, M.C. Casas & S. Plourde in Mar. Ecol. Prog. Ser., 1997, 151. [p.104, Fig. 1 A]. Issued from : E.G. Durbin, J.A. Runge, R.G. Campbell, P.R. Garrahan, M.C. Casas & S. Plourde in Mar. Ecol. Prog. Ser., 1997, 151. [p.104, Fig. 1 A].
Study area showing (A) stations during RV 'Albatros IV' cruise 9410, 8 to 18 November 1994. |
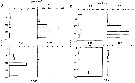 Issued from : E.G. Durbin, J.A. Runge, R.G. Campbell, P.R. Garrahan, M.C. Casas & S. Plourde in Mar. Ecol. Prog. Ser., 1997, 151. [p.107, Fig. 3]. Issued from : E.G. Durbin, J.A. Runge, R.G. Campbell, P.R. Garrahan, M.C. Casas & S. Plourde in Mar. Ecol. Prog. Ser., 1997, 151. [p.107, Fig. 3].
Calanus finmarchicus . A Night-time (01.15 h) depth distribution at Stn 7 and B day-time (11.11 h) depth distribution at Stn 9 of older copepodites in the southern Gulf of Maine during RV 'Albatros IV' cruise 5410, 8-18 November 1994.
Samples were collected with 1 m2 MOCNESS net with 0.15 mm mesh aperture nets from bottom to 100 m and 0.33 mm mesh aperture nets from 100 m to the surface.
Water column abundances (no. m2) are given in Table 1. |
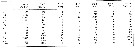 Issued from : E.G. Durbin, J.A. Runge, R.G. Campbell, P.R. Garrahan, M.C. Casas & S. Plourde in Mar. Ecol. Prog. Ser., 1997, 151. [p.108, Table 2]. Issued from : E.G. Durbin, J.A. Runge, R.G. Campbell, P.R. Garrahan, M.C. Casas & S. Plourde in Mar. Ecol. Prog. Ser., 1997, 151. [p.108, Table 2].
Calanus finmarchicus. Abundance and age structure of copepods at Stns 1 and 7 in the Southern Gulf of Maine, at Stns 2, 4, 5, and 11 on Georges Bank and at Stn 16 in slope waters during January 1995.
Abundance of nauplii are from pump samples collected in the upper 60 m while the 1 m2 MOCNESS samples were taken over the entire water column (upper 400 m at Stn 16).
Station depths are shown in parenyjeses.
Data are presented as no. m2 over the deph range of the samples.
nd: no data. |
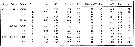 Issued from : E.G. Durbin, J.A. Runge, R.G. Campbell, P.R. Garrahan, M.C. Casas & S. Plourde in Mar. Ecol. Prog. Ser., 1997, 151. [p.108, Table 3]. Issued from : E.G. Durbin, J.A. Runge, R.G. Campbell, P.R. Garrahan, M.C. Casas & S. Plourde in Mar. Ecol. Prog. Ser., 1997, 151. [p.108, Table 3].
Calanus finmarchicus. Length (L), carbon and nitrogen values and C:N ratio of copepods from surface and deep water on Georges Bank (GB), in the Gulf of Maine (GOM) and slope water during the fall and early winter of 1994-1995.
Data were grouped by region and depth where the surface (S) samples were collected in the upper 40 m and the bottom (B) samples were from depths below 100 m.
At each station, n groups of 5 animals each were measured. |
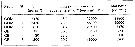 Issued from : E.G. Durbin, J.A. Runge, R.G. Campbell, P.R. Garrahan, M.C. Casas & S. Plourde in Mar. Ecol. Prog. Ser., 1997, 151. [p.111, Fig. 6]. Issued from : E.G. Durbin, J.A. Runge, R.G. Campbell, P.R. Garrahan, M.C. Casas & S. Plourde in Mar. Ecol. Prog. Ser., 1997, 151. [p.111, Fig. 6].
Calanus finmarchicus . Population egg production rates and total naupliar abundance on the Southern Gulf of Maine (GOM) and on Georges Bank (GB) during January 1995. |
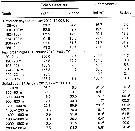 Issued from : M. Daase, Ø. Varpe & S. Falk-Petersen in J. Plankton Res., 2013, 36 (1). [p.137, Table III]. Issued from : M. Daase, Ø. Varpe & S. Falk-Petersen in J. Plankton Res., 2013, 36 (1). [p.137, Table III].
Estimated abundance (individuals per m3) of Calanus spp. and for Calanus finmarchicus in each depth layer at both stations
Nota: Samples were taken at Rijpfjorden (80°15.5' N, 22°15.7' E), Svalbard), depth 280 m, and at the ice edge at Sofiadjupet, a deep basin in the southern part of the Arctic Ocean (81°42' N, 14°16' E) depth 2290 m. Zooplankton sampled by vertical hauls from close to the bottom to the surface using a multiple opening/closing net (mesh aperture 200 µm).
Compare with Calanus glacialis and Calanus hyperboreus at the same locations. |
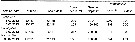 Issued from : M. Daase, Ø. Varpe & S. Falk-Petersen in J. Plankton Res., 2013, 36 (1). [p.139, Table IV]. Issued from : M. Daase, Ø. Varpe & S. Falk-Petersen in J. Plankton Res., 2013, 36 (1). [p.139, Table IV].
Abundance of Calanus finmarchicus obseved in net hauls taken in Rijpfjorden and at off-shelf locations in the pack ice north of Svalbard in July 2012.
Nota: Samples were taken at Rijpfjorden (80°15.5' N, 22°15.7' E), Svalbard), depth 280 m, and at the ice edge at Sofiadjupet, a deep basin in the southern part of the Arctic Ocean (81°42' N, 14°16' E) depth 2290 m. Zooplankton sampled by vertical hauls from close to the bottom to the surface using a multiple opening/closing net (mesh aperture 200 µm).
Compare with Calanus glacialis and Calanus hyperboreus at the same locations. |
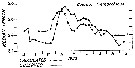 Issued from : G.B. Deevey in Bull. Bingham Oceanogr. Coll., 1960, 17 (2). [p.74, Fig.10]. Issued from : G.B. Deevey in Bull. Bingham Oceanogr. Coll., 1960, 17 (2). [p.74, Fig.10].
Obsrrved seasonal variations in median cephalothorax length of female Calanus finmarchicus (Marshall & al., 1934) in Loch Striven in 1933) compared with length calculated from the mean temperature and number of diatoms of the month previous to sampling. |
 Issued from : G. B. Deevey in Bull. Bingham Oceanogr. Coll., 1960, 17 (2). [p.73, Table VIII]. Issued from : G. B. Deevey in Bull. Bingham Oceanogr. Coll., 1960, 17 (2). [p.73, Table VIII].
Correlation coefficients for mean cephalothorax lengths with the temperature and phytoplankton of the day of samplingt and averaged for the previous four weeks obtained with 28 and 26 pairs of data for female and copepodite stages I and III Calanus finmarchicus from Loch Striven (W Clyde estuary)).
Quantity of diatoms (data published by S.M. Marshall, 1949 .
In 1933 the extreme range temperature at 0 m was 4.5-16.4°C and at 30 m 6.37-12.98°C. |
 Issued from : G.A. Deevey in Bull. Bingham Oceanogr. Coll., 1960, 17 (2); [p.76, Table IX]. Issued from : G.A. Deevey in Bull. Bingham Oceanogr. Coll., 1960, 17 (2); [p.76, Table IX].
Correlation coefficients for mean cephalothorax lengths for Calanus finmarchicus with the temperature at sampled from Woods Hole, Massachusets) (data from Clarke & Zinn, 1937). |
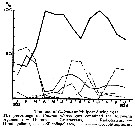 Issued from : S.M. Marshall & A.P. Orr inThe Biology of a Marine Copepod, 1972. Reprint Springer-Verlag. [p.102, Fig.40]. Issued from : S.M. Marshall & A.P. Orr inThe Biology of a Marine Copepod, 1972. Reprint Springer-Verlag. [p.102, Fig.40].
The food of Calanus at Millport (Scotland) during 1923.
Nota: The figure shows the percentage of Calanus feeding on various types of food in the Clyde sea area; the kind of food varies according to its abundance in the sea. Although silicoflagellates and coccolithophores occurred in quite a large percentage of the guts they were never there in large numbers and did not form an important part of the food. It is curious that Ceratium has rarely been found in the gut of Calanus although it is often common in the plankton. |
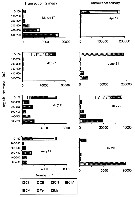 Issued from : E.G. Arashkevich, K.S. Tande, A.F. Pasternak & B. Ellertsen in Mar. Biol., 2004, 146. [p.124, Fig.3]. Issued from : E.G. Arashkevich, K.S. Tande, A.F. Pasternak & B. Ellertsen in Mar. Biol., 2004, 146. [p.124, Fig.3].
Calanus finmarchicus: Depth distribution of different copepodite stages at oceanic stations off Gimsøy (left panel) and Svinøy (right panel) from March to October 1997.
See below: chart Fig. 1: The study region at the Norwegian midshelf with the prevailing current systems, and sampling sites along the two sections off Svinøy (62 to 64° N) and Gimsøy (68 to 70° N). |
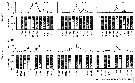 Issued from : E.G. Arashkevich, K.S. Tande, A.F. Pasternak & B. Ellertsen in Mar. Biol., 2004, 146. [p.123, Fig.2]. Issued from : E.G. Arashkevich, K.S. Tande, A.F. Pasternak & B. Ellertsen in Mar. Biol., 2004, 146. [p.123, Fig.2].
Calanus finmarchicus : Seasonal variation in mean (± SD) abundance and stage composition of the population in the upper 200 m layer at the shelf, at the continental slope and in oceanic waters along sections off Gimsøy (top panels) and Svinøy (bottom panels) from January to October 1997.
See below: chart Fig. 1: The study region at the Norwegian midshelf with the prevailing current systems, and sampling sites along the two sections off Svinøy (62 to 64° N) and Gimsøy (68 to 70° N). |
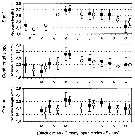 Issued from : E.G. Arashkevich, K.S. Tande, A.F. Pasternak & B. Ellertsen in Mar. Biol., 2004, 146. [p.125, Fig.4]. Issued from : E.G. Arashkevich, K.S. Tande, A.F. Pasternak & B. Ellertsen in Mar. Biol., 2004, 146. [p.125, Fig.4].
Calanus finmarchicus: Seasonal variation in mean (± SD) prosome length for stage V copepodites sampled on the shelf, at the continental slope and in oceanic waters along sections off Svinøy (open circles) and Gimsøy (filled circles) from February to October 1997.
See below: chart Fig. 1: The study region at the Norwegian midshelf with the prevailing current systems, and sampling sites along the two sections off Svinøy (62 to 64° N) and Gimsøy (68 to 70° N). |
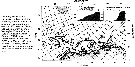 Issued from : E.G. Arashkevich, K.S. Tande, A.F. Pasternak & B. Ellertsen in Mar. Biol., 2004, 146. [p.120, Fig.1]. Issued from : E.G. Arashkevich, K.S. Tande, A.F. Pasternak & B. Ellertsen in Mar. Biol., 2004, 146. [p.120, Fig.1].
Chart of the study region at the Norwegian midshelf with the prevailing current systems, and sampling sites along the two sections off Svinøy (62 to 64° N) and Gimsøy (68 to 70° N).
Atlantic Current: >35 PSU; Norwegian Coastal Current (NCC: < 34.5 PSU).
The salinity of the coastal water generally increases along latitudinal gradient due to mixing with Atlantic water. Due to freshhwater dischaege, maximum salinity is encountered in winter. During spring the temperature is in the range from 4°C to 7°C on the surface, with a tendency for lower temperatures in the northern part of the study area. The temperature increases with depth slightly down to 200 m. At the shelf edge, below 300 m, cold Norwegian deep water is found, with temperatures of abot 1-2°C (See Saetre, 1999; Pedersen & al., 2000, 2001). |
 Issued from : H. Saito & A. Tsuda in Deep-Sea Res. I, 47. [p.2146, Table I]. Issued from : H. Saito & A. Tsuda in Deep-Sea Res. I, 47. [p.2146, Table I].
Egg diameter, carbon and nitrogen content, and prosome length (PL) of females of Calanus finmarchicus after McLaren & al., 1988, and Ohman & Runge, 1994
Nota: Compare with N. cristatus, N. tonsus and N. flemingeri and others species in genus Calanus. |
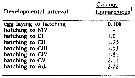 Issued from : C.J. Corkett, I.A. McLaren & J.-M. Sevigny in Syllogeus, 1986, 58. [p.545, Table I]. Issued from : C.J. Corkett, I.A. McLaren & J.-M. Sevigny in Syllogeus, 1986, 58. [p.545, Table I].
Relative times to reach various stages of C. finmarchicus, assuming equiproportional development.
All times expressed relative to time between hatching and molting to CI.
1 : From Fig. 1.
Nota: Compare with Calanus hyperboreus, C. glacialis, C. helgolandicus and C. pacificus. |
 Issued from : D.C. Maclellan in Can. J. Zool., 1967, 45. [p.106, Table II]. Issued from : D.C. Maclellan in Can. J. Zool., 1967, 45. [p.106, Table II].
Mean cephalothorax length and 95% fiducial limits of adult female C. finmarchicus s.str. and C. glacialis from Ameralik and Godthaab fjords (West Greenland (± 64°15' N, 52°40' W).
Nota: See comparison with C. finmarchicus in Maclellan D.C (1967, figs. 5-8) for the cephalothoracic length freqiuencies of adult females and males. The early copepodites of the two species are separable by size (see Grainger, 1963), if they are sufficient number to show a unimodal or bimodal distribution. Up to stage V, the copepodites of C. finmarchicus s.str. and C. glacialis are not separable on grounds of morphology (Graincer, 1963). |
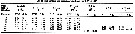 Issued from : D.C. Maclellan in Can. J. Zool., 1967, 45. [p.103, Table I]. Issued from : D.C. Maclellan in Can. J. Zool., 1967, 45. [p.103, Table I].
List of temperatures and salinities , Godthaab Fjord (64°10' N, 52°50' W), 1945-1946.
Nota: The out-flowing surface current affects the top 3 m of the waters in Godthaab fjord (Dunbar, unpubl.) explains probably the paucity of eggs and nauplii, and early copepodites. This hypothesis is perhaps substantiated by the finding of considerable numbers of early copepodites in a surface sample taken on June 25, 1943 at station G5 (out-fjord). Although surface cooling of the fjord waters occurred during the winter, a negative reading at the surface was recorded only once during the winter seriesof samples. In the late autumn and early winter, the increasing influence of the Irminger current (Dunbar, 1951) and Hachey & al., 1954) was evident at depths of 200 m and coincided with the maturation of C. finmarchicus s.str. and C. glacialis. |
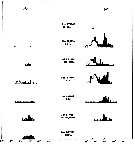 Issued from : D.C. Maclellan in Can. J. Zool., 1967, 45. [p.107, Fig.5]. Issued from : D.C. Maclellan in Can. J. Zool., 1967, 45. [p.107, Fig.5].
The cephalothoracic length frequencies of adult males and females for the outer Godthaab Fjord , winter, in micrometer units of C. finmarchicus s.str. (white) and of C. glacialis (black).
1 unit = 0.066 mm. |
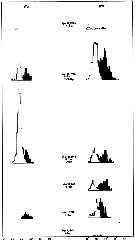 Issued from : D.C. Maclellan in Can. J. Zool., 1967, 45. [p.108, Fig.6]. Issued from : D.C. Maclellan in Can. J. Zool., 1967, 45. [p.108, Fig.6].
The cephalothoracic length frequencies of adult males and females for the inner Godthaab Fjord, winter, in micrometer units of C. finmarchicus s.str. (white) and of C. glacialis (black).
1 unit = 0.066 mm. |
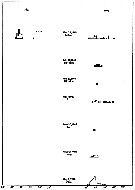 Issued from : D.C. Maclellan in Can. J. Zool., 1967, 45. [p.1089 Fig.7]. Issued from : D.C. Maclellan in Can. J. Zool., 1967, 45. [p.1089 Fig.7].
The cephalothoracic length frequencies of adult males and females for the outer Godthaab Fjord, summer, in micrometer units of C. finmarchicus s.str. (white) and of C. glacialis (black).
1 unit = 0.066 mm. |
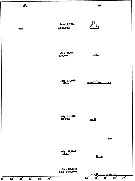 Issued from : D.C. Maclellan in Can. J. Zool., 1967, 45. [p.110, Fig.8]. Issued from : D.C. Maclellan in Can. J. Zool., 1967, 45. [p.110, Fig.8].
The cephalothoracic length frequencies of adult males and females for the inner Godthaab Fjord, summer, in micrometer units of C. finmarchicus s.str. (white) and of C. glacialis (black).
1 unit = 0.066 mm. |
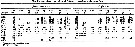 Issued from : D.C. Maclellan in Can. J. Zool., 1967, 45. [p.111, Table III]. Issued from : D.C. Maclellan in Can. J. Zool., 1967, 45. [p.111, Table III].
Monthly percentage composition in the outer of Godthaab Fjord (W Greenland).
Comparison between the life history C. glacialis and C. finmarchicus at the same place.
Nota: In the outer fjord, C. finmarchicus s.str. had a peak of fertilization in February, with some spawning in March, when most of the adult females had ripened ovaries. Eggs and nauplii of the new generation appeared in mid-April, and probably increased in percentage through May, since the peak of early copepodites was in early June. Considerable numbers were taken in collections made at the surface. Late spawners contributed to the early copepodites found in July and September samples. Most of the population was in stage V in late October with a small percentage of adult males and females. The only sample available from November consisted almost entirely of the medusa, Atlanta digitale and two stage V copepodites. The December collections were poor in numbers, stages IV and V predominating with a few adult females. There was no sign of eggs or nauplii, although the single stage I copepoditr taken in Juanuary was probably the result of the late autumn spawning.
The cycle for the most part is an annual one.
|
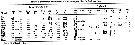 Issued from : D.C. Maclellan in Can. J. Zool., 1967, 45. [p.112, Table IV]. Issued from : D.C. Maclellan in Can. J. Zool., 1967, 45. [p.112, Table IV].
Monthly percentage composition in the inner of Godthaab Fjord (W Greenland).
Comparison between the life history C. glacialis and C. finmarchicus at the same place.
Nota: In the inner fjord, the peak of fertilization for C. finmarchicus s.str. was in March, with a peak of spawning in April when eggs and nauplii were found in considerable numbers. The short-lived adult males had disappeared by May, although adult females still dominated the samples. No collections were available from the inner fjord for the month of June. By July, the new generation had reached stages IV and V, and a small percent had attained adult male and female form by August. In the September samples, although the highest percent was in stage V, adult males and females formed 30% of the population. No collections were found from the inner fjord for October or November but a small December sample contained two adult females with unripe eggs.
The cycle in the inner fjord is largely annual; spawning begins a month later than in the outer fjord, but stage V is reache maturity by late October in the outer fjord.d earlier and maturity achieved by a larger percentage of the population by September compared to the smaller percentage which attain maturity by late October in the outer fjord. |
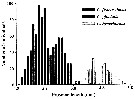 Issued from : G.J. Parent, S. Plourde & J. Turgeon in J. Plankton Res., 2011, 33 (11). [p.1658, Fig.2]. Issued from : G.J. Parent, S. Plourde & J. Turgeon in J. Plankton Res., 2011, 33 (11). [p.1658, Fig.2].
Prosome length overlap among three Calanus species, copepodites stage V, along the Canadian Arctiç and Atlantic Coasts when all stations from both years are pooled (N = 1159.
Studied region from 43.8° N, 69.5° W to 59.9° N, 58.6° W and thoo Arctic stations: 74.1° N, 108.8° W.; 74.2° N, 80.5 W. See Chart of stations (Fig.1). |
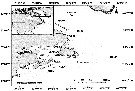 Issued from : G.J. Parent, S. Plourde & J. Turgeon in J. Plankton Res., 33 (11). [p.1658, Fig.1]. Issued from : G.J. Parent, S. Plourde & J. Turgeon in J. Plankton Res., 33 (11). [p.1658, Fig.1].
Sampling stations for Calanus species on the canadian Arctic and Atlantic Coasts. |
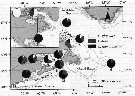 Issued from : G.J. Parent, S. Plourde & J. Turgeon in Limnol. Oceanogr., 2012, 57 (4). [p.1059, Fig. 1]. Issued from : G.J. Parent, S. Plourde & J. Turgeon in Limnol. Oceanogr., 2012, 57 (4). [p.1059, Fig. 1].
Map of the Arctic and North Atlantic Ocean showing the frequency of parental species and hybrids (as determined with mtDNA markers) at each station. |
 Issued from : G.J. Parent, S. Plourde & J. Turgeon in Limnol. Oceanogr., 2012, 57 (4). [p.1058, Table 1]. Issued from : G.J. Parent, S. Plourde & J. Turgeon in Limnol. Oceanogr., 2012, 57 (4). [p.1058, Table 1].
Description of sampling stations and genetic identification of parental species and hybrids based on nucDNA markers.The number of genotypes classified as C. glacialis (G), hybrids (H), and C. finmarchicus (F) are given for each station. |
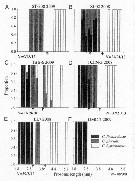 Issued from : G.J. Parent, S. Plourde & J. Turgeon in J. Plankton Res., 2011, 33 (11). [p.1659, Fig. 3]. Issued from : G.J. Parent, S. Plourde & J. Turgeon in J. Plankton Res., 2011, 33 (11). [p.1659, Fig. 3].
Spatial variability in the extent of prosome length overlap among Calanus species.
Arrows indicate ODPL (the optimized discriminant prosome length). For each station, the number of individuals (N) are given, respectively, for C. finmarchicus, gnacialis, hyperboreus (See Chart , fig.1).
Rem.: At each station, the authors used discriminant analyses to define prosome lengths that minimize species misidentification. Discriminant analysis aims at establishing rules for allocating individuals to a priori defined groups (here, species based on molecular-based identyification) using information provided by one or several characteristics (here, prosome length) of each individual (see Der & Everitt, 2002). ODPL is used to assess concordance between molecular-based and size-based identification and calculate the species diagnosis error rate. |
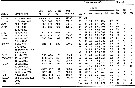 Issued from : G.J. Parent, S. Plourde & J. Turgeon in J. Plankton Res., 2011, 33 (11). [p.1657, Table II]. Issued from : G.J. Parent, S. Plourde & J. Turgeon in J. Plankton Res., 2011, 33 (11). [p.1657, Table II].
Sampling specifications and Calanus finmarchicus prosome length (PL mm) at each station based on genetic species identification overlap between Calanus hyperboreus (H) Calanus glacialis (G), C. fiunmarchicus (F), as FG, GH and FH.
For each pair of species PL overlap (%) is the ratio of PL overlap (mm) over the total PL range (mm) of both species. FG, GH and FG indicate pairwise species PL overlap.
Samp depth, sampling depth; N/S, species PL range was not subsampled; N/A, species was absent from the sample.
a Stations used to test inter-annual variability.
b Stations TCEN-2 (2009) and RCEN-3 (2008) are 19 km apart and were used as temporal replicates. |
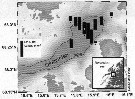 Issued from : B. Espinasse, S.L. Basedow, V. Tverberg, T. Hattermann & K. Eiane in J. Plankton Res., 2016, 38 (3). [p.605, Fig.1] Issued from : B. Espinasse, S.L. Basedow, V. Tverberg, T. Hattermann & K. Eiane in J. Plankton Res., 2016, 38 (3). [p.605, Fig.1]
map of the study area with the location of the sampling stations.
The height of the black bar represents the abundance of copepodite stage V of Calanus finmarchicus based on the reference bar shown in the left part of the figure.
manual counting was done of samples from stations markede with a star and additional net tows were conducted at the central station (white +) for different depth layers.
The 500 m depth isobath is indicated.
Nota: C5 stage represented over 90% of the C. finmarchicus at all stations, while C4 stage, the second most abundant stage, acconted for 2-7%.
The mean abundance at stations with water deeper than 500 m was 37000 ind./m2 [SD = 7780, n = 7], compared with 13100 ind./m2 [Sd = 8200, n = 4] for shallower stations. very low abundances (± 290 ind./m2) were measurd in the upper 100 m at the central station.
A rough estimation of the C. finmarchicus stock in the study area was done compurting the areas deeper and shallower than 500 m, respectively, and corresponding mean abu,dances, this resulted in a stock size of 2.45 x 10 power 12 individuals which is equivalent to a carbon biomass of 333 t (assuming 0.136 mg C/ind.
The limited data available in the litterature suggests that the mean abundance of overwintering Calanus in Norwegian coastal waters tends to be between 10000 and 12000 ind./m2. In comparison, data from the shelf break and oceanic locations off the Lofoten shelf are generally higher with mean values about 25-30000 ind./m2 and maximum values up to 150000 ind./m2.
The data in Ototfjorden from the authors, indicate abundances in the study area comparable with those previously found in the fjords (mean of 29000 and 37000 ind./m2 for the deepest stations). |
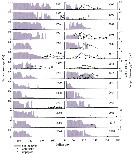 Issued from : E.F. Møller & T.G. Nielsen in Limnol. Oceanogr., 2019, 9999. [p.3, Fig.2]. Issued from : E.F. Møller & T.G. Nielsen in Limnol. Oceanogr., 2019, 9999. [p.3, Fig.2].
Fig.2: Sea ice cover, Chl a, and total copepod biomass in the upper 50 m in Disko Bay (except in 2016-2018 where zooplankton were collected at 0-100 m) in Disko Bay (W Greenland, 69°N, 53°W).
From the early sampling period until 2018, there has been an increase in the relative contribution of Calanus finmarchicus female biomass to the total Calanus female biomass, C. finmarchicus constituting, on average, 64 % of the biomass in 2005-2018, compared with 39 % in 1992-2001.
The results evidenced that only the two periods (1992-2001 and 2005-2018) were different and that there was no interaction with the month of sampling.
The biomasses of female C. hyperboreus and C. glacialis were significantly positively correlated with sea ice cover. C. finmarchicus female biomass was positively correlated with the inflow of the fraction of Atlantic water, estimated from the relative nitrate-to-phosphate relationships expected in polar and Atlantic water (Hansen & al., 2012). |
 Issued from : E.F. Møller & T.G. Nielsen in Limnol. Oceanogr., 2019, 9999. [p.3, Fig.2]. Issued from : E.F. Møller & T.G. Nielsen in Limnol. Oceanogr., 2019, 9999. [p.3, Fig.2].
Individual mean length and lipid content of Calanus spp. females collected in the upper 100 m in Disko Bay in May-June 2008 (from Swalethorp & al., 2011). |
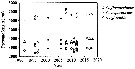 Issued from : E.F. Møller & T.G. Nielsen in Limnol. Oceanogr., 2019, 9999. [p.7, Fig.6]. Issued from : E.F. Møller & T.G. Nielsen in Limnol. Oceanogr., 2019, 9999. [p.7, Fig.6].
Average length of prosome female Calanus spp. on each sampling date in May/June in Disko Bay. |
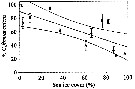 Issued from : E.F. Møller & T.G. Nielsen in Limnol. Oceanogr., 2019, 9999. [p.7, Fig.5]. Issued from : E.F. Møller & T.G. Nielsen in Limnol. Oceanogr., 2019, 9999. [p.7, Fig.5].
The contribution (%) of Calanus finmarchicus females to the total biomass of Calanus females (Disko Bay) in relation to sea ice cover (April).
As is data from the early sampling period (1992-2001), and B is data from the later period (2005-2018).
Lines are the linear regression and the 95% confidence intervals. |
 Issued from : E.F. Møller & T.G. Nielsen in Limnol. Oceanogr., 2019, 9999. [p.8, Table 5]. Issued from : E.F. Møller & T.G. Nielsen in Limnol. Oceanogr., 2019, 9999. [p.8, Table 5].
Average biomass (mgC m-3) of Calanus finmarchicus, C. glacialis and C. hyperboreus in May and June 1996, 1997, and 2008 in Disko Bay (W Greenland).
SD = standard deviation and n is number of samples.
Note the increase of the small species (C. finmarchicus contrary to the greatest (C. hyperboreus with the time due to the Atlantic waters inflow. |
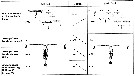 Issued from : E.F. Møller & T.G. Nielsen in Limnol. Oceanogr., 2019, 9999. [p.9, Fig.7]. Issued from : E.F. Møller & T.G. Nielsen in Limnol. Oceanogr., 2019, 9999. [p.9, Fig.7].
Estimate of changes in community composition of the female part of the Calanus population between the early and late sampling periodf and the effects of community change on the average size and lipid content of the female Calanus community in the Disko Bay (W Greenland).
All changes were significant (t-test, p <0.05).
The target is to demonstrate the effect of the climatic change in the time and the effects on the biomass because the change in the species composition and the consequential effects on the food-web, and particularly on the fishes' diet. |
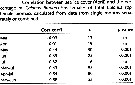 Issued from : E.F. Møller & T.G. Nielsen in Limnol. Oceanogr., 2019, 9999. [p.8, Table 6]. Issued from : E.F. Møller & T.G. Nielsen in Limnol. Oceanogr., 2019, 9999. [p.8, Table 6].
Correlation between sea ice civer (April) and the percentage of Calanus finmarchicus females of total Calanus spp. (C. glacialis, C. hyperboreus) female biomass calculated from data from single months separately or combined in the Disko Bay (W Greenland). |
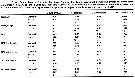 Issued from : E.F. Møller & T.G. Nielsen in Limnol. Oceanogr., 2019, 9999. [p.978, Table 4]. Issued from : E.F. Møller & T.G. Nielsen in Limnol. Oceanogr., 2019, 9999. [p.978, Table 4].
Correlation Coefficients (Corr Coef) of calanus spp. female biomass and physical conditions (Ice cover, FWA: Atlantic water input, NAO: North Atlantic Oscillation, AO: Arctic Oscillation) based on average from May and June in Disko Bay (W Greenland) from 1991 to 2018. |
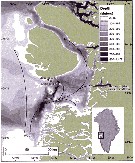 Issued from : E.F. Møller & T.G. Nielsen in Limnol. Oceanogr., 2019, 9999. [p.2, Fig.1]. Issued from : E.F. Møller & T.G. Nielsen in Limnol. Oceanogr., 2019, 9999. [p.2, Fig.1].
Location of the Calanus spp. sampling site in Disko Bay (W Greenland).
WGC = West Greenland Current. |
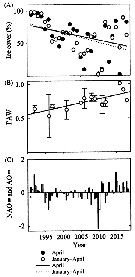 Issued from : E.F. Møller & T.G. Nielsen in Limnol. Oceanogr., 2019, 9999. [p.4, Fig.3]. Issued from : E.F. Møller & T.G. Nielsen in Limnol. Oceanogr., 2019, 9999. [p.4, Fig.3].
(A) Sea ice cover in Disko Bay (W Greenland) in April and January to April. (B) FAW (fraction of the North Atlantic inflow) estimated from nutrient concentrations in May/June. (C) Ao and NAO (Arctic Oscillation and North Atlantic Oscillation).
Nota: The period with 100% sea ice cover in Disko Bay decreased from 1991 to 2018. The average sea ice cover in April and winter ice has decreased during last 25 yr and also the year-to-year variation in the sea ice cover has increased in the last decade; in some years there has been virtually no ice and in others extensive sea ice cover appeared in early spring.
The influence of Atlantic water on Disko Bay was based on measures at 150-200 m depth in May-June calculated from nutrient concentrations. This influence has increased during the last 25 yr but is not significantly related to either the Arctic Oscillation, North Atlantic Oscillation, or the sea ice cover.
The data showed that the phytoplankton spring bloom began in association with the sea ice breakup and continued for 20-30 days. The temporal resolution of the Chla data from the early years did not allow us to estimate the exact peak day of the spring bloom and changes during the last 25 yr. (in fig.2). |
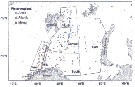 Issued from : J.M. Aarflot, H.R. Skjoldal, P. Dalpadado & M. Skern-Mauritzen in ICES J. Mar. Sc., 2018, 75 (7). [p.2344, Fig.1]. Issued from : J.M. Aarflot, H.R. Skjoldal, P. Dalpadado & M. Skern-Mauritzen in ICES J. Mar. Sc., 2018, 75 (7). [p.2344, Fig.1].
Geographical distribution of samples analysed in this study (n = 616). The Barents Sea was divided into five oceanographic regions with dominating water mass and bottom depth (mean of sampling stations in m) (West: 70-75°N, 15.5-21°E : Atlantic; South: 70-73.5°N, 21-40°E : Atlantic; Central: 74-78°N, 21-38°E : Arctic/mixed; North: 78-80°N, 25-36°E : Arctic/mixed; East: 71-80°N, 41-61°E : Arctic/mixed.
Outer bounds of the polygons are included as a visual aid. Samples were defined as Artic (T >0°C), Atlantic (T >3°C), or mixed (0°CThe Fugløya-Bear transect (FB transect: grey line in the figure) is a standard oceanographic transect in the western region covered five to eight times each year. Samples are regularly processed for species identification, and have consistent seasonal coverage since 1995.
For the authors, Calanus spp. are crucial prey for fishes, seabirds and mammals in the Barents Sea ecosystems, as in the Northwern Atlantic. The objective is to determine the respective contribution of the main pelagic copepods, Calanus finmarchicus, C. hyperboreus,C. glacialis collected over 30-year period. These copepods constitute around 80 % of the total. Though the Calanus species co-occur in most regions, C. glacialis dominates in the Artic waters, while C. finmarchicus dominates in Atlantic waters. The larger (in size) C. hyperboreus has considerably lower biomass in the Barents Sea, than the other Calanus species
In the western area of the Barents Sea , the authors observe indications of an ongoing borealization of the zooplankton community, with a decreasing proportion of C. glacialis over the past 20 years, and the Atlantic C. finmarchicus have increased during the same period. |
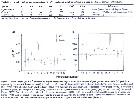 Issued from : J.M. Aarflot, H.R. Skjoldal, P. Dalpadado & M. Skern-Mauritzen in ICES J. Mar. Sc., 2018, 75 (7). [p.2345, Table 3, Fig.3]. Issued from : J.M. Aarflot, H.R. Skjoldal, P. Dalpadado & M. Skern-Mauritzen in ICES J. Mar. Sc., 2018, 75 (7). [p.2345, Table 3, Fig.3].
Table 3: Dry weight (µg) per copepoditestage (CI-CVI female and male) for Calanus spp. used to estimate biomass in this study (after different authors' data).
Figure 2: Mean weight (µg ind-1, points in figure) for copepodite stage CV and adult females of (a) C. finmarchicus, and (b) C. glacialis as reported by litterature (x-axis). vertical lines show the range of weights, or mean ± DD. Horizontal lines show the values employed in this study when estimating species biomass for stage V (dotted) and females (dashed). |
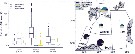 Issued from : J.M. Aarflot, H.R. Skjoldal, P. Dalpadado & M. Skern-Mauritzen in ICES J. Mar. Sc., 2018, 75 (7). [p.2347, Figs. 4, 5]. Issued from : J.M. Aarflot, H.R. Skjoldal, P. Dalpadado & M. Skern-Mauritzen in ICES J. Mar. Sc., 2018, 75 (7). [p.2347, Figs. 4, 5].
Fig.4: Estimated proportions of total mesozooplankton biomass for C. finmarchicus, C. glacialis, C. hyperboreus in different water masses defined as Atlantic (T >3°C), Arctic (T <0°C), and mixed (0°CNumber of samples (n) from each water mass is indicated in the x-axis labels. The graph presented excludes 12 observations with estimated proportions > 200%. The boxes are divided by the median value, and framed by the upper and lower quartile. The whiskers extend to the first outlier in each direction; other outliers are shown by separate points. Outliers are defined as data points > 1.5 times the upper quartile.
Fig.5: Estimated proportion of C. finmarchicus, C. glacialis, C. hyperboreus biomass to total mesozooplankton biomass in different regions of the Barents Sea, based on arithmetic means (g dry weight m-2) per region
The size of the cakes is proportional to the total mesozooplankton biomass. ''Other'' represents the total minus the estimated mean biomass of the Calanus species. The ''Other '' category is usually dominated by species like Metridia spp., Pseudocalanus spp., Microcalanus spp., Oithona spp., Oncaea spp. and Clione limacina
Winter samples from region West are not included in the figure. |
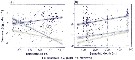 Issued from : J.M. Aarflot, H.R. Skjoldal, P. Dalpadado & M. Skern-Mauritzen in ICES J. Mar. Sc., 2018, 75 (7). [p.2348, Fig.6]. Issued from : J.M. Aarflot, H.R. Skjoldal, P. Dalpadado & M. Skern-Mauritzen in ICES J. Mar. Sc., 2018, 75 (7). [p.2348, Fig.6].
Estimated biomass of the three Calanus species against (a) temperature and (b) sampling depth, with data from equipment WP2 (180 µm mesh aperture) and season autumn.
Predictions (straight lines with 95% confidence bands) are from the linear models log (Calanus sp. dw)-temperature + season + depth + equipment (r2 = 0.38 for C. finmarchicus, 0.52 for C. glacialis, and 0.31 for C. hyperboreus, with mean levels of depth (a) and temperature (b). |
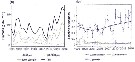 Issued from : J.M. Aarflot, H.R. Skjoldal, P. Dalpadado & M. Skern-Mauritzen in ICES J. Mar. Sc., 2018, 75 (7). [p.2348, Fig.7]. Issued from : J.M. Aarflot, H.R. Skjoldal, P. Dalpadado & M. Skern-Mauritzen in ICES J. Mar. Sc., 2018, 75 (7). [p.2348, Fig.7].
(a) Mean sampled June and August mesozooplankton biomass (g dry weight m2 in the Barents Sea, region West, from 1995 to 2016.
Figure shows total biomass and biomass divided into three size fractions.
(b) Mean estimated proportion (%) of C. finmarchicus, C. glacialis, C. hyperboreus in the corresponding samples. Error bars show ± the SEM proportion. One potential outlier with estimated proportion of C. finmarchicus > 500 % was removedin the figure. The trend lines are results from GAM models ( generalysed additive models) with species proportions as response and year as explanatory variable; p = 0.003, 0.04, and 0.002 for C. finmarchicus, C. glacialis, C. hyperboreus, and deviance explained is 10, 4.2, and 12%, respectively. |
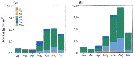 Issued from : J.M. Aarflot, H.R. Skjoldal, P. Dalpadado & M. Skern-Mauritzen in ICES J. Mar. Sc., 2018, 75 (7). [p.2349, Fig.8]. Issued from : J.M. Aarflot, H.R. Skjoldal, P. Dalpadado & M. Skern-Mauritzen in ICES J. Mar. Sc., 2018, 75 (7). [p.2349, Fig.8].
Mean biomass (g dry weigt m2) per stage (CI to CV and CVI female and male) for C. finmarchicus in the western region of the Barents Sea between (a) 1995-2004 and (b) 2005-2016.
The figure only displays months which have been consistently sampled over the period. |
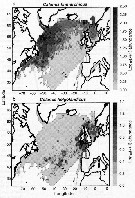 Issued from : P. Helaouët & G. Beaugrand in Mar. Ecol. Prog. Ser., 2007, 345. [p.152, Fig.3]. Issued from : P. Helaouët & G. Beaugrand in Mar. Ecol. Prog. Ser., 2007, 345. [p.152, Fig.3].
(a) Calanus finmarchicus and (b) C. helgolandicus: Spatial distribution in North Atlantic Ocean. No interpolation made.
Data on the abundance of copepods provided by the CPR survey, a large-scale plankton monitoring programme initiated by Sir Alister Hardy in 1931. CPR towed at a depth of 7 m (see in Reid & al., 2003) and investigated the area from Longitude 99.5°W to 19.5°E and Latitude 29.5° to 69.5°N.
See: Nota Calanus helgolandicus in the same authors (p. 152, Fig.3, b). |
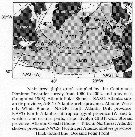 Issued from : P. Helaouët & G. Beaugrand in Mar. Ecol. Prog. Ser., 2007, 345. [p.148, Fig.1]. Issued from : P. Helaouët & G. Beaugrand in Mar. Ecol. Prog. Ser., 2007, 345. [p.148, Fig.1].
Main area sampled by the Continuous Plankton Recorder (CPR) survey from 1960 to 2002. |
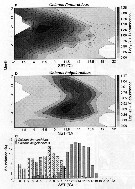 Issued from : P. Helaouët & G. Beaugrand in Mar. Ecol. Prog. Ser., 2007, 345. [p.154, Fig.5]. Issued from : P. Helaouët & G. Beaugrand in Mar. Ecol. Prog. Ser., 2007, 345. [p.154, Fig.5].
Calanus finmarchicus and C. helgolandicus (a, b): Contour diagram of abundance (decimal logarithm) as a function of the Sea surface temperature (SST) and month of year, and (c) histogram showing percent relative average abundance as a function of SST.
Nota: Abundance of C. finmarchicus was maximal at 6.4 to 7.3 ml l-1, C. helgolandicus was found in water with less oxygen (5.9 to 6.6 ml l-1. Chlorophyll a concentration did not completely, separate the species. Higher abundance of C. finmarchicus corresponded to phosphate concentrations between 0.2 and 0.8 µmol l-1, for C. helgolandicus, the optimum was between 0.1 and 0.3 µmol l-1.
As in the case of salinity and temperature, high abundance of C. helgolandicus was located in a more restricted tolerance range and time interval.
Other nurtrient profiles (nitrate, silicate) showed that C. finmarchicus occurred in waters containing more nutrients than its congener.
C. finmarchicus was located in waters with a higher index of turbulence than C. helgolandicus. Similar results were found for the mixed-layer depth. |
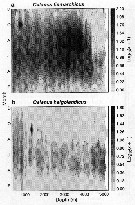 Issued from : P. Helaouët & G. Beaugrand in Mar. Ecol. Prog. Ser., 2007, 345. [p.156, Fig.7]. Issued from : P. Helaouët & G. Beaugrand in Mar. Ecol. Prog. Ser., 2007, 345. [p.156, Fig.7].
(a) Calanus finmarchicus and (b) C. helgolandicus: Abundance (decimal logarithm) as a function of bathymetry and month of year.Nota: C. finmarchicus was mainly abundant at depths ranging from 269 to 3513 m, but can be found in regions of low bathymetry. The species was primarily found in regions with low to medium spatial variability in bathymetry. C. helgolandicus was more often found in regions characterized by a bathymetry between 82 and 1216 m, despite the fact that a second mode was detected at depths > 4000 m. This last mode was probably related to expatriate individuals in the region near the Bay of Biscay. The species was identified in regions characterized by a higher spatial variability in bathymetry, reinforcing its classification as pseudo-oceanic (i.e. occurring in both neritic and oceanic regions but is mainly abundant above the shelf-edge). |
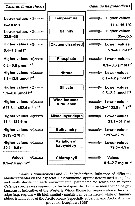 Issued from : P. Helaouët & G. Beaugrand in Mar. Ecol. Prog. Ser., 2007, 345. [p.163, Fig.16]. Issued from : P. Helaouët & G. Beaugrand in Mar. Ecol. Prog. Ser., 2007, 345. [p.163, Fig.16].
Infuence of different abiotic variables on Calanus finmarchicus and Calanus helgolandicus.
Nota: A remarkable feature of the authors' study is that the environmental optimum of Calanus species varies seasonally for all abiotic parameters. Theses seasonal fluctuations might be influenced by the spatial variability in the seasonallity of both species (Planque & al., 1997).
For C. finmarchicus, seasonal fluctuations could be related to large-scale differences in the timing of ontogenetic vertical migration. Another hypothesis is that they could be related to the differential sensivity of the mean developmental stages of Calanus population to temperature that has been observed in some experiments (Harris & al., 2000)
The use of this 'ecological niche approach' has allowed an explanation of the shift in Calanus dominance to be outlined. Reid & al. (2003b) showed a substantial and sustained reduction in the percentage contribution of C. finmarchicusCalanus in the North Sea. While in 1962, C. finmarchicus comprised 80% of Calanus spp. in the North Sea, C. helgolandicus comprised 80% of Calanus identified by the Continuous Plankton Recorder (CPR) survey in 2000.
Calanus dominance in the North Sea is highly sensitive to temperature, especially in spring and summer. The authors have demonstrated that the shift in dominance could have been triggered solely by temperature changes in the North Sea. Sea surface tepmperature (SST) changes are likely to be related to changes in ai(r temperature (Beaugrand, 2004b) over the region and changes in advection recently discussed in Reid & al. (2003b). Reid & al. (2003b) reported that when the North Atlantic Oscillation (NAO) was positive, the strength of the European shelf-edge current, which flows northwards, increased and that oceanic inflow into the northern part of the North Sea was strengthened.
During the cold regime in the North Sea prior to 1980, this region was the boundary between a subarctic biome and a more temperate biome (Longhurst, 1998).
As C. finmarchicus is indicative of the Atlantic Arctic buiome, the change in the proportion of Calanus in the North Sea may indicate ythat the subarctic biome has moved northwards.
A northward movement of plankton has been detected using calanoid copepods in the northeastern part of the North Atlantic (Beaugrand & al., 2002) and a similar shift has been found for fish (Perry & al., 2005).
The authors showed the usefulness of Hutchinson's ecological niche concept. However, it is important to note that after the authors' study, they assessed the realised, not the fundamental, 'niche' of Calanus spp. Hutchinson (1957) made this distinction and stated that the realised 'niche' should always be smaller than the fundamental 'niche' as species interactions eliminate individuals from favourable biotopes. However, Pulliam (2000) recently showed that when dispersal is high, the realised 'niche' can be larger than the fundamental 'niche'. |
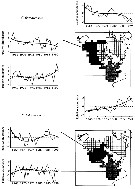 Issued from : C.B. Miller in Biological Oceanography, Blackwell Publishing, 2004/2005. [p.357, Fig.16.11]. After Planque & Ibanez, 1997. Issued from : C.B. Miller in Biological Oceanography, Blackwell Publishing, 2004/2005. [p.357, Fig.16.11]. After Planque & Ibanez, 1997.
Variation of Calanus helgolandicus and C. finmarchicus abundance in the North Sea, Norwegian Bight (west of southern Norway and Faeroes-Iceland sector 1958-1996. |
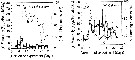 Issued from : S. Ban, C. Burns & al. in Mar. Ecol. Profg. Ser., 1997, 157. [p.290, Fig.2]. Issued from : S. Ban, C. Burns & al. in Mar. Ecol. Profg. Ser., 1997, 157. [p.290, Fig.2].
Calanus finmarchicus + Thalassiosira nordenskioldii. Mean daily fecundity with S.E. and hatching success of eggs spawned by females fed with a diatom diet at 2 different concentrations similar to blooms of T. nordenskiomdii naturally occurring in the St. Lawrence Estuary.
Results are means of 4 replicate experiments. |
 Issued from : S. Ban, C. Burns, J. Castel, Y. Chaudron & al. in Mar. Ecol. Prog. Ser., 1997, 157. [p.289, Table 1]. Issued from : S. Ban, C. Burns, J. Castel, Y. Chaudron & al. in Mar. Ecol. Prog. Ser., 1997, 157. [p.289, Table 1].
Synopsis of feeding/reproduction experiments. A total of 17 diatom and 16 copepod species, representative of a variety of worldwide temperate and subarctic environments (E: estuarine, C: coastal ocean), were screened.
Data for fecundity and hatching success are average values measured at the start and end of the inciubations in a minimum of 3 replicate batches, showing the variation in time of the effects of diatoms on copepod reproduction.
Level of significance of the diatom effect between treatments and controls (e.g. non-diatom diets) in categories I to III was p < 0.01. No.. rank (for comparison with Table 2, p.290).
For the signification of the categories I to IV (fecundity vs. Hatching success vs. Duration of experiment days-1): See Eurytemora affinis, Calanus pacificus, Calanus finmarchicus, Temora stylifera.
List of the 12 marine or estuarine species studied (fresh water excluded. CR): Acartia clausi, A. grani, A. steueri, A. tonsa, Calanus finmarchicus, C. helgolandicus, C. pacificus, Centropages hamatus, C. typicus, Eurytemora affinis, Temora longicornis, T. stylifera. |
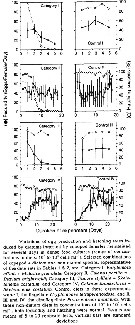 Issued from : S. Ban, C. Burns, J. Castel, Y. Chaudron & al. in Mar. Ecol. Prog. Ser., 1997, 157. [p.288, Fig. 1]. Issued from : S. Ban, C. Burns, J. Castel, Y. Chaudron & al. in Mar. Ecol. Prog. Ser., 1997, 157. [p.288, Fig. 1].
Variations of egg production and hatching rates induced by diatoms ingested by copepod females maintained for several days in dense food cultures. Selected combinations of the data sets in Table 1 & 2. For categories in function of the duration of experiments (days).
<< Among the 37 diatom-copepod combinations, there were 4 categories of responses. Except for 1 combination (Category IV), were there was no negative effect, diatoms supported either lower copepod fecundity (Category III) or hatching success (Category II) or both (Category I), when compared to non-diatom diets (p< 0.01).
Thus, while diatoms may provide a source of energy and materials for copepod growth (Vidal, 1980), they often reduce fecundity and/or hatching success. These obervations constitute the 'paradox of diatom-copepod interactions in the pelagic food-web.
The results Table 1 show that diatoms reduced fecundity, on average, by 87% (Categories I and III) and hatching success by 80% (Categories I and II) with time.
Non-diatoms diets control (Table 2) induced negligible changes in both fecundity (+16%) and hatching success (-4%)
Among cultured clones, the same diatom species showed considerable intraspecific differences in their impact (e.g. Skeletonema costatum, Phaeodactylyum tricorniutum), reflecting species-specific feeding behaviors or variable intracellular composition of the algae. Forexample, S. costatum reduced fecundity and hatching in Acartia clausi, fecundity but not hatching in Calanus helgolandicus and neither of the two in C. finmarchicus. Chaudron & al. (1996) have shown that a decrease in egg viability was significantly correlated to diatom cell concentrations in diets. >> |
 Issued from : S. Ban, C. Burns, J. Castel, Y. Chaudron & al. in Mar. Ecol. Prog. Ser., 1997, 157. [p.290, Table 2]. Issued from : S. Ban, C. Burns, J. Castel, Y. Chaudron & al. in Mar. Ecol. Prog. Ser., 1997, 157. [p.290, Table 2].
Combinations of copepod and non-diatom diets in controls in concentrations ranging from 104 to 105 cells ml-1. Data for fecundity and hatching success are average values measured at the start and end of incubation in a minimum of 3 replicate batches.
N) 8: In Category I; N); No 20: In Category II; No 31: In Category III; No 37: In Category IV. |
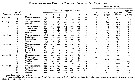 Issued from : S.M. Marshall & A.P. Orr in The Biology of Marine Copepod Calanus finmarchicus (Gunnerus). 1972, Springer-Verlag, Berlin. [p.37, Table I] Issued from : S.M. Marshall & A.P. Orr in The Biology of Marine Copepod Calanus finmarchicus (Gunnerus). 1972, Springer-Verlag, Berlin. [p.37, Table I]
Effect of different foods on egg production.
Animals' experiments from Millport ( Loch Striven, west Clyde estuary: 55°56'30''N, 5°014'56'' W).
For Marshall & Or (p.38): <It has been found at Millport that not all organisms are equally effective in egg production.
All diatoms tested were good foods but of the other organisms (Syracosphaera carterae, peridinium trochoideum, Gymnodiniumsp, Chlamydomonas sp., a Chrysomonad flagellate B II, Hemiselmis rufescens, Dicrateria inornata and Chlorella stigmatophora) the first five were good, the last three little better than starvation.. variations in the effectiveness of the foods provided, may,, in the Laboratory, be caused by factors not operating in the sea, i.e. Coscinodiçscus, and to a less extent Skeletonema, sink to the bottom of the vessel and are therefore less available to the copepod. Chlorella however was taken into the gut in quantities but seemed to pass through almost unaltered. It thus behaved like an inert substance [such as Indian ink or small plastic ball which also was passed through the gut) without effect on egg production.
Neither a ghigh pH value nor the addition of cell-free filtrate from a Chlamydomonas culture had any effect on egg laying.
The resulults indicate that metabolism is rapid and that the food taken is used immediately in the formation of eggs.. This was confirmed by feeding ripe female on Chlamydomonas cells containing radio-active phosphorus. After only 8 hours of such feeding the Calanus laid strongly radio-active eggs. An analysis of the animal showed that of the radio-active P retained about 50% was concentrated in the ovary and oviducts. |
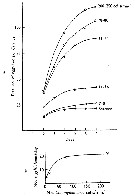 Issued from : S.M. Marshall & A.P. Orr in The Biology of Marine Copepod Calanus finmarchicus (Gunnerus). 1972, Springer-Verlag, Berlin. [p.36, Fig. 18]. Issued from : S.M. Marshall & A.P. Orr in The Biology of Marine Copepod Calanus finmarchicus (Gunnerus). 1972, Springer-Verlag, Berlin. [p.36, Fig. 18].
Experiment on feeding Calanus finmarchicus with Chlamydomonas cultures of different concentrations.
a: effect on egg production; b: average number of eggs laid per day. |
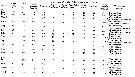 Issued from : S.M. Marshall & A.P. Orr in The Biology of Marine Copepod Calanus finmarchicus (Gunnerus). 1972, Springer-Verlag, Berlin. [p.104, Table IX]. Issued from : S.M. Marshall & A.P. Orr in The Biology of Marine Copepod Calanus finmarchicus (Gunnerus). 1972, Springer-Verlag, Berlin. [p.104, Table IX].
Percentage of feeding Calanus finmarchicus vs. guts contain. |
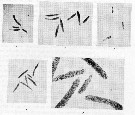 Issued from : S.M. Marshall & A.P. Orr in The Biology of Marine Copepod Calanus finmarchicus (Gunnerus). 1972, Springer-Verlag, Berlin. [p.110, Fig. 42]. Issued from : S.M. Marshall & A.P. Orr in The Biology of Marine Copepod Calanus finmarchicus (Gunnerus). 1972, Springer-Verlag, Berlin. [p.110, Fig. 42].
(b-f) faecal pellets produced by female Calanus finmarchicus on different types of food: (b) Chlamydomonas, (c) lauderia, (d)'ghost' pellets, (e) peridinium trochoideum, (f) the same enlarged to show the individual skeletons in the pellets. (b-e) x 20, (f) x 80.
Nota: In a series of experiments, the pellets produced vary very much with the kind of food given. Those produced with Chlamydomonas as food are well-compacted and dark colour, those produced with diatoms are less compacted, lighter in colour and usually larger, in those produced with peridinians the skeletons are visible inside, bulging out the pellet.
Harvey & al. (1935) conted the faecal pellets produced as a method of measuring the grazing down of the phytoplankton and in the laboratory. Since it seemed a quick and convenient way of measuring the amount of feeding it was used for a number of experiments on the effect of different factors. on feeding. The size of the pellets produced by one animal varies, and the number can be only an approximate mesure of the food eaten (See Gauld, 1951). Ussing (1938) suggested that the maxillary filter of an adult Calanus would not be fine enough to sieve out µ-flagellates. Dicrateria inornata, a flagellate about 3-5.5 µ in diameter was taken by all stages from copepodite Stage I to adult.. Naumann (1923) has stated that calanoid copepods can filter off particles as small as 1 µ.
Inert matter is taken also in too and formed into faecal pellets. |
 Issued from : S.M. Marshall & A.P. Orr in The Biology of Marine Copepod Calanus finmarchicus (Gunnerus). 1972, Springer-Verlag, Berlin. [p.112, Table X]. Issued from : S.M. Marshall & A.P. Orr in The Biology of Marine Copepod Calanus finmarchicus (Gunnerus). 1972, Springer-Verlag, Berlin. [p.112, Table X].
Average length of faecal pellets of Calanus finmarchicus fed on Chlamydomonas culture.
Nota: Observations on the faecal pellets produced under experimental conditions by the developmental stages have shown that the mainj difference is in their size, apart from the male, increases with each moult. When fed on the same culture, the number of pellets produced does not depend on the stage of development (excepting the male) and oftyen all stages produce approximately the same number of faecal pellets. |
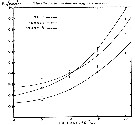 Issued from : S.M. Marshall & A.P. Orr in The Biology of Marine Copepod Calanus finmarchicus (Gunnerus). 1972, Springer-Verlag, Berlin. [p.115, Fig. 43]. Issued from : S.M. Marshall & A.P. Orr in The Biology of Marine Copepod Calanus finmarchicus (Gunnerus). 1972, Springer-Verlag, Berlin. [p.115, Fig. 43].
Calanus finmarchicus (from Millport): Effect of temperature on oxygen consumption.
Nota: << Interest in the respiration is centred chiefly in the food requirements to understand the food-web of the ecosystem considered (at the local, regional or most global zonation scale, and the evolution in the time). The estimations were made by Winkler's method.
marshall & Orr (p.116) show that temperature has a marked effect on the respiration of Calanus finmarchicus: the oxygen consumption doubles from 0 to 10°C and above this increases at a still greater rate and thus does not follow van't Hoff's law.
The values for male and female are close (differences not significant). For stage V, the values are always lower even in spite of their greater activity. At 20°C the Calanus are close to their lethal temperature.
Variations in the oxygen content of the sea may be quite large and though values much in excess of saturation are uncommon, low values may be present in deep water in localities where there is poor circulation or breakdown following intense productivity in the upper layers. It was found that at 15°C even very high values for oxygen content (up to 16ml/l) had no effect on the oxygen consumption. When the oxygen decreases, there was a rapid fall in respiration at about 3 ml/l at 15°C. This drop in oxygen consumption was apparently a symptom of unhealthiness as well for a number died at values of 3.3 ml/l and the death rate increased rapidly at lower oxygen contents. Male were the most sensitive to oxygen reduction.. At about 3 ml/l or below females were slightly more resistant than males while Stage V withstood oxygen reduction to considerably lower values. See in Marshall & Orr (1927): the sensitivity to low oxygen content is surprising for in the sea Ccalanus may be abundant in places where the oxygen content falls as low as 2ml/l. Also in the Black Sea in February when the oxygen content is below 1 ml/l and temperature 7°C (Nikitin, 19321).
One of the most surprising facts about the respiration is the increase caused by exposure to light; in bright diffuse light or in sunshine the respiration may be double what it is in the dark. Since the effect was gratest at the surface and decreases rapidly with depth.
A lowering of the salinity has an effect on the respiration: by reducing the salinity gradually a high percentage of experimental animals can tolerate salinities of 17 p.1000. When the respiration values at salinities of 34, 27 and 17 p.1000 are compared there is a reduction only at the lowest salinity from about 0.38 µl/copepod/hour to 0.25 µl/copepod/hour. >> |
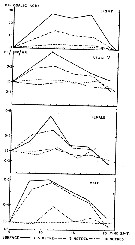 Issued from : S.M. Marshall & A.P. Orr in The Biology of Marine Copepod Calanus finmarchicus (Gunnerus). 1972, Springer-Verlag, Berlin. [p.118, Fig. 44]. Issued from : S.M. Marshall & A.P. Orr in The Biology of Marine Copepod Calanus finmarchicus (Gunnerus). 1972, Springer-Verlag, Berlin. [p.118, Fig. 44].
Calanus finmarchicus (from Millport): The oxygen consumption at different depths in the sea and its relation to light intensity.
D = value for oxygen consumption in the dark. |
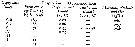 Issued from : S.M. Marshall & A.P. Orr in The Biology of Marine Copepod Calanus finmarchicus (Gunnerus). 1972, Springer-Verlag, Berlin. [p.120, Table XI]. Issued from : S.M. Marshall & A.P. Orr in The Biology of Marine Copepod Calanus finmarchicus (Gunnerus). 1972, Springer-Verlag, Berlin. [p.120, Table XI].
Calanus finmarchicus (from Millport): Respiration µlO2 copepod-1 hour-1 vs. Copepodite stages.
Nota: << It is possible to obtain from approximate figures for the respiration of the earlier copepodite stages by extrapolation on the graph given by Raymont & Gauld (1951) relating copepodite length to respiration. When plotted on logarithmic co-ordinates the respiration of Centropages, Calanus, Euchaeta of different sizes was found to be on an approximate straight line whose equation is Log R = 2.19 Log L - 0.928. The smallest copepod used ha a length of 0.86 mm (Centropages hamatus) and the largest (Euchaeta norvegica) 5.1 mm. Pütter (1924-25) calculated that Calanus requires as food 39% of its body weight per day and a smaller copepod (Oithona) requires 60% of its body weight per day. For Calanus, Pütter recorded a utilization of 1.83 µlO2 copepod-1 hour-1 (1922) or roughly 2 to 3 times the values found later by other workers.
From January to march the stage V Calanus in the Clyde area weighed about 0.15 mg per individual and the oxygen consumption at 5°C was about 0.17 µl/Calamus/hour. From April to July they weighed an average of about 0.30 mg and the oxygen consumption was about 0.42 µl/Calanus/hour at 15°C.
From these figures it follows that the food requirements of stage V Calanus in winter lie between 0.002 and 0.006 mg per individual per day and in summer between 0.005 and 0.013 mg. In each case the lower value given is that for fat and the higher that for carbohydrate. These figures indicate that for stage V the amount of food required daily (expressed as a percentage of the body dry weight) of one Calanus, lies between 1.3% and 3.6% in winter and 1.7% and 4.5% in summer. In bright light the percentage lies between 2.2 and 2.8 in winter and 6.2 and 7.6 in summer. All these values are very lower than that calculated by Pütter for Calanus.
Little is known of the manner of uptake of oxygen by copepods. According Krogh (1941) copepods can obtain the oxygen by diffusion through the cuticle, perhaps in the antennules. After Hartog (1888) a reversed peristaltsis is visible for a short distance at the anal end of the gut, but for Fox (1952) the reversed anal peristalsis causes an uptake of water whose effect is to extend the walls of the gut, so increasing peristalsis there and facilitating defaecation, so this function is not respiratory. >> |
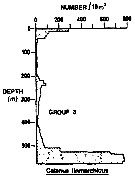 Issued from : R.K. Pipe & S.H. Coombs in J. Plankton Res., 1980, 2 (3). [p.230, Fig.4]. Issued from : R.K. Pipe & S.H. Coombs in J. Plankton Res., 1980, 2 (3). [p.230, Fig.4].
Calanus finmarchicus from Wyville Thomson Ridge (60°03.4' N, 07°03.9' W to 60°08' N, 07°02.9' W) on 24 April 1978: Vertical distribution.
Members of this group (Group 3) contained six of the most abundant taxa and would not be associated with a single water mass. Three species of copepods (C. finmarchicus, Metridia lucens, Scolecithricella minor) accounted for 92% of the organisms in the group; of these the most numerous was C. finmarchicus which was predominantly within Norwegian Sea Deep water below 530 m but also had a secondary peak in abundance at the surface and a minor between 230-240 m in the North Atlantic Oceanic water (see Vinogradov, 1968; Østvedt, 1955; Longhurst & Williams, 1979); most of the specimens were overwintering adults and the secondary peak in abundance in North Atlantic Oceanic water suggest the start of the seasonal migration toward the surface. |
| | | | Loc: | | | N Atlant. (E-W), off Cape Hatteras, Chesapeake Bay, Delaware Bay, Cape Cod Canal, off E Cape Cod, Narragansett Bay, Portsmouth, off Woods Hole, Gulf of Maine, Georges Bank, off SE & SW Nova Scotia, Emerald Basin, Roseway Basin, off Halifax, Bay of Fundy, St. Georges Bay, Shédiac Bay, St. Margaret's Bay, Northumberland, Passamaquoddy Bay, Baie des Chaleurs, G. of St Lawrence, Saguenay fjord, upper St. Lawrence Estuary, off S & E Newfoundland (Grand Bank, Flemish Cap), Davis Strait, Disko Bay, Nuuk, Ameralik & Godthaab fjords, Baffin Bay, Labrador Sea, Irminger Sea, SW Iceland, N Mid-Atlantic Ridge, Caribbean Colombia (Tayrona, Magdalena, in Medellin-Mora & Navas S., 2010 (p.275, Tab. 2); Sargasso Sea, Station "S" (32°10'N, 64°30'W), Azores, Ireland, Aran Islands, Celtic Sea (in winter), Galway Bay, Fairlie Channel (SW Scotland), Millport, Loch Fyne, Bristol Channel, ? English Channel, (? Granville), ? Biscayne Bay (deep), off W Cape Finisterre, Morocco-Mauritania (in Lidvinov & al., 2013), Moroccan coast doubtful)W Medit (with doubt)., Azores (rare), Ungava Bay, Baffin Bay, Davis Strait, off shore Godthabsfjord, Disko Bay, Fram Strait, Greenland Sea, Reykjanes Ridge, Iceland, Fram Strait, Kongsfjorden, Wyville Thomson Ridge, Spitsbergen, Rijpfjorden, Amundsen & Makarov Basins (rare), S Nansen Basin (abundant), Station M, Norway Sea, Svalbard, Rijpfjordden, Korsfjorden, Kosterfjorden, Balsfjorden, Trondheimsfjorden, off Bear Island, Barents Sea, Franz Josef Land, Pechora Sea, Laptev Sea, NE Scotland, North Sea, Dogger Bank, Fladen Ground area, Norwegian Sea (Voering Plateau, Srarion ''M''); Norway ( Tromsø fjords, Malangen fjord, Raunefjorden, Gullmarfjord, Andfjorden, Vagsfjorden, Korsfjorden, Tronheimsfjorden, Bergen, Oslo fjord, Ofotfjorden ), Skagerrak, Gullmar Fjord, Kattegat, Gulf of Mecklenburger, Baltic Sea (occasional), Arct. ( Franz Josef Land, Spitsbergen, Irminger Basin, Nansen Basin, Amundsen Basin, Makarov Basin, Canadian abyssal plain, Lomonosov Ridge) | | | | N: | 527 ? | | | | Lg.: | | | (65) F: 5-4; M: ± 3,6; (87) F: 3,6; (131) F: 4,21-2,42; M: 3,98-2,57; (328) F: ± 2,7; (329) F: 4,21-2,42; M: 3,98-2,57; (339) F: 3,8-3,3; M: 3,8-3; (1169) F: 2,844; 2,659; (1303) F: 3,12; (1191) F: 2,58-2,88; {F: 2,42-5,00; M: 2,34-3,98}
Prosome length (1098) F: 2.48-2.91.
The mean female size is 3.406 mm (n = 13; SD = 0.8058), and the mean male size is 3.357 mm (n = 7; SD = 0.6322). The size ratio (male : female) is 0.986. | | | | Rem.: | Certaines confusions existent dans la littérature d'une part entre C. finmarchicus et C. helgolandicus, et d'autre part entre C. finmarchicus et C. glacialis (Cf. Brodsky, 1955, p.2).
Les localisations en Atlantique sud, Méditerranée, Indien, Pacifique et Arctique (partie centrale) sont douteuses, sinon totalement éronnées.
Je n'ai pu préciser les limites arctiques et notamment au-delà de la mer de Barents vers la Sibérie orientale. Il est possible que la forme décrite et représentée par Gunner (1770) puisse être C. hyperboreus ou glacialis, mais l'usage est de se référer à G.O. Sars (1903).
Sars (1925, p.369) signale la présence de cette espèce à la station 299 (Mer Tyrrhénienne), mais ne la cite pas dans le texte (p.6) évoquant sa limite sud aux Açores. Rose qui l'avait signalé en baie d'Alger et à Monaco dans les travaux antérieurs à 1933 ne la cite plus mais apparaît C. helgolandicus. Furnestin & Giron (1961) signalent les deux espèces en Mer Catalane, mais Giron (1963; 1963 a) n'observe que C. helgolandicus en Mer d'Alboran. Soenen (1969, p.56) identifie les deux espèces près de la côte algérienne (en un seul exemplaire dans le cas de C. finmarchicus) et Carli (1971, p.372, tab.1) C. finmarchicus en mer Ligure. Un doute sérieux existe sur ces identifications.
Vives (1967; 1970; 1978; 1982) et Vives & al. (1975) n'ont jamais observé C. finmarchicus dans les eaux proches de la baie Ibéro-marocaine comme en Méditerranée occidentale.
Calanus finmarchicus telezkensis Stalberg,1931 (F)
Ref.: Stalberg, 1931 (p.209, figs.F)
Ref. compl.: Marshall & Orr, 1972 (p.10: Rem.); Lindley, 1992 (p.368: Rem.)
Loc.: Lac Telezker (Sibérie centrale: 51°,5 N 88 ° E)
N: 1
Lg.: F: 3-2,7; {F: 2,70-3,00}
Rem.: Variété relicte surprenante du fait de son adaptation dulçaquicole et son isolement qui nécessite confirmation. (voir in Vereshchagin, G.J., 1940. Int. Rev. Gesamten Hydrobiol. Hydrogr., 40: 390-419).
Remarque d’ordre général valable pour toutes les espèces de copépodes :
Certaines espèces, dont la majorité, sont difficiles à identifier avec certitude à partir des caractéristiques morphologiques chez les adultes, et à fortiori chez les stades naupliens et copépodites.
De ce fait on a le plus souvent utilisé les dimensions corporelles. De préférence ces mesures ont été effectuées en vue dorsale sagittale, de la partie frontale aux rames caudales incluses, les soies caudales non comprises.
Les télescopages possibles des segments abdominaux, notamment du segment anal, et des difficultés de maintenir l’horizontalité des individus, durant les mesures, entraînent une certaine variabilité de celles-ci..
Pour plus de précision, on préfère ne considérer que la mesure du prosome, mais plus rarement donnée dans la littérature.
Les données de rapports biométriques entre certains métamères et/ou segments corporels permettent un traitement statistique utile pour la discrimination des espèces comme par exemple dans le genre Clausocalanus révisé par Frost & Fleminger (1968), ou pour trois espèces du genre Calanus, Parent & al., 2011,
L'hybridation entre espèces très proches génétiquement, comme l'ont montré pour la première fois Parent, Plourde et Turgeon, entre C. finmarchicus et C. glacialis pourrait être le cas chez d'autres espèces de calanoides, comme par exemple entre Clausocalanus lividus et Clausocalanus mastigophorus d'après C. Razouls.
Voir aussi les remarques en anglais | | | Dernière mise à jour : 28/10/2022 | |
|
|
 Toute utilisation de ce site pour une publication sera mentionnée avec la référence suivante : Toute utilisation de ce site pour une publication sera mentionnée avec la référence suivante :
Razouls C., Desreumaux N., Kouwenberg J. et de Bovée F., 2005-2026. - Biodiversité des Copépodes planctoniques marins (morphologie, répartition géographique et données biologiques). Sorbonne Université, CNRS. Disponible sur http://copepodes.obs-banyuls.fr [Accédé le 14 juin 2026] © copyright 2005-2026 Sorbonne Université, CNRS
|
|
|
|




;)
;)
;)
;)
;)
;)
;)
;)
;)
;)
;)
;)
;)
;)
;)
;)
;)
;)
;)
;)
;)
;)
;)
;)
;)
;)
;)
;)
;)
;)
;)
;)
;)
;)
;)
;)
;)
;)

;)
;)
;)
;)
;)
;)
;)
;)
;)
;)
;)
;)
;)
;)
;)
;)
;)
;)
;)
;)
;)
;)
;)
;)
;)
;)
;)
;)
;)
;)
;)
;)
;)
;)
;)
;)
;)
;)
;)
;)
;)
;)
;)
;)
;)
;)
;)
;)
;)
;)
;)
;)
;)
;)
;)
;)
;)
;)
;)
;)
;)
;)
;)
;)
;)
;)
;)
;)
;)
;)
;)
;)
;)
;)
;)
;)
;)
;)
;)
;)
;)
;)
;)
;)
;)
;)
;)
;)
;)
;)
;)
;)
;)
;)
;)
;)
;)
;)
;)
;)
;)
;)
;)
;)
;)
;)
;)
;)
;)
;)
;)
;)
;)
;)
;)
;)
;)
;)
;)
;)
;)
;)
;)
;)
;)
;)
;)
;)
;)
;)
;)
;)
;)
;)
;)
;)
;)
;)
;)
;)
;)
;)
;)
;)
;)
;)
;)
;)
;)
;)
;)
;)
;)
;)
;)
;)
;)
;)
;)
;)
;)
;)
;)
;)