|
|
 |
Fiche d'espèce de Copépode |
|
|
Calanoida ( Ordre ) |
|
|
|
Calanoidea ( Superfamille ) |
|
|
|
Calanidae ( Famille ) |
|
|
|
Calanus ( Genre ) |
|
|
| |
Calanus glacialis Jaschnov, 1955 (F,M) | |
| | | | | | | Syn.: | Calanus finmarchicus : Damas & Koefoed, 1907 (part., p.382, tab.II, III); ? Mori, 1937 (1964) (p.13); Brodsky, 1950 (1972) (p.87, figs.F,M);
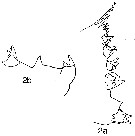
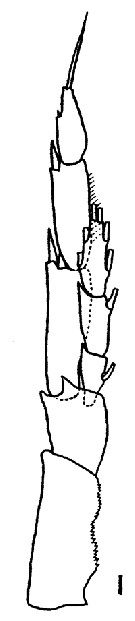
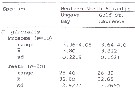
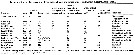
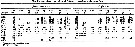
Calanus finmarchicus glacialis : Kun, 1969 (p.995, fig.F, Rem., chart); Brodsky, 1972 (1975) (p.110, 115, 118, figs.) | | | | Ref.: | | | Grainger, 1961 (p.663, figs.F,M, Rem.); Jaschnov, 1961 a (p.1326, biogeo); Brodsky, 1961 (p.14, fig.F); Jaschnov, 1963 (p.1005, fig.F, biogeo); Matthews, 1966 (p.479, Rem.); 1967 a (p.159, Rev.); Park, 1968 (p.530, figs.F, Rem.); Minoda, 1971 (p.9); Shih & al., 1971 (p.35, 201, 202: Rem.); Vidal, 1971 a (p.11, 21, figs.F,M); Frost, 1971 (p.23, figs.M, Rem.); Brodsky, 1972 (1975) (p.63, 80,); Vyshkvartzeva, 1972 (1975) (p.188, figs.); Williams, 1972 (p.53, figs.F, carte); Frost, 1974 (p.77, figs.F,M, Rev.); Bradford & Jillett, 1974 (p.6); Jaschnov, 1975 (p.33, figs.F,M); Vyshkvartzeva, 1976 (p.14 & suiv., figs.); Fleminger & Hülsemann, 1977 (p.233, figs.F,M, geographical range-taxonomic divergence); Brodsky & al., 1983 (p.156, figs.F,M, Rem.); McLaren & Marcogliese, 1983 (p.721, cell nucleus); Fleminger, 1985 (p.275, 285, Table 4, Rem.: A1); Bradford, 1988 (p.76, Rem.); Nishida, 1989 (p.173, table 1: dorsal hump); Schnack, 1989 (p.137, fig.7: Md); Kurbjeweit & Buchholtz, 1991 (p.168, A1 structures); Bucklin & al., 1995 (p.658); Harris, 1996 (p.95, 98); Chihara & Murano, 1997 (p.738, Pl.66: F,M); Sundt & Melle, 1998 (p.207, fig.2, 3, Rem.: mitochondrial sequence); Melle & Skjoldal, 1998 (p.211, Rem.); Lindeque & al., 1999 (p.91, Biomol.); Bucklin & al., 1999 (p.239, molecular systematic); Bucklin & al., 2000 (p.1237, Rem.: molecular genetic analysis); G. Harding, 2004 (p.9, figs.F,M); Dalpadado & al., 2008 (p.2266, Fig.2: Md, Table 2, 3); Nelson & al., 2009 (p.129, molecular genetic); Parent & al., 2011 (p.1654, Table II: overlaping prosome size ranges, figs.2, 3, 4, 5, Table 4: molecular identification vs size range); Gabrielsen & al., 2012 (p.1621, identification problem); Parent & al., 2012 (p.1057, fig. 1, hybridization); Choquet & al., 2017 (p.506, fig.1, mitochondrial genome, phylogeny). | 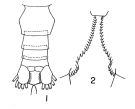 issued from : T. Park in Antarct. Res. Ser. Washington, 1968, 66 (3). [p.531, Pl.1, Figs.1-2]. Female: (subtropical-tropical Central North Pacific): 1, urosome (dorsal); 2, inner margins of coxae of P5. Nota: The proportional lengths of prosome and urosome are about 3.5-3.7:1.The genital segment is wider than long (53:47). the inner margin of the coxa of P5 has 17 to 29 teeth. The 3rd endopodal segment of P5 has 5 or 6 setae.
|
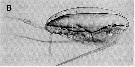
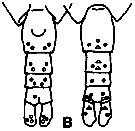 issued from K. Hulsemann in Invert. Taxon., 1994, 8. [p.1477, Fig.28, B]. Female: B: urosome (left: ventral); right: dorsal). Pore signature schematic by pooled samples (symbols are considerably larger than pores): Filled circle: 100 % presence; open circle: 95-99 % presence; triangle: 50-89 % presence. n =50.
|
 issued from : R. Williams in Bull. mar. Ecol., 1972, 8. [p.58, Fig.4]. Female (from N Atlantic): Lateral view (i) and ventral view (ii) of three urosomes showing the variation in shape of the spermathecae and the prominent operculum.
|
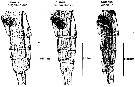 issued from : R. Williams in Bull. mar. Ecol., 1972, 8. [Plate XVII]. Female (from N Atlantic): lateral view of the urosome of the three species C. helgolandicus, C.finmarchicus and C. glacialis showing the differences in shape of their spemathecae. The edge of the operculum is easily seen in C. helgolandicus and C. finmarchicus.
|
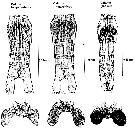 issued from : R. Williams in Bull. mar. Ecol., 1972, 8. [Plate XVIII, XIX]. Female (from N Atlantic): Above: Ventral view of the urosomes of the three species showing the obvious differences in shape of the spermathecae. The genital pore is in a more posterior position in C. glacialis than in the other two species. Below: A dorsal view of the spermathecae still attached to the basal plate. The spermatophore sac secretion which precedes the extrusion of the spermatozoa, is clearly seen in the spermathecae of C. finmarchicus. The lobed appearance of the spermathecal sacs of C. helgolandicus is also shown.
|
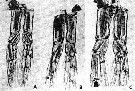
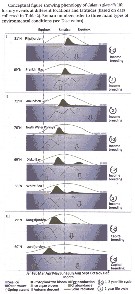
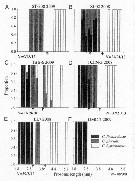
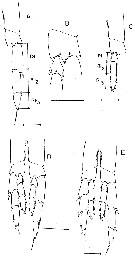 issued from : B.W. Frost in J. Fish. Res.Bd. Canada, 1971, 28. [p.24, Fig.1]. Morphometric analysis of adult males fitting the descriptions of and calanus glacialis from samples scattered throughout the North Atlantic and Arctic Oceans: Norwegian Sea, Greenland Sea, Barents Sea and Central Arctic Ocean.
Male P5 of C. glacialis: A, limits of length measurements of left exopodal segments; B, 2nd basipodal segment and proximal exopodal and endopodal segments of left leg showing condyles (arrows) used as limits of segment length measurements; C, limits of length measurements of left endopodal segments.
D: Male P5 of C. finmarchicus (prosome length 2.61 mm; exopodal segment 1: endopodal segment 2 length ratio 2.06.
E: Male P5 of C. glacialis (prosome length 3.71 mm; exopodal segment 1:endopodal segment 2 length ratio 2.07.
All drawings are anterior views; complete armature and total length of all setae not shown.
Scales are 0.2 mm.
|
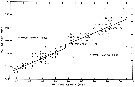
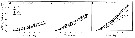
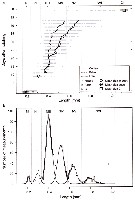
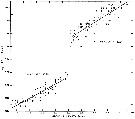 issued from : B.W. Frost in J. Fish. Res.Bd. Canada, 1971, 28. [p.25, Fig.2]. Morphometric analysis of adult males fitting the descriptions of and calanus glacialis from samples scattered throughout the North Atlantic and Arctic Oceans (see Fig.1 for the measurements)
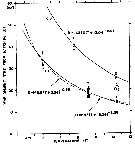
Length of exopodal segment 1 (Re1) of the male P5 plotted against prosome length (solid dots: C. finmarchicus; open circles: C. glacialis).
Equations of least-squares regression lines and correlation coefficients (parentheses).
The prosome was measured in lateral view from the anterior margin of the head to the posterior margin of the last thoracic segment.
|
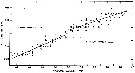
 issued from : B.W. Frost in J. Fish. Res.Bd. Canada, 1971, 28. [p.26, Fig.3]. Morphometric analysis of adult males fitting the descriptions of and calanus glacialis from samples scattered throughout the North Atlantic and Arctic Oceans (see Fig.1 for the measurements).
Length of exopodal segment 2 (Re2) of the male left P5 plotted against prosome length (solid dots: C. finmarchicus; open circles: C. glacialis).
Equations of least-squares regression lines and correlation coefficients (parentheses).
The prosome was measured in lateral view from the anterior margin of the head to the posterior margin of the last thoracic segment.
|
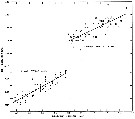
 issued from : B.W. Frost in J. Fish. Res.Bd. Canada, 1971, 28. [p.27, Fig.4]. Morphometric analysis of adult males fitting the descriptions of and calanus glacialis from samples scattered throughout the North Atlantic and Arctic Oceans (see Fig.1 for the measurements).
Length of exopodal segment 3 (Re3) of the male left P5 plotted against prosome length (solid dots: C. finmarchicus; open circles: C. glacialis).
Equations of least-squares regression lines and correlation coefficients (parentheses).
The prosome was measured in lateral view from the anterior margin of the head to the posterior margin of the last thoracic segment.
|
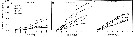
 issued from : B.W. Frost in J. Fish. Res.Bd. Canada, 1971, 28. [p.27, Fig.5]. Morphometric analysis of adult males fitting the descriptions of and calanus glacialis from samples scattered throughout the North Atlantic and Arctic Oceans (see Fig.1 for the measurements).
Length of endopodal segment 2 (Ri2) of the male left P5 plotted against prosome length (solid dots: C. finmarchicus; open circles: C. glacialis).
Equations of least-squares regression lines and correlation coefficients (parentheses).
The prosome was measured in lateral view from the anterior margin of the head to the posterior margin of the last thoracic segment.
|
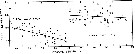 issued from : B.W. Frost in J. Fish. Res.Bd. Canada, 1971, 28. [p.28, Fig.6]. Morphometric analysis of adult males fitting the descriptions of and calanus glacialis from samples scattered throughout the North Atlantic and Arctic Oceans (see Fig.1 for the measurements).
Exopodal segment 1:endopodal segment 2 (Re1:Ri2) length ratio of the male left P5 plotted against prosome length (solid dots: C. finmarchicus; open circles: C. glacialis).
Equations of least-squares regression lines and correlation coefficients (parentheses).
The prosome was measured in lateral view from the anterior margin of the head to the posterior margin of the last thoracic segment.
|
 issued from : N.V. Vyshkvartzeva in Issed. Fauny Moreï, 1972, 12 (20). [p.164, Fig.3]. Femele: Md (mastcatory edge with codification of the teeth).
|
 issued from : N.V. Vyshkvartzeva in Issled. Fauny Moreï, 1972, 12 (20). [p.166, Fig.5, 2a, 2b]. Femele Md (masticatory edge): 1a, lateral view; 2b, another view (disstema).
|
 issued from : M. Chihara & M. Murano in An Illustrated Guide to Marine Plankton in Japan, 1997 [p.745, Pl. 66]. After Frost, 1974 Female: a-b, forehead with ocular (lateral and ventral, respectively). 1 : photoreceptors.
|
 issued from : S.B. Schnack in Crustacean Issue, 1989, 6. [p.144, Fig.7: 2]. 2, Calanus glacialis (from Arctic): Cutting edge of Md.
|
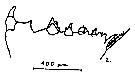
 issued from : K.A. Brodsky in Zool. Zh., 1959, 38, 10. [p.1541, Fig.3]. Comparison of coxopodite inner edge of P5 female for Calanus glacialis (1), Calanus finmarchicus (2) and Calanus helgolandicus (3). Nota: Calanus glacialis : Dentate plate on coxopodite has very short, blunt teeth and is sligh curved in central position. Teeth are close together, without spaces, numbering 30-34. Calanus finmarchicus : Dentate plate on coxopodite has short, blunt teeth, with small spacings. Teeth-line not curved. Number of teeth 29-30. Calanus helgolandicus : Dentate plate on coxopodite very characteristic; teeth have more or less parallel edges, are relatively small, strongly marked curve in middle of line; distal part of plate has closely set, elongated teeth; spaces between teeth only in central part of line, teeth here are rounded, not flat. Number of teeth 28 (according to Jaschnov most specimens from the North Sea had 28-33 teeth).
|
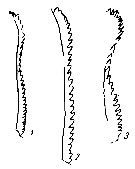
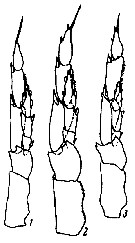 issued from : K.A. Brodsky in Zool. Zh., 1959, 38, 10. [p.1542, Fig.4]. Comparison of left leg of P5 male for Calanus glacialis (1), Calanus finmarchicus (2) and Calanus helgolandicus (3). Nota: Calanus glacialis : In segments of exopodite of left leg, the relation of width of 1st and 2nd segments to length of corresponding segments is 1 : 3. Left endopodite reaches almost half the length of the 2nd segment of the exopodite of the same leg. Calanus finmarchicus : Relation of width to length of 1st and 2nd segments of exopodite of left leg is 1 : 2.5. Left endopodite extends beyond middle of 2nd segment of exopodite. Calanus helgolandicus : Relation od width to length of 1st and 2nd segments of exopodite of left leg is 1 : 2.5. left endopodite reaches distal limit of first third of 2nd segment of exopodite of same leg.
|
 Issued from : B.J. Hansen, K. Degnes, I.B. Øverjordet, D. Altin & T.R. Størseth in Polar Biol., 2013, 36. [p.1578, Fig.1, B]. Calanus glacialis Stage V from Kongsfjorden, Svalbard (79°N, 12°E)
|
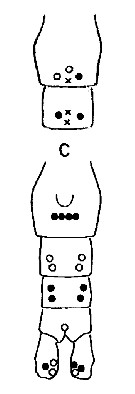 Issued from : A. Fleminger & K. Hulsemann in Mar. Biol., 1977, 40. [p.243, Fig.6 c]. Pore signature patterns of female urosome (ventral view shown below, dorsal view of genital segment and segment 2 (above). Specimens (n = 50) from North Atlantic localities. Data include sample of 30 specimens from Arctic Ocean north of Alaska (Ice Flow, Beaufort Sea Filled circles: integumental pore present in all specimens examined; open circles: pore present in from 90 to 99% of specimens examined; crosses: pore present in from 50 to 79% of specimens examined. Symbols used to indicate pores are not proportionate to actual pore size (latter range from 1 to 3 µm in diameter). Nota: The distribution of integumental organs on the urosome of adult females was determined in specimens selected at random from samples representing a variety of localities within the North Atlantic distribution. Compare with Calanus helgolandicus and C. finmarchicus.
|
 Issued from : K. Brodsky in Inform. Ser. 33. New Zealand Depart. Sc. Indust. Res., 1961. [p.13, Pl. 4, fig. 1]. Male (from Arctic Basin): 1, left P5. Nota: left endopod reaches almost 1/2 the length of the 2nd exopodal segment of the leg.. The proportion of breadth to length of the 1st and 2nd exiopodal segments of the left leg is 1 : 3.
|
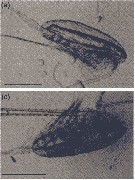 Issued from : M. Daase, Ø. Varpe & S. Falk-Petersen in J. Plankton Res., 2013, 36 (1). [p.135, Fig.1 a, c].
a: Alive CIV of Calanus glacialis with complete lipid sac (dorsal above the gut); c: carcass of CIV with intact carapace but broken lipid sac
Scale bar = 1 mm.
|
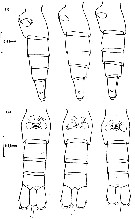
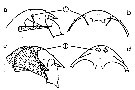
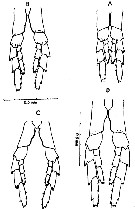 Issued from : D.C. Maclellan in Can. J. Zool., 1967, 45. [p.104, Fig.2]. Camera lucida drawings of P5 of adult females of Calanus, showing differences in the curve of the 1st basipodite inner edge, with cephalothorax length. (A) C. finmarrchicus s.str., 2.9 mm; (B) C. finmarchicus s.str., 3.4 mm. (C) C. glacialis from inner fjord (± 64°15' N, 52°40' W), 3.0 mm; (D) C. glacialis (Yaschnov), 3.7 mm.
|
 Issued from : D.C. Maclellan in Can. J. Zool., 1967, 45. [Pl. I]. Adult males of Calanus showing differences in curvature of P5, with cephalothorax lengths. (A) C. finmarchicus s.str., 2,9 mm. (B) C. glacialis from inner fjord (± 64°15' N, 52°40' W); (C) C. glacialis (Yaschnov), 3.7 mm.
| | | | | Ref. compl.: | | | Jaschnov, 1958 (p.838, fig.2); Grainger, 1961 (p.663, fig.); Grice, 1962 a (p.101, 102); 1963 a (p.495); Grainger, 1963 (p.66, Table I, II, fig.5, 6, 7, 9, chart, size); Mullin, 1963 (p.239, grazing rate); M.W. Johnson, 1963 (p.89, Table 1, 2); Brodsky, 1964 (p.105, 107); Grice & Hulsemann, 1965 (p.223); Harding, 1966 (p.17, 65, 66, 71); Pertsova, 1967 (p.240); Dunbar & Harding, 1968 (p.319); Conover & Corner, 1968 (p.49, 59, respiration & nitrogen excretion); Vinogradov, 1968 (1970) (p.53, 58, 94, 262, 266); Mullin, 1969 (p.308, Table I: estimates of production); Jaschnov, 1970 (p.199, geographic chart); Corkett, 1972 (p.171, eggs: development rate); Beaudouin J., 1973 (p.69); Landry, 1975 a (p.434, Rem.: p.437, fig.3); Kolosova, 1975 (p.92, fig. 3, Table 1); 1978 (p.320); Kosobokova, 1980 (p.84, caloric value); Huntley, 1981 (p.831, ingestion rate vs. food concentration); Buchanan & Sekerak, 1982 (p.41, vertical distribution); van der Spoel & Heyman, 1983 (p.62, fig.78); McLaren & Marcogliese, 1983 (p.721, body size vs. nucleus counts); Hassel, 1983 (p. 1, fig.3, abundance, distribution); Huntley & al., 1983 (p.143, Table 2, 3); Herman A.W., 1983 (p.709, vertical abundance vs. Chl.a); Tremblay & Anderson, 1984 (p.4, Rem.); Sameoto, 1984 (p.213, Table 1, fig.3, 6, 8); Arashkevich & Drits, 1984 (p.247, feeding, fecal pellet length); 1984 a (p.513, ingestion rate vs food particle size); Peruyeva, 1984 (p.253, Table 1, feeding); Bamstedt, 1984 (p.257, feeding); Smith & al., 1985 (p.693); Bamstedt & Tande, 1985 (p.259, respiration, excretion, Table 2: literature data); Tande & Bagmstedt, 1985 (p.251, gut contents excretion)); Head & al., 1985 (p.281, gut pigment analysis); Conover & al., 1986 (p.878, Table1, filtration rate); Corkett & al., 1986 (p.539, stage development times); Head & al., 1986 (p.271, grazing); Hirche, 1987 (p.347, activity, respiration vs temperature); Hirche & Bohrer, 1987 (p.11, egg production); Conover & al., 1988 (p.267, Table I, IV, grazing respiration, excretion); Runge & Ingram, 1988 (p.280, grazing); Head & al., 1988 (p.333, Table 1, 2, gut analysis, defecation rate); S.L. Smith, 1988 (p.145, feeding, respiration, ammonium, excretion, ice-edge effect); McLaren & al., 1988 (p.275, DNA content, development rate: egg-nauplius); Tande, 1988 a (p.457, respiration, excretion, gut evacuation v.s. temperature); Tande & Henderson, 1988 (p.333, lipid composition); Arashkevich & Kosobokova, 1988 (p.513, physiology & biochemistry); McLaren & al., 1989 (p.560, life history, annual production); Ikeda & Skjoldal, 1989 (p.173, oxygen consumption, N & P excretion, O:N vs. body weight); Hirche, 1989 (p.311, egg production); Estep & al., 1990 (p.235, grazing); S.L. Smith, 1990 (p.59, egg production, lipid, gut content); Hansen B. & al., 1990 (p.5, grazing); Conover & al., 1991 (p.177); Hirche, 1991 (p.351); Hirche & al., 1991 (p.477, Fig.3, 6, 7, 8, Table 2); Conover & Huntley, 1991 (p.1, fig. 2, 3, 5, Table 2, 3, 6, 8, 9, 10, 11, polar seas comparison); Hirche & Mumm, 1992 (p.S485, geographic distribution, egg production); Head, 1992 (p.583, gut pigment destruction); Herman, 1992 (p.395, fig.8 b, size distribution by OPC); Huntley & Lopez, 1992 (p.201, Table 1, A1, eggs, egg-adult weight, temperature-dependent production); Escribano & McLaren, 1992 (p.77, food-temperature-length-weigt); Conover & al., 1993 (p.303, Table 2, figs. 7 , 8, dry weight, %); Hirche & Kattner, 1993 (p.615, egg production, lipid content); Mumm, 1993 (tab.1, fig.2); Richter, 1994 (tab.4.1a); Pedersen & al., 1995 (p.266, tabl.II); Petryashov & al., 1995 (tab.1); Ashjian & al., 1995, p.4371, Fig.4, 5, 6, Table 2, 4); DFO, 1996 (p.1, fig.6, interannual abundance); Albers & al., 1996 (p.347, lipids v.s. diet); Hanssen, 1997 (tab.3.1); Daly, 1997 (p.319, Table 4, fecal pellets); Hirche & Kwasniewski, 1997 (p.299, Table 1, 2, 4, 5, Fig.4, 5, 6, 7, 8, 9, 10, 11, 12, 13); Ashjian & al., 1997 (p.279, Table 1, 2, Figs. 2, 3, 4 A,D); Niehoff, 1998 (p.53, gonad maturation); Melle & Skjoldal, 1998 (p.211, egg production, development); Weslawski & Legezynska, 1998 (p.1238); Sameoto & al., 1998 (p.1, 7, figs. 8, 9, spatial distribution, interannual variation); Hirche, 1998 (p.359, dormancy); Kosobokova & al., 1998 (tab.2); Mumm & al., 1998 (p.189, Figs.3, 4); Conover & Gustavson, 1999 (p.41, tab.6); B.W. Hansen & al., 1999 (p.233, seasonal abundance & biomass); Thibault & al., 1999 (p.1391); Kosobokova, 1999 (p.254, life history); Pinchuk & Paul, 2000 (p.4, table 1, % occurrence, biomass: figs.6, 7, 9, 10, 24, Index: p.53); Kosobokova & Hirche, 2000 (p.2029, tab.2); DFO, 2000 a (p.1, Rem.: p.8, fig., interannual variations); Musaeva & Suntsov, 2001 (p.511); Hill & al., 2001 (p.279, fig.2: phylogeny); Madsen & al., 2001 (p.75, development & production vs. annual); Fortier M. & al., 2001 (p.1263, fig.6, 7, diel vertical migration); Lischka & al., 2001 (p.186); Sameoto, 2001 (p.749, Table 4, Rem.: decadal changes); Johns & al., 2001 (p.2121, Rem: long-term series); Beaugrand & al., 2002 (p.1692); Beaugrand & al., 2002 (p.179, figs.5, 6); Auel & Hagen, 2002 (p.1013, tab. 2, 3); Wexels Riser & al., 2002 (p.175, fecal pellets); Pasternak & al., 2002 (p.147, fig.8, Table 4, feeding activity vs. egg production, faecal pellets); Ringuette & al., 2002 (p.5081, Table 1, 2, Fig.6, population dynamic); Arashkevich & al., 2002 (p.125, seasonal & regional variations); Pertsova & Kosobokova, 2002 (p.226, interannual vatiation); Sameoto & al., 2002 (p.12); Astthorsson & Gislason, 2003 (p.843); Kosobokova & al., 2003 (p.697, tab.2); Hirche & Kosobokova, 2003 (p.769, 3, 5, 6, 7, 8, Table 2, 3); Ashjian & al., 2003 (p.1235, figs.); Karnovsky & al., 2003 (p.289, Table 1, fig.5, 6, 9, Appendix 1, 2, auks relation/copepods); Gislason & Astthorsson, 2004 (p.472, tab.1); Lindeque & al., 2004 (p.121, fig.2); CPR, 2004 (p.50, fig.138); Beaugrand, 2004 (p.3, fig.4); Miller C.B., 2005 (p.218, 221, Rem.); Veistheim & al., 2005 (p.382, tab.2, fig.1); Dmoch & Walczowski, 2005 (p.102 + poster); Thor & al., 2005 (p.341); Hopcroft & al., 2005 (p.198, table 2); Plourde & al., 2005 (p.3411, egg production vs season and region); Arnkvaern & al., 2005 (p.528, dynamic); Frangoulis & al., 2005 (p.254, Table I: C/N/P fecal pellet composition); Blachowiak-Samolyk & al., 2006 (p.101, tab.1); Lindeque & al., 2006 (p.221); Hop & al., 2006 (p.182, Table 4, 5: inter-annual variability, fig.17); Tamelander & al., 2006 (p.231, isotopic composition); Willis & al., 2006 (p.39, Table 2, advection vs changes in community structure); Deibel & Daly; 2007 (p.271, Table 1, 2, 3, 5, Rem.: Arctic polynyas); Walkusz & al., 2007 (p.43); Daase & al., 2007 (p.903, abundance/T°S); Wold & al., 2007 (p.655, Rem/ Lipids composition); Falk-Petersen & al., 2007 (p.147, Table 9.1); Kattner & al., 2007 (p.1628, Table 1, Rem.: p.1634, seasonal pulsing phytoplankton vs dominance); Orlova & al., 2007 (p.145, climate effects); Ferrari & Dahms, 2007 (p.63, Rem.); Olli & al., 2007 (p.84, Rem.: ice drift); Blachowiak-Samolyk & al., 2007 (p.2716, Table 2); Hirche & Kosobokova, 2007 (p.2729, geographic distribution); Riser & al;, 2007 (p.719, faecal pellet, Table 2); Head & Sameoto, 2007 (p.2686, abundance vs interdecadal variability); Kattner & al., 2007 (p.1628, Rem.: p.1634, seasonal pulsing phytoplankton vs dominance); Lane & al., 2008 (p.97, Tab.4, 6, fig.8); Humphrey, 2008 (p.83: Appendix A); Jensen & al., 2008 (p.99, pyrene effect); Pasternak & al., 2008 (p.2245, Table 1, 2, 3, grazing); Darnis & al., 2008 (p.994, Table 1, figs.8, 9); Falk-Petersen & al., 2008 (p.2275, depth distribution); Walkusz & al., 2008 (p.1, Table 3, abundance); Søreide & al., 2008 (p.2225, feeding strategy); Tamelander & al., 2008 (p.2330, fig.3, Table 1, organic matter); Madsen & al., 2008 (p.177, egg production); Madsen & al., 2008 (p.63, development, production); Blachowiak-Samolyk & al., 2008 (p.2210, Table 2, 3, 5, fig.4, biomass, composition vs climatic regimes); Pepin & al., 2008 (p.1, 9, figs. 21, 26, 30, 31, 32, 34, interannual variations); Harvey & Devine, 2009 (Table 4 & others); Campbell & al., 2009 (p.1274, Table 2, 3, figs.3, 5, 6, 7, grazing); Dvoretsky & Dvoretsky, 2009 a (p.11, Table 2, abundance); Norrbin & al., 2009 (p.1945, Table 4, 5, abundance); Hopcroft & al., 2009 (p.9, Table 3); Kosobokova & Hirche, 2009 (p.265, Table 4, fig.9: chart, biomass); Sampei & al., 2009 (p.1894, in moored trap); Kosobokova & Hopcroft, 2010 (p.96, Table 1, fig.7); Homma & Yamaguchi, 2010 (p.965, Table 2); Head & Pepin, 2010 (p.1633, inter-decadal variability); Hopcroft & al., 2010 (p.27, Table 1, 2); Bucklin & al., 2010 (p.40, Table 1, Biol mol.); Templeton, 2010 (p.1, p.15: fig.12, interannual variations); Kwasniewski & al., 2010 (p.72, Table 2, abundance vs. hydrography); Hsiao & al., 2010 (p.179, Table III, trace metal concentration); Søreide & al., 2010 (p.3154, reproduction, growth vs. food, arctic changing); Tang & al., 2011 (p.77, composition & biomass); Leu & al., 2011 (p.18, figs. 6, 7, 8, 9, 10, 11, biomass, egg production, depth distribution, vs sea ice); Dünweber & al., 2010 (p.11, biomass, gut content); Dvoretsky & Dvoretsky, 2010 (p.991, Table 2); 2011 a (p.1231, Table 2: abundance, biomass); Daase & al., 2011 (p.111, food vs nauplius); Dvoretsky V.G., 2011 (p.361, abundance, stage composition); Kosobokova & al, 2011 (p.29, Table 2, figs.4, 6, Rem.: Arctic basins); Forest & al., 2011 (p.161, biomass, chemical composition); Hansen B.H. & al., 2011 (p.704, ecotoxicology); Pomerleau & al., 2011 (p.1779, Table III, IV, V, VI, VII); Homma & al., 2011 (p.29, Table 2, abundance, feeding pattern: suspension feeders); Swalethorp & al., 2011 (p.429, grazing, egg production and life strategies); Pepin & al., 2011 (p.273, Table 2, seasonal abundance); Matsuno & al., 2011 (p.1349, Table 1, fig.5, abundance vs years); Hirche & Kosobokova, 2011 (p.2359, Table 3, abundance, biomass %); Wold & al., 2011 (p.1929, vertical distribution, seasonal lipid composition); Hjorth & Nielsen, 2011 (p.1339, fecal pellets production, egg production); Tang K.W. & al., 2011 (p.666, Figs.1, 2, 3, gut O2 profiles by microelectrodes); Matsuno & al., 2012 (Table 1, 2, 3, fig.4, 7); Forest & al., 2012 (p.1301, figs.7, 8); Carstensen & al., 2012 (p.951, Fig.2, 9, biomass); DiBacco & al., 2012 (p.483, Table S1, ballast water transport); Tammilehto & al., 2012 (p.165, nutition, algal toxicity); Dalpadado & al., 2012 (p.1, abundance vs. climate change); Pasternak & al., 2012 (p.377, feeding rate: Stage V); Klok & al., 2012 (p.24, ecotoxicology); Trudnowska & al., 2012 (p.18, Table 1, abundance vs hydrography); Weydmann & al., 2012 (p.39, egg production vs pH); Freese & al., 2012 (p.66, enzyme activity vs temperature & pH); Kwasniewski & al., 2012 (p.890, interannual variability); Berge & al., 2012 (p.191, evolution vs predation pressure by extinct baleen whales); Alvarez-Fernandez & al., 2012 (p.21, Rem.: Table 1); Parrish & al., 2012 (p.356, nutrition, lipids vs protists); Kjellerup & al., 2012 (p.87, egg , fecal pellet production vs temperature & food); Ji & al., 2012 (p.40, Table 1, fig.2: development, life history, biogeography); Demontigny & al., 2012 (p.221, Table II, fig.5, abundance, prey by ichthyoplankton); Persson & al., 2012 (p.71, climate effects); Sampei & al., 2012 (p.90, Table 1, 2, abundance in sediment trap); Gusmao & al., 2013 (p.279, fig.1, sex ratio vs predators, fig.4: seasonal variation of sex ratio); Hansen B.H. & al., 2013 (p.1577, metabolism); Hsiao & Fang, 2013 (p.175, Table 2: Hg bioaccumulation); Pasternak & al., 2013 (p.547, egg production); Questel & al., 2013 (p.23, Table 3, interannual abundance & biomass, 2008-2010); Peijnenburg & Goetze, 2013 (p.2765, genetic data); Pepin, 2013 (p.119, fig.3, abundance vs transect); Hansen B.W. & al., 2013 (p.276, toxicity effect, gene expression); Usov & al., 2013 (p.1, interannual abundance vs temperature 1961-2010); Kwasniewski & al., 2013 (p.83, Table 2, 3, abundance); Grenvald & al., 2013 (p.184, hatching success vs. pyrene toxicity); Dvoretsky & Dvoretsky, 2013 a (p.205, Table 2, % abundance); Arendt & al., 2013 (p.105, fig.3, abundance); Zamora Terol, 2013 (p.97: fig.3, abundance, biomass); Daase & al., 2013 (p.871, vertical distribution, biomass, life history); Barton & al., 2013 (p.522, Table 1: metabolism, diapause, population dynamic, feeding mode, biogeo); Daase & al., 2014 (p.129, fig.1, 2, mortality, carcasses, Table III, IV: abundance vs depth); Coyle & al., 2014 (p.97, table 3, 10, 12); Nielsen & al., 2014 (p.1299, discrimination with C. finmarchicus); Batnes & al., 2015 (p.51, Rem.); Ershova & al., 2015 (p.100, % long-term changes 1946-2012, climate change); Schmid & al., 2016 (p. 129, fig.3, 4, Table 4, identification vs imaging system); Smoot & Hopcroft, 2016 (p.1, Rem.: p.7); Miesner & al., 2016 (p.564, grazing, fecundity vs feeding on domoic acid from diatom); Albouy-Boyer & al., 2016 (p.589, Table I, fig.2, life cycle model vs. environmental factors); Aarflot & al., 2017 (p.2342, biomass); Eriksen & al., 2017 (p.206, recent warming water, Barents Sea); Baumgartner & Tarrant, 2017 (p.387, Table 1, diapause); Record & al., 2018 (p.2238, Table 1: diapause); Varpe & Ejsmond, 2018 (p.623, diapause model); Møller & Nielsen, 2019 (p.1, biomass vs. sea ice cover changing); Hirai & al., 2020 (p.1, Fig. 5: cluster analysis (OTU), spatial distribution). | | | | NZ: | 5 | | |
|
Carte de distribution de Calanus glacialis par zones géographiques
|
| | | 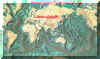 Chart from 1996 Chart from 1996 | |
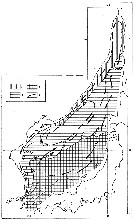
 issued from : R. Williams in Bull. mar. Ecol., 1972, 8. [p.55, Fig.1]. issued from : R. Williams in Bull. mar. Ecol., 1972, 8. [p.55, Fig.1].
Ditribution of stages V and VI in the North Atlantic from the Continuous Plankton Recorder.
The chart show the average abundance and distrubution derived from more than 43.000 samples taken a depth of 10 m during 1958 to 1968. The samples were assigned to rectangles of 1° lat. by 2° long. The boundary of the sampled area (defined as those rectangles sampled in more than 5 months) is shown by the straight lines in the chart; within this area the average abundance in each rectangle is shown by circular symbols; the presence of the species in the occasional samples outside this area is indicated by plus signs. The absence (in the sampled area) indicates that the species was not found in CPR.
large and small filled in circles and open circles, respectively, are used to indicate the following categories of abundance (average numbers per sample of 3.3 m3: >0.08 : 0.08-0.03 : <0.03 |
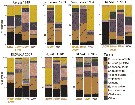
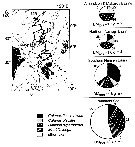 issued from : N. Mumm, H. Auel, H. Hanssen, W. Hagen, C. Richter & H.-J. Hirche in Polar Biol., 1998, 20. [p.192, Fig.1, p.194, Fig.3] issued from : N. Mumm, H. Auel, H. Hanssen, W. Hagen, C. Richter & H.-J. Hirche in Polar Biol., 1998, 20. [p.192, Fig.1, p.194, Fig.3]
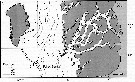
Fig.1 after Diepenbroek & al., 1997; Station map, the dark line connects stations of different expeditions to a transpolar transect (AB: Amundsen Basin, BS: Barents Sea; GL: Greenland; GS: Greenland Sea; LR: Lomonov Ridge; MB: Makarov Basin; MJP: Morris Jessup Plateau; NB: Nansen Basin; NG: Nansen-Gakkel Ridge; SB: Spitsbergen; WSC: West Spitsbergen Current; YP: Yermak Plateau
Fig.3: Biomass share (% of total mesozooplankton dry mass) of Calanus finmarchicus, C. glacialis, C. hyperboreus, Metridia longa and other taxa in 0- to 500 m depth of different Arctic regions (DM total: mean total dry mass).
Note the co-occuring of the three species, but the the different abundance according to the basins.
C. finmarchicus reached a maximum abundance in the WSC, this form was the dominant species in the West Spitsbergen Current and south of the central Nansen Basin.
Note C. glacialis is more important towards the north than the south. |
 issued from : M.C. Kun Zool. Zh., 1969, 48 (7). [p.1000, Fig.3]. issued from : M.C. Kun Zool. Zh., 1969, 48 (7). [p.1000, Fig.3].
Distribution of Calanus glacialis (1), pacificus (2) and sinicus (3) (as Calanus finmarchicus glacialis, pacificus and sinicus in the Japan Sea.
Most cold-water form indicator of the Primorsky Current (C. glacialis. C. pacificus form of the zone where warm and cold weters mix up. C. sinicus form of the Yellow Sea which is carried , primarly, into the East China Sea and, then, into the Sea of Japan and, thus can serve as an indicator of the Yellow Sea waters. |
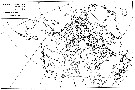
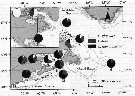
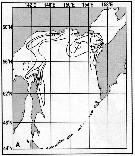
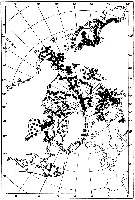 issued from : W.A. Jaschnov in Int. Revue ges. Hydrobiol., 1970, 55 (2). [p.200, Fig.1] issued from : W.A. Jaschnov in Int. Revue ges. Hydrobiol., 1970, 55 (2). [p.200, Fig.1]
Distribution of Calanus glacialis from literary sources (as C. finmarchicus) and unpublished data.
Solid lines indicate the position of the convergence zones. Arrows denote some of the currents. Dark circles indicate occurrence in reproduction areas, semi-dark circles in immigrated areas and white circles in expatriation areas (usual single findings). |
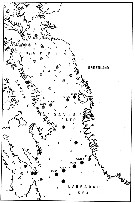
 issued from : E.H. Grainger in J. Fish. Bd. Canada, 1961, 18 (5). [p.673, Fig.6]. issued from : E.H. Grainger in J. Fish. Bd. Canada, 1961, 18 (5). [p.673, Fig.6].
Distribution of Calanus glacialis and C. finmarchicus in northern North America.
Circles indicate collection first reported by the author, squares collections described by others (mostly Jespersen, 1934). Arrows denote principal water movements. |
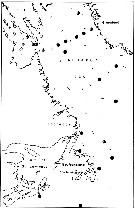
 issued from : E.H. Grainger in R. Soc. Canada, Spec. Publs., 1963, 5. [p.77, Fig.5]. issued from : E.H. Grainger in R. Soc. Canada, Spec. Publs., 1963, 5. [p.77, Fig.5].
Baffin Bay and Davis Strait. White circles show stations where C. glacialis occurred without C. finmarchicus, stipped and black circles relative occurrence of all copepodites stages of C. glacialis (stipped) and C. finmarchicus (black) at stations where both species occurred.
Numbers of a few stations are shown. |
 issued from : E.H. Grainger in R. Soc. Canada, Spec. Publs., 1963, 5. [p.78, Fig.6]. issued from : E.H. Grainger in R. Soc. Canada, Spec. Publs., 1963, 5. [p.78, Fig.6].
Hudson Bay and Hudson Strait. White circles show stations where C. glacialis occurred without C. finmarchicus, stipped and black circles relative occurrence of all copepodites stages of C. glacialis (stipped) and C. finmarchicus (black) at stations where both species occurred.
Numbers of a few stations are shown. |
 issued from : E.H. Grainger in R. Soc. Canada, Spec. Publs., 1963, 5. [p.79, Fig.7]. issued from : E.H. Grainger in R. Soc. Canada, Spec. Publs., 1963, 5. [p.79, Fig.7].
Labrador and southeast Canadian waters. White circles show stations where C. glacialis occurred without C. finmarchicus, stipped and black circles relative occurrence of all copepodites stages of C. glacialis (stipped) and C. finmarchicus (black) at stations where both species occurred. |
 issued from : I.A. McLaren, M.J. Tremblay, C.J. Corkett & J.C. Roff in Can. J. Fish. Aquat. Sci., 1989, 46. [p.578, Fig.16]. issued from : I.A. McLaren, M.J. Tremblay, C.J. Corkett & J.C. Roff in Can. J. Fish. Aquat. Sci., 1989, 46. [p.578, Fig.16].
Relative abundances of stages of Calanus glacialis in samples from Browns Bank (42°35'N, 65°50'W), the samples were obtained by vertical hauls from near bottom (usually 70-80 m) by Hensen-type nets (one of 0.202 mm mesh and the other of 0.064 mm mesh). and Emerald Bank (43°30'N, 63°00'W), the samples were obtained by vertical hauls from near bottom (usually 25 m) by Hensen-type nets (one of 0.250 mm mesh and the other of 0.064 mm mesh)..
Bars are No.-100/m3 for Emerald and No./haul for Browns Bank. |
 Issued from : J.E. Søreide, S. Falk-Petersen, E.N. Hegseth, H. Hop, M.L. Carroll, K.A. Hobson & K. Blachowiak-Samolyk in Deep-Sea Res., II, 2008, 55. [p.2228, Fig.1]. Issued from : J.E. Søreide, S. Falk-Petersen, E.N. Hegseth, H. Hop, M.L. Carroll, K.A. Hobson & K. Blachowiak-Samolyk in Deep-Sea Res., II, 2008, 55. [p.2228, Fig.1].
Study sites in the Svalbard region. The biomass (dry-weight b/m2) of the population of Calanus hyperboreus, C. glacialis and C. finmarchicus (CI-adult) is shown for the main sampling locations (data from Stn. NK2 is missing) and the Atlantic and Arctic water masses are indicated by arrows (WCS: west Spitsbergen Current). The location of the ice edge (defined as 30% ice concentrations) is indicated for selected dates.
Nota: Stable isotope and fatty acid trophic marker techniques were employed together to assess trophic level, carbon sources (phytoplankton vs. ice algae), and diet of the three Calanus species.
Patterns in absolute fatty acid and fatty alcohol composition revealed that diatoms were the most important food for C. hyperboreus and C. glacialis, followed by Phaeocystis, whereas diatoms, Phaeocystis and other small autotrophic flagellates were equally important for C. finmarchicus. During periods of lower algal biomass, only C. glacialis exhibited evidence of significant dietary switch, with a trophic level indicative of omnivory. |
 Issued from : S. Falk-Petersen & al. in Deep-Sea Res., 2008, 55. [p.2282, Table 5]. Issued from : S. Falk-Petersen & al. in Deep-Sea Res., 2008, 55. [p.2282, Table 5].
Arctic Ocean, Ice Stations 1 (82°N, 11°E) on 2 September 2004, and 2 (82°30'N, 21°E) on 4 September 2004: Depth distribution of mesozooplankton in the upper 1200 m. |
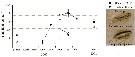
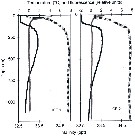 Issued from : S. Falk-Petersen & al. in Deep-Sea Res., 2008, 55. [p.2281, Fig.8]. Issued from : S. Falk-Petersen & al. in Deep-Sea Res., 2008, 55. [p.2281, Fig.8].
Arctic Ocean, Ice Stations 1 (82°N, 11°E) on 2 September 2004, and 2 (82°30'N, 21°E) on 4 September 2004: Temperature (black profile), relative fluorescence values (red line), salinity (dotted line). |
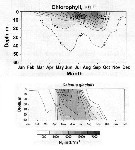
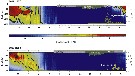
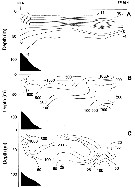
 Issued from : K.W. Tang, T.G. Nielsen, P. Munk, J. Mortensen, E.F. Møller, K.E. Arendt, K. Tönnesson, T. Juul-Pedersen in Mar. Ecol. Prog. Ser., 2011, 434. [p.83, Fig.4] Issued from : K.W. Tang, T.G. Nielsen, P. Munk, J. Mortensen, E.F. Møller, K.E. Arendt, K. Tönnesson, T. Juul-Pedersen in Mar. Ecol. Prog. Ser., 2011, 434. [p.83, Fig.4]
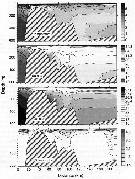
Calanus glacialis (from the continental slope off Fyllas Bank to the inner part of Godthabsfjord, SW Greenland, corresponding to stations 0 to 20) in the summer (2008).
Contour plots of biomass (mg C/m3) of all developmental stages collected from 4 to 9 strata with a multinet samples (300 µm mesh aperture)
Dots are mid-points of sampling intervals. Numbers on top are stations. Hatched area = bottom topography.
Compare this distribution with the other dominant large zooplankton species Calanus finmarchicus, Calanus hyperboreus and Metridia longa for the same transect. |
 Issued from : K.W. Tang, T.G. Nielsen, P. Munk, J. Mortensen, E.F. Møller, K.E. Arendt, K. Tönnesson, T. Juul-Pedersen in Mar. Ecol. Prog. Ser., 2011, 434. [p.79, Fig.1] Issued from : K.W. Tang, T.G. Nielsen, P. Munk, J. Mortensen, E.F. Møller, K.E. Arendt, K. Tönnesson, T. Juul-Pedersen in Mar. Ecol. Prog. Ser., 2011, 434. [p.79, Fig.1]
Station positions along Godthabsfjord in southwestern Greenland. |
 Issued from : K.W. Tang, T.G. Nielsen, P. Munk, J. Mortensen, E.F. Møller, K.E. Arendt, K. Tönnesson, T. Juul-Pedersen in Mar. Ecol. Prog. Ser., 2011, 434. [p.81, Fig.2] Issued from : K.W. Tang, T.G. Nielsen, P. Munk, J. Mortensen, E.F. Møller, K.E. Arendt, K. Tönnesson, T. Juul-Pedersen in Mar. Ecol. Prog. Ser., 2011, 434. [p.81, Fig.2]
Contour plots of water temperature (°C), salinity, density (kg/m3) and chlorophyll a (mg/m3) along the transect of Godthabsfjord.
Distances were measured from Station o. Note the different contour line scales for different panels.
Hatched area in each panel represents bottom topography. |
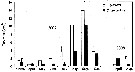
 Issued from : DFO in DRO Sci. Stock Status Rep. G3-02 (2000). [p.8]. Issued from : DFO in DRO Sci. Stock Status Rep. G3-02 (2000). [p.8].
Abundance of C. glacialis in Emerald Basin (Nova Scotia) during the years 1982 to 1998.
Nota: Compare with Calanus hyperboreus and Calanus finmarchicus.
See in Sameoto & al., 1997. |
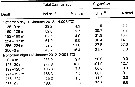
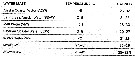
 Issued from : A. Fleminger & K. Hulsemann in Mar. Biol., 1977, 40. [p.245, Table 4]. Issued from : A. Fleminger & K. Hulsemann in Mar. Biol., 1977, 40. [p.245, Table 4].
Length of prosome (mm) and number of teeth on coxopodite of P5 in adult females selected at random from samples used to determine urosome pore signature. |
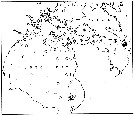
 Issued from : A. Fleminger & K. Hulsemann in Mar. Biol., 1977, 40. [p.241, Fig.5 c]. Issued from : A. Fleminger & K. Hulsemann in Mar. Biol., 1977, 40. [p.241, Fig.5 c].
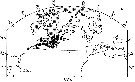
Distribution of Calanus glacialis sensu stricto in North Atlantic and adjacent seas based on published litterature (squares: Edinburg Oceanographic Laboratory, 1973; open triangles: Jaschnov, 1970; present records: circles). Stippled areas approximate inhabited region beyond or at perimeter of North Atlantic Ocean.
Nota: In view of their present geographical distributions, large-scale seasonally recurrent sympatry of C. helgolandicus and C. glacialis occurrs only in the western North Atlantic where hydrographic circulations annually bring Labrador water, indigenous boreal water and warm temperature water into confluence |
 Issued from : A.W. Herman in Limnol. Oceanogr., 1983, 28 (4). [p.710, Fig.1]. Issued from : A.W. Herman in Limnol. Oceanogr., 1983, 28 (4). [p.710, Fig.1].
(a) Volume distribution of copepods from a batfish sample as measured by microscope. Dominant copepods identified in the northeastern Baffin Bay: 3 Calanus finmarchicus (stage V), 4 Calanus glacialis (stage V), 5 Calanus hyperboreus (stage V); 6 Calanus hyperboreus (stage VI). Low abundances were found among 1 Pseudocalanus minutus and 2 C. hyperboreus (stage III).
(b) Volume distribution from the same sample as in panel a, measured by the electronic zooplankton counter.
Nota: The study area extends from 75° to 76°N and 68° to 72°W, from 30 July to 2 August 1980 |
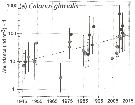
 Issued from : N. Usov, I. Kutcheva, I. Primakov & D. Martynova in Hydrobiologia, 2013, 706. [p.18, Fig.3]. Issued from : N. Usov, I. Kutcheva, I. Primakov & D. Martynova in Hydrobiologia, 2013, 706. [p.18, Fig.3].
Long-term dynamics of monthly temperature, salinity and Calanus glacialis abundance in the layer of 0-10 m in Chupa Inlet (Kandalaksha Bay, White Sea) from 1961 to 2010. Sampling from water layers (0-10, 10-25, and 25-45 m) using a standard Juday net (mesh size 200 µm). |
 Issued from : N. Usov, I. Kutcheva, I. Primakov & D. Martynova in Hydrobiologia, 2013, 706. [p.17, Fig.2 & p.23, Fig.7]. Issued from : N. Usov, I. Kutcheva, I. Primakov & D. Martynova in Hydrobiologia, 2013, 706. [p.17, Fig.2 & p.23, Fig.7].
Long-term average of Chl a and seasonal dynamics of Calanus glacialis in Chupa Inlet (White Sea). |
 Issued from : E. Leu, J.E. Søreide, D.O. Hessen, S. Falk-Petersen & J. Berge in Progress in Oceanography, 2011, 90. [p.24, Fig. 6]. Issued from : E. Leu, J.E. Søreide, D.O. Hessen, S. Falk-Petersen & J. Berge in Progress in Oceanography, 2011, 90. [p.24, Fig. 6].
Calanus glacialis and Calanus finmarchicus Biomass (dry matter g per m2) in Rijpfjorden (80°15'N, 22°E) in 2007 and 2008.This study was performed in 2007 and in 2008 in Rijpfjorden (Svalbard) for the project CLEOPATRA (Climate effects on planktonic food quality and trophic transfer in Arctic marginal ice zone).
Nota: The relatively shallow fjord (max. 250 m deep) opens towards the Arctic Ocean. It is characterized by cold Arctic water masses and is covered by sea ice up to 9 months a year.
The zooplankton community is dominated by C. glacialis, making up >90% of the zooplankton biomass.
Zooplanktion was sampled vertically with WP2 closing nets. |
 Issued from : E. Leu, J.E. Søreide, D.O. Hessen, S. Falk-Petersen & J. Berge in Progress in Oceanography, 2011, 90. [p.29, Fig. 12]. Issued from : E. Leu, J.E. Søreide, D.O. Hessen, S. Falk-Petersen & J. Berge in Progress in Oceanography, 2011, 90. [p.29, Fig. 12].
Calanus glacialis and Calanus finmarchicus abundance (a) and biomass (b) in Rijpfjorden in August/September 2003-2008 (nd = no data).
Samples were collected vertically with a multiple plankton sampler MPS consisting of five closing nets (mesh size 180-200 µm in 2003, and sampled with a WP2 net opening (mesh size similar). Samples were collected close to the mooring; bottom sampling depths ranged from 195 to 245 m. The abundance and biomass data were integrated from 5 m above the sea floor to the surface.
C. finmarchicus overwinters as CV and mainly has a 1-year life cycle north of the polar front. Highter sea-water temperature and longer ice-free periods are assumed to favor the boreal C. finmarchicus over the larger and more energy-rich Arctic C. glacialis. These species start their gonad development during winter, using reserves accumulated during the previous year. To successfully complete reproduction, however, C. glacialis and C. finmarchicus rely to different extents on the access to fresh food. The boreal C. finmarchicus is completely dependent on pelagic algae, whereas C. glacialis is able to actively feed upon the ice algal bloom and use this high quality food source to fuel gonad maturation and egg production. They can even spawn using exclusively their lipid reserves, but gonad maturation and egg production increase dramatically when fresh algal food is available.
The accelerating decrease of Arctic sea ice extent and thickness over the last decade (Stroeve & al., 2007; Camiso & al., 2008) has far-reaching consequences for the underwater light climate and thus the timing, quantity, and quality of primary production (Arrigo & al., 2008). As algae are intimately linked to the ice cover, them to be flexible and respond fast to a new climatic regime, but this flexibility may be less manifested in consumers and higher trophic levels with complex life history adaptations. Thinner ice and earlier ice breakup may thus lead to a temporal mismatch between the timing of the bloom and the zooplankton production. (Melle & Skjoldal, 1998; hansen & al., 2003). Less ice will also cause a shift in primary production from ice algae to phytoplankton (Hegseth, 1998), with a shorter temporal difference between the ice algal and phytoplankton blooms (Søreide & al., 2010). It is therefore unclear whether an elevated primary production really yields a corresponding increase in secondary production. |
 Issued from : E. Leu, J.E. Søreide, D.O. Hessen, S. Falk-Petersen & J. Berge in Progress in Oceanography, 2011, 90. [p.25, Fig. 7]. Issued from : E. Leu, J.E. Søreide, D.O. Hessen, S. Falk-Petersen & J. Berge in Progress in Oceanography, 2011, 90. [p.25, Fig. 7].
Calanus glacialis egg, nauplii, and copepodite abundances in Rijpfjorden from March to October (nd = not determined). |
 Issued from : E. Leu, J.E. Søreide, D.O. Hessen, S. Falk-Petersen & J. Berge in Progress in Oceanography, 2011, 90. [p.22, Table 3]. Issued from : E. Leu, J.E. Søreide, D.O. Hessen, S. Falk-Petersen & J. Berge in Progress in Oceanography, 2011, 90. [p.22, Table 3].
Measurement of Calanus glacialis egg production in Rijpfjorden in 2007 and 2008.Egg production rates were estimated from 24-h incubations in 2007, which in 2008 were improved to 3-4 day incubations (see in Smith, 1990) at close to in situ temperatures. |
 Issued from : E. Leu, J.E. Søreide, D.O. Hessen, S. Falk-Petersen & J. Berge in Progress in Oceanography, 2011, 90. [p.26, Fig. 8]. Issued from : E. Leu, J.E. Søreide, D.O. Hessen, S. Falk-Petersen & J. Berge in Progress in Oceanography, 2011, 90. [p.26, Fig. 8].
Calanus glacialis copepodite stage composition in Rijpfjorden from March to October 2007 and August 2008.
C = copepodite stage; CAM = adult male; CAF = adult female. |
 Issued from : E. Leu, J.E. Søreide, D.O. Hessen, S. Falk-Petersen & J. Berge in Progress in Oceanography, 2011, 90. [p.27, Fig. 10]. Issued from : E. Leu, J.E. Søreide, D.O. Hessen, S. Falk-Petersen & J. Berge in Progress in Oceanography, 2011, 90. [p.27, Fig. 10].
Total lipid content of Calanus glacialis CV in Rijpfjorden in 2007 and 2008. |
 Issued from : E. Leu, J.E. Søreide, D.O. Hessen, S. Falk-Petersen & J. Berge in Progress in Oceanography, 2011, 90. [p.23, Fig. 3]. Issued from : E. Leu, J.E. Søreide, D.O. Hessen, S. Falk-Petersen & J. Berge in Progress in Oceanography, 2011, 90. [p.23, Fig. 3].
Temperature and fluorescence profiles measured from September 2006 to September 2007 and September 2007 to August 2008 in Rijpfjorden by a mooring equipped with temperature loggers spaced through the water column.
Phytoplankton chlorophyll a (Chl a) was measured by a fluorometer placed at 17-m depth at the mooring, with measured values indicated on the right y-axis. The duration and timing of ice cover and the ice algal and phytoplankton blooms are indicated in the plots. |
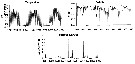
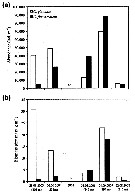
 Issued from : M. Hjorth & T.G. Nielsen in Mar. Biol., 2011, 158. [p.1342, Fig. 2, d-f]. Issued from : M. Hjorth & T.G. Nielsen in Mar. Biol., 2011, 158. [p.1342, Fig. 2, d-f].
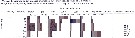
Cumulated specific faecal pellet production (SPP) in C. glacialis during exposure to six concentrations of pyrene at three temperatures (from left to right: 0.5 , 5 and 8°C).Asterisks denote a significant different (P <0.05) development from control.
Sampling of copepods conducted from 23 to 25 April 2008 in Disko Bay (69°15'N, 53°33'W) |
 Issued from : M. Hjorth & T.G. Nielsen in Mar. Biol., 2011, 158. [p.1343, Fig. 3, d-f]. Issued from : M. Hjorth & T.G. Nielsen in Mar. Biol., 2011, 158. [p.1343, Fig. 3, d-f].
Cumulated specific egg production (SEP) in C. glacialis during exposure to six concentrations of pyrene at three temperatures (from left to right: 0.5 , 5 and 8°C).Asterisks denote a significant different (P <0.05) development from control.
Sampling of copepods conducted from 23 to 25 April 2008 in Disko Bay (69°15'N, 53°33'W) |
 Issued from : M. Hjorth & T.G. Nielsen in Mar. Biol., 2011, 158. [p.1344, Fig. 5]. Issued from : M. Hjorth & T.G. Nielsen in Mar. Biol., 2011, 158. [p.1344, Fig. 5].
Hatching data for each species at the three water temperature, pooled across pyrene treatments and exposure times..
Sampling of copepods conducted from 23 to 25 April 2008 in Disko Bay (69°15'N, 53°33'W). |
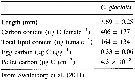 Issued from : M. Hjorth & T.G. Nielsen in Mar. Biol., 2011, 158. [p.1341, Table 1]. Issued from : M. Hjorth & T.G. Nielsen in Mar. Biol., 2011, 158. [p.1341, Table 1].
Size, carbon and lipid content of adult females of Calanus glacialis and carbon content of eggs and faecal pellets.
Sampling of copepods conducted from 23 to 25 April 2008 in Disko Bay (69°15'N, 53°33'W). |
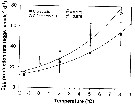 Issued from : H.-J. Hirche & K. Kosobokova in Deep-Sea Research II, 2007, p.2742, Fig.8]. Issued from : H.-J. Hirche & K. Kosobokova in Deep-Sea Research II, 2007, p.2742, Fig.8].
Egg production rates of Calanus glacialis and C. finmarchicus at different temperatures and optimum food concentrations. Vertical bars ± SD.
Specimens collected in the Norwegian Sea at 9°C in June 1989, , incubated at five temperatures after acclimatation at 0°C for 4-7 days. They laid eggs in regular intervals during ca. 2 weeks.
Egg production rate increased exponentially with temperature over the range between - 1.5 and 8°C.
Nota: Comparison of the congeners C. finmarchicus and C. glacialis shows that the latter is at present better adaptated to life in the Arctic, because it can better utilize the patchy and mostly late phytoplankton occurrence that is often assocuated with polynyas such as the Northwater polynya in Baffin Bay (see Ringuette & al., 2000), Northeast Water polynya East Greenland shelf (see Hirche & al., 1994; Ashjan & al., 1995, 1997; Hirche & Kwasniewski, 1997), and Laptev Sea polynya (see Kosobokova & Hirche, 2011). Females of C. glacialis are long-lived (see Kosobokova, 1999) and are able to spawn if fed after long starvation periods (see Hirche, 1989). The use of ice algae (see Runge & Ingram, 1988) further expands its growth period.
In both the White Sea and the Lurefjord, 5°C seems to be a strong threshold above which dormancy is induced in female C. glacialis. Under continuing warming and strenthening of the Atlantic inflow, a replacement of C. glacialis by C. finmarchicus may happen first only in the later part of the year, when surface temperatures are surpassing this limit. |
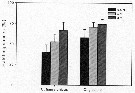
 Issued from : L. Stempniewicz, K. Blachowiak-Samolyk & J.M. Weslawski in Deep-Sea Research, 2007, 54. [p. 2941, Fig .3]. Issued from : L. Stempniewicz, K. Blachowiak-Samolyk & J.M. Weslawski in Deep-Sea Research, 2007, 54. [p. 2941, Fig .3].
Average % of Calanus glacialis and Calanus finmarchicus (stages CIV-VI + females) found in net tows (ind per m3) in water masses influenced by cold Sorkapp Current (Arctic water from South Spitsbergen), by warm West Spitsbergen Current (Atlantic water) and in the little Auk (little pinguin: plankton-eating seabirds) diet (diagram based on data from Karnovsky & al., 2003).
|
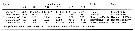 Issued from : M. Daase, J.E. Søreide & M. Martynova in Mar. Ecol. Peog. Ser., 2011, 429. [p.119, Table 6]. Issued from : M. Daase, J.E. Søreide & M. Martynova in Mar. Ecol. Peog. Ser., 2011, 429. [p.119, Table 6].
Length distribution (mm) of total length of nauplii of North Atlantic and Arctic Calanus spp. Comparison between C. glacialis, C. finmarchicus, C. hyperboreus.
nd: no data. |
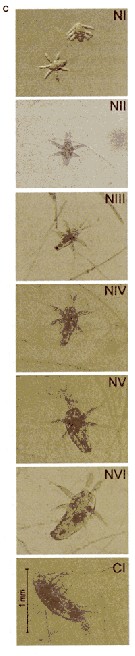 Issued from : M. Daase, J.E. Søreide & M. Martynova in Mar. Ecol. Peog. Ser., 2011, 429. [p.116, Fig.1 c]. Issued from : M. Daase, J.E. Søreide & M. Martynova in Mar. Ecol. Peog. Ser., 2011, 429. [p.116, Fig.1 c].
Digital photographs of naupliar stages N1 to NVI and copepodite stage CI of Calanus glacialis from Svalbard (78°N, 13° E) on 11 May 2008. with a WP3 (mesh size 1 mm). |
 Issued from : M. Daase, J.E. Søreide & M. Martynova in Mar. Ecol. Peog. Ser., 2011, 429. [p.116, Fig.1, a, b]. Issued from : M. Daase, J.E. Søreide & M. Martynova in Mar. Ecol. Peog. Ser., 2011, 429. [p.116, Fig.1, a, b].
Calanus glacialis from Svalbard. (a), sizes of eggs (diameter, grey asterisks), naupliar stages NI to NVI (total length, grey dots) and copepodit stage I (prosome length, grey squares). Lines show mean length of nauplii in the 3 experimental treatments measured at a specific day after hatching. Grey lines in the background indicate the length classes for each consecutive naupliar stages calculated from length-frequency analysis (MIX analysis) of the naupliar stages presented in (b). |
 Issued from : M. Daase, J.E. Søreide & M. Martynova in Mar. Ecol. Peog. Ser., 2011, 429. [p.117, Table 5]. Issued from : M. Daase, J.E. Søreide & M. Martynova in Mar. Ecol. Peog. Ser., 2011, 429. [p.117, Table 5].
Calanus glacialis. Size classes (mm) of successive naupliar stages for each treatment and for all measurements combined, based on analysis of length-frequency distribution derived from total length measurements taken from digital photographs. P-lim: phosphate mimited; PSW: filtered sea water; nd: no data. |
 Issued from : M. Daase, J.E. Søreide & M. Martynova in Mar. Ecol. Peog. Ser., 2011, 429. [p.115, Table 3]. Issued from : M. Daase, J.E. Søreide & M. Martynova in Mar. Ecol. Peog. Ser., 2011, 429. [p.115, Table 3].
Calanus glacialis. Median development time (MDT) in days of each successive naupliar stages reared under different food conditions.
For P-lim treatments, duration of stages NV and NVI was not available; for PSW, stages NIV, NV and NVI.
Proportion of development time spent in each naupliar stage until stage CI (copepodite) refers to the results from the control treatment.
nd: not determined. |
 Issued from : M. Daase, J.E. Søreide & M. Martynova in Mar. Ecol. Peog. Ser., 2011, 429. [p.118, Fig.3]. Issued from : M. Daase, J.E. Søreide & M. Martynova in Mar. Ecol. Peog. Ser., 2011, 429. [p.118, Fig.3].
Temperature-dependent developmental time of 3 northern species of Calanus from hatching to stage CI based on Belehradek's temperature functions fitted to data from Corkett & al. (1986); McLaren & al. (1988) and Campbell & al. (2001).
Development time from Campbell & al. (2001) is from egg to CI.
Star indicates the development time observed in the present study. |
 Issued from : M. Daase, J.E. Søreide & M. Martynova in Mar. Ecol. Peog. Ser., 2011, 429. [p.117, Table 4]. Issued from : M. Daase, J.E. Søreide & M. Martynova in Mar. Ecol. Peog. Ser., 2011, 429. [p.117, Table 4].
Calanus glacialis. Daily per capita mortality rate (M) and percent daily mortality (PDM) of nauplii for each replicate of each treatment and the mean for each treatment.
P-lim: phosphate limited; FSW: filtered sea water. |
 Issued from : M. Daase, Ø. Varpe & S. Falk-Petersen in J. Plankton Res., 2013, 36 (1). [p.137, Table III]. Issued from : M. Daase, Ø. Varpe & S. Falk-Petersen in J. Plankton Res., 2013, 36 (1). [p.137, Table III].
Estimated abundance (individuals per m3) of Calanus spp. and for Calanus glacialis in each depth layer at both stations
Nota: Samples were taken at Rijpfjorden (80°15.5' N, 22°15.7' E), Svalbard), depth 280 m, and at the ice edge at Sofiadjupet, a deep basin in the southern part of the Arctic Ocean (81°42' N, 14°16' E) depth 2290 m. Zooplankton sampled by vertical hauls from close to the bottom to the surface using a multiple opening/closing net (mesh aperture 200 µm).
Compare with Calanus hyperboreus and Calanus finmarchoicus at the same locations. |
 Issued from : M. Daase, Ø. Varpe & S. Falk-Petersen in J. Plankton Res., 2013, 36 (1). [p.139, Table IV]. Issued from : M. Daase, Ø. Varpe & S. Falk-Petersen in J. Plankton Res., 2013, 36 (1). [p.139, Table IV].
Abundance of Calanus glacialis obseved in net hauls taken in Rijpfjorden and at off-shelf locations in the pack ice north of Svalbard in July 2012.
Nota: Samples were taken at Rijpfjorden (80°15.5' N, 22°15.7' E), Svalbard), depth 280 m, and at the ice edge at Sofiadjupet, a deep basin in the southern part of the Arctic Ocean (81°42' N, 14°16' E) depth 2290 m. Zooplankton sampled by vertical hauls from close to the bottom to the surface using a multiple opening/closing net (mesh aperture 200 µm).
Compare with Calanus finmarchicus and Calanus hyperboreus at the same locations. |
 Issued from : M. Daase, S. Falk-Petersen, Ø. Varpe, G. Darnis, J.E. Søreide, A. Wold, E. Leu, J. Berge, B. Philippe & L. Fortier in Can. J. Fish. Aquat. Sci., 2013, 70. [p.877, Table 2]. Issued from : M. Daase, S. Falk-Petersen, Ø. Varpe, G. Darnis, J.E. Søreide, A. Wold, E. Leu, J. Berge, B. Philippe & L. Fortier in Can. J. Fish. Aquat. Sci., 2013, 70. [p.877, Table 2].
Timing of ice algae and phytoplankton bloom vs life hisyory events and population size and biomass of Calanus glacialis population from different areas across the Artic. |
 Issued from : M. Daase, S. Falk-Petersen, Ø. Varpe, G. Darnis, J.E. Søreide, A. Wold, E. Leu, J. Berge, B. Philippe & L. Fortier in Can. J. Fish. Aquat. Sci., 2013, 70. [p.879, Fig.5]. Issued from : M. Daase, S. Falk-Petersen, Ø. Varpe, G. Darnis, J.E. Søreide, A. Wold, E. Leu, J. Berge, B. Philippe & L. Fortier in Can. J. Fish. Aquat. Sci., 2013, 70. [p.879, Fig.5].
Conceptual figure showing the life history events of Calanus glacialis at different locations and latitudes (based on data collected in Table 2).
Roman numbers refer to 3 main types of environmental conditions).
The timing of reproductive events is closely coupled yo the two major marine primary production events in the Arctic: the ice algal and phytoplankton blooms;
In the Canadian beaufort Sea and the high Arctic Ripfjorden on Svalbard, C. glacialis utilized the ice algae bloom to fuel spawning in spring, while growth and development of the new generation was primilarly supported by the phytoplankton bloom.
Søreide & al. (2010) suggested that variability in ice cover' might lead to mismatch between the timing of ice algal and phytoplankton blooms and timing of reproduction and development, since the development from egg to the first feeding nauplius stage (N III) takes about 2 weeks (Daase & azl., 2011). The offspring can therefore exploit the second bloom more efficiently if it does not follow the first one too closely.
An early ice breakup may abbreviate the ice algal bloom period, and also the gap between ice algal and phytoplankton blooms, and hence lead to poorer growth condition for the population.
Ringuette & al. (2002) found a close relationship between the timing of the phytoplankton bloom and recruitment of copepodite stage 1. The authors use ''time of first occurrence of C1'' as a proxy for the start of reproduction. There was a positive relationship between the week of peak phytoplankton bloom and week of both first occurrence of C1 and maximum C1 abundance.
C. glacialis populations subjected to various environmental conditions across the Arctic showed variability in the timing of reproductive events. Populations that have access to an ice algae bloom prior to the phytoplankton bloom seem to favour an income breeding strategy, perhaps with some capital breeding in parallel with the ice algae feedingt, while those living in an open water system, with only one major bloom event, start reproduction prior to the onset of this bloom. The variability observed suggests that C. glacialis has a flexible reproductive strategy that may explain its wide distribution in Arctic continental shelf seas. |
 Issued from : M. Daase, S. Falk-Petersen, Ø. Varpe, G. Darnis, J.E. Søreide, A. Wold, E. Leu, J. Berge, B. Philippe & L. Fortier in Can. J. Fish. Aquat. Sci., 2013, 70. [p.882, Table 3]. Issued from : M. Daase, S. Falk-Petersen, Ø. Varpe, G. Darnis, J.E. Søreide, A. Wold, E. Leu, J. Berge, B. Philippe & L. Fortier in Can. J. Fish. Aquat. Sci., 2013, 70. [p.882, Table 3].
Overview of timing of ice algae and phytoplankton bloom and timing of copepodite stage I recruitment of Calanus glacialis in different Arctic regions. |
 Issued from : M. Daase, S. Falk-Petersen, Ø. Varpe, G. Darnis, J.E. Søreide, A. Wold, E. Leu, J. Berge, B. Philippe & L. Fortier in Can. J. Fish. Aquat. Sci., 2013, 70. [p.878, Fig.3 (part.)]. Issued from : M. Daase, S. Falk-Petersen, Ø. Varpe, G. Darnis, J.E. Søreide, A. Wold, E. Leu, J. Berge, B. Philippe & L. Fortier in Can. J. Fish. Aquat. Sci., 2013, 70. [p.878, Fig.3 (part.)].
Vertical distribution and abundance (individuals per m3) of copepodite stages of Calanus glacialis in Rijpfjorden. (NE Svalbard; 80°N) |
 Issued from : H. Saito & A. Tsuda in Deep-Sea Res. I, 47. [p.2146, Table I]. Issued from : H. Saito & A. Tsuda in Deep-Sea Res. I, 47. [p.2146, Table I].
Egg diameter, carbon and nitrogen content, and prosome length (PL) of females of Calanus glacialis after McLaren & al., 1988; Hirche & Boher, 1987.
Nota: Compare with N. cristatus, N. tonsus and N. flemingeri and others species in genus Calanus. |
 Issued from : C.J. Corkett, I.A. McLaren & J.-M. Sevigny in Syllogeus, 1986, 58. [p.542, Fig. 3]. Issued from : C.J. Corkett, I.A. McLaren & J.-M. Sevigny in Syllogeus, 1986, 58. [p.542, Fig. 3].
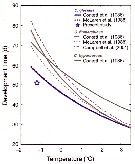
Belehràdek's temperature functions for development to CI and CIV of C. glacialis.
The dashed curve is the function with all parameters fitted, and the solid curves assume that the function for embryonic duration (Fig. 1) is applicable to older stages, differing only in proportionality (a).
Individuals within dashed circles were assumed to be abnormally delayed, and were not used in fitting curves. |
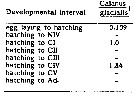 Issued from : C.J. Corkett, I.A. McLaren & J.-M. Sevigny in Syllogeus, 1986, 58. [p.545, Table I]. Issued from : C.J. Corkett, I.A. McLaren & J.-M. Sevigny in Syllogeus, 1986, 58. [p.545, Table I].
Relative times to reach various stages of C. glacialis, assuming equiproportional development.
All times expressed relative to time between hatching and molting to CI.
1 : From Fig. 1.
Nota: Compare with Calanus hyperboreus, C. finmarchicus , C. helgolandicus and C. pacificus. |
 issued from : R.J. Conover & T.D. Siferd in Arctic, 1993, 45 (4). [p.307, Table 2]. issued from : R.J. Conover & T.D. Siferd in Arctic, 1993, 45 (4). [p.307, Table 2].
Numbers and dry weight biomass for the total water column (frpm Barrow Strait), before, during, and after the dark period 1984-1985 and 1985-1986 (Conover, Sifred and Harris, unpubl.).
Compare with Calanus hyperboreus, Metridia longa and Pseudocalanus acuspes in the same area of Barrow Strait.
For the authors, C. glacialis take two years to mature and reproduce in Resolute (Barrow Strait), as in the Barents Sea (Tande & al., 1985). In Hudson Bay, females underwent vertical migration during the ice-algal blooms and showed increased gut pigment when near the ice (Runge & Ingram, 1988), but such behavior was not observed near Resolute. Instead, active feeding and spawning were initiated in late May, when the sympagic algal population had begun to come off the ice (Harris, 1992).
While C. glacialis nauplii became quite abundant in May and June, younger copepodids (C1-C4) did not make a significant contribution in the population until August. These individuals may have contributed to a mid-winter peak of C3. Some further development may take place over the dark period, but fattening of late syages probably precedes a second overwintering and spawning at the start of their third season. Also, in laboratory experiments, late-stage readily ingested the large, wax-ester-containing eggs of C. hyperboreus, which are abundant in the water column during late winter and spring (Conover, unpobl.). |
 Issued from : D.C. Maclellan in Can. J. Zool., 1967, 45. [p.106, Table II]. Issued from : D.C. Maclellan in Can. J. Zool., 1967, 45. [p.106, Table II].
Mean cephalothorax length and 95% fiducial limits of adult female C. finmarchicus s.str. and C. glacialis from Ameralik and Godthaab fjords (West Greenland (± 64°15' N, 52°40' W).
Nota: See comparison with C. finmarchicus in Maclellan D.C (1967, figs. 5-8) for the cephalothoracic length freqiuencies of adult females and males. The early copepodites of the two species are separable by size (see Grainger, 1963), if they are sufficient number to show a unimodal or bimodal distribution. Up to stage V, the copepodites of C. finmarchicus s.str. and C. glacialis are not separable on grounds of morphology (Graincer, 1963).
The peak of fertilization for C. glacialis in the outer fjord appears to be in late December, since the percentage of adult males was dwindling in January, whjle that of adult females was increasing. The few early copepodites found in the February samples marked the beginning of a prolonged period of spawning, the ovaries of the adult females ripening in mid-February in most of the population. Spawning was at its peak in March, when adult males were scarce in the samples and adult females were found near the surface. The April and May samples were poor in numbers but June and July contained early copepodites and a small number of adult females, evidence of the prolonged spawning of the species. The generation spawned in spring had reached stage V by late October, most attaining maturity in December and January. The cycle then for C. glacialis in the outer fjord is annual with a prolonged spawning, in which early copepodites appear in late summer, while the generation spawned in the spring is still immature.
In the inner fjord, fertilization begins in early December, indicated by the finding of adult females with unripe ovaries bur bearing discharged spermatophores in a sample December 1. The peak of fertilization is probably in late December, since by mid-January adult males are declining and adult females carrying spermatophores are dominant. Spawning appeared to be at its peak in March and April, when ripe adult females were near the surface in considerable numbers. Stage I copepodites of a new generation were found first in April reaching stages II and III in May. The population during the summer months consisted largely of stages IV and V, only one adult female being found in July and no adult males from April until December. The cycle for the species in yje inner fjord is annual, the single brood appearing as copepodite I in April, reaching stage V by September, and maturing in December and January. |
 Issued from : D.C. Maclellan in Can. J. Zool., 1967, 45. [p.103, Table I]. Issued from : D.C. Maclellan in Can. J. Zool., 1967, 45. [p.103, Table I].
List of temperatures and salinities , Godthaab Fjord (64°10' N, 52°50' W), 1945-1946 |
 Issued from : D.C. Maclellan in Can. J. Zool., 1967, 45. [p.111, Table III]. Issued from : D.C. Maclellan in Can. J. Zool., 1967, 45. [p.111, Table III].
Monthly percentage composition in the outer of Godthaab Fjord (W Greenland).
Comparison between the life history C. glacialis and C. finmarchicus at the same place.
Nota: See comparison with C. finmarchicus in Maclellan D.C (1967, figs. 5-8) for the cephalothoracic length freqiuencies of adult females and males.. The early copepodites of the two species are separable by size (see Grainger, 1963), if they are sufficient number to show a unimodal or bimodal distribution. Up to stage V, the copepodites of C. finmarchicus s.str. and C. glacialis are not separable on grounds of morphology (Graincer, 1963).
The peak of fertilization for C. glacialis in the outer fjord appears to be in late December, since the percentage of adult males was dwindling in January, whjle that of adult females was increasing. The few early copepodites found in the February samples marked the beginning of a prolonged period of spawning, the ovaries of the adult females ripening in mid-February in most of the population. Spawning was at its peak in March, when adult males were scarce in the samples and adult females were found near the surface. The April and May samples were poor in numbers but June and July contained early copepodites and a small number of adult females, evidence of the prolonged spawning of the species. The generation spawned in spring had reached stage V by late October, most attaining maturity in December and January. The cycle then for C. glacialis in the outer fjord is annual with a prolonged spawning, in which early copepodites appear in late summer, while the generation spawned in the spring is still immature.
In the inner fjord (see Table IV), fertilization begins in early December, indicated by the finding of adult females with unripe ovaries bur bearing discharged spermatophores in a sample December 1. The peak of fertilization is probably in late December, since by mid-January adult males are declining and adult females carrying spermatophores are dominant. Spawning appeared to be at its peak in March and April, when ripe adult females were near the surface in considerable numbers. Stage I copepodites of a new generation were found first in April reaching stages II and III in May. The population during the summer months consisted largely of stages IV and V, only one adult female being found in July and no adult males from April until December. The cycle for the species in the inner fjord is annual, the single brood appearing as copepodite I in April, reaching stage V by September, and maturing in December and January. |
 Issued from : D.C. Maclellan in Can. J. Zool., 1967, 45. [p.112, Table IV]. Issued from : D.C. Maclellan in Can. J. Zool., 1967, 45. [p.112, Table IV].
Monthly percentage composition in the inner of Godthaab Fjord (W Greenland).
Comparison between the life history C. glacialis and C. finmarchicus at the same place. |
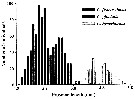 Issued from : G.J. Parent, S. Plourde & J. Turgeon in J. Plankton Res., 2011, 33 (11). [p.1658, Fig. 2]. Issued from : G.J. Parent, S. Plourde & J. Turgeon in J. Plankton Res., 2011, 33 (11). [p.1658, Fig. 2].
Prosome length overlap among three Calanus species, stage V, along the Canadian Arctic and Atlantic Coasts when all stations from both years are pooled (N = 1159) .
See Stations' chart to Calanus finmarchicus. |
 Issued from : G.J. Parent, S. Plourde & J. Turgeon in Limnol. Oceanogr., 2012, 57 (4). [p.1059, Fig. 1]. Issued from : G.J. Parent, S. Plourde & J. Turgeon in Limnol. Oceanogr., 2012, 57 (4). [p.1059, Fig. 1].
Map of the Arctic and North Atlantic Ocean showing the frequency of parental species and hybrids (as determined with mtDNA markers) at each station. |
 Issued from : G.J. Parent, S. Plourde & J. Turgeon in Limnol. Oceanogr., 2012, 57 (4). [p.1058, Table 1]. Issued from : G.J. Parent, S. Plourde & J. Turgeon in Limnol. Oceanogr., 2012, 57 (4). [p.1058, Table 1].
Description of sampling stations and genetic identification of parental species and hybrids based on nucDNA markers.The number of genotypes classified as C. glacialis (G), hybrids (H), and C. finmarchicus (F) are given for each station. |
 Issued from : G.J. Parent, S. Plourde & J. Turgeon in J. Plankton Res., 2011, 33 (11). [p.1659, Fig. 3]. Issued from : G.J. Parent, S. Plourde & J. Turgeon in J. Plankton Res., 2011, 33 (11). [p.1659, Fig. 3].
Spatial variability in the extent of prosome length overlap among Calanus species.
Arrows indicate ODPL (the optimized discriminant prosome length). For each station, the number of individuals (N) are given, respectively, for C. finmarchicus, gnacialis, hyperboreus (See Chart , fig.1).
Rem.: At each station, the authors used discriminant analyses to define prosome lengths that minimize species misidentification. Discriminant analysis aims at establishing rules for allocating individuals to a priori defined groups (here, species based on molecular-based identyification) using information provided by one or several characteristics (here, prosome length) of each individual (see Der & Everitt, 2002). ODPL is used to assess concordance between molecular-based and size-based identification and calculate the species diagnosis error rate. |
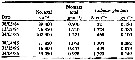
 Issued from : G.J. Parent, S. Plourde & J. Turgeon in J. Plankton Res., 2011, 33 (11). [p.1657, Table II]. Issued from : G.J. Parent, S. Plourde & J. Turgeon in J. Plankton Res., 2011, 33 (11). [p.1657, Table II].
Sampling specifications and Calanus glacialis prosome length (PL mm) at each station based on genetic species identification overlap between Calanus hyperboreus (H) Calanus glacialis (G), C. fiunmarchicus (F), as FG, GH and FH.
For each pair of species PL overlap (%) is the ratio of PL overlap (mm) over the total PL range (mm) of both species. FG, GH and FG indicate pairwise species PL overlap.
Samp depth, sampling depth; N/S, species PL range was not subsampled; N/A, species was absent from the sample.
a Stations used to test inter-annual variability.
b Stations TCEN-2 (2009) and RCEN-3 (2008) are 19 km apart and were used as temporal replicates. |
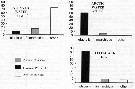
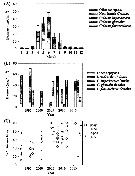
 Issued from : E.A. Ershova, E.R. Hopcroft, K.N. Kosobokova, K. Matsuno, R.J. Nelson, A. Yamaguchi & L.B. Eisner in Oceanography, 2015, 18 (3). [p.108, Fig.5]. Issued from : E.A. Ershova, E.R. Hopcroft, K.N. Kosobokova, K. Matsuno, R.J. Nelson, A. Yamaguchi & L.B. Eisner in Oceanography, 2015, 18 (3). [p.108, Fig.5].
Relative contribution to biomass of different taxonomic groups in the Chukchi Sea during several of the study years (only years sampled by 100-200 µm mesh nets reported due to under sampling of smaller taxa by coarser nets).
Water masses characteristics In abscisa: see table 1.
Nota: A significant increase in zooplankton biomass, mostly driven by an advected population of the copepod C. glacialis, was observed within the southern Chukchi Sea, which likely reflects increasing inflow of biomass-rich Pacific water during the extended summer months. A trend is also observed that suggests a northward shift of Pacific species into the Chukchi Sea, which may be driven by a longer ice-free period and extended warmer summer temperatures combined with a shifting phenology favoring earlier development of species. |
 Issued from : E.A. Ershova, E.R. Hopcroft, K.N. Kosobokova, K. Matsuno, R.J. Nelson, A. Yamaguchi & L.B. Eisner in Oceanography, 2015, 18 (3). [p.103, Table 1]. Issued from : E.A. Ershova, E.R. Hopcroft, K.N. Kosobokova, K. Matsuno, R.J. Nelson, A. Yamaguchi & L.B. Eisner in Oceanography, 2015, 18 (3). [p.103, Table 1].
Summary of Chukchi Sea water mass characteristics concurrent with zooplankton sampling. |
 Issued from : E.A. Ershova, E.R. Hopcroft, K.N. Kosobokova, K. Matsuno, R.J. Nelson, A. Yamaguchi & L.B. Eisner in Oceanography, 2015, 18 (3). [p.109, Fig.6]. Issued from : E.A. Ershova, E.R. Hopcroft, K.N. Kosobokova, K. Matsuno, R.J. Nelson, A. Yamaguchi & L.B. Eisner in Oceanography, 2015, 18 (3). [p.109, Fig.6].
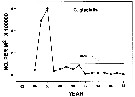
Interannual variability of Pacific copepod Calanus glacialis (a) abundance in the Chukchi Sea during 1946-2012.
Each symbol represents one cruise; bars indicate 95% confidence interval. Dashed line shows fitted trend over averaged data.
Blue circle: June; green circle: July: yellow circle; August; purple circle: September. |
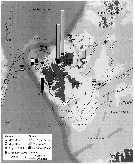
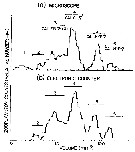
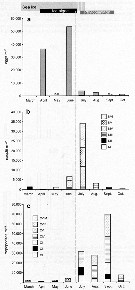
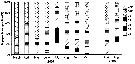
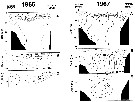
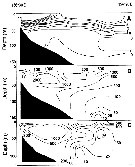 Issued from : A.I. Pinvhuk & A.J. Paul in Univ. Alaska Sea Grant College Progr., 2000. [p.7, Fig.6]. Issued from : A.I. Pinvhuk & A.J. Paul in Univ. Alaska Sea Grant College Progr., 2000. [p.7, Fig.6].
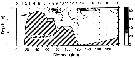
A = vertical distribution of water temperature. B = total zooplankton biomass (mg.m3). E = Calanus glacialis biomass (mg.m3) on the profile along 57°16'N in summer 1967; mesh = 0.168. (from Kotlyar & Chernyavskiy, 1970b). |
 Issued from : A.I. Pinvhuk & A.J. Paul in Univ. Alaska Sea Grant College Progr., 2000. [p.9, Fig.7]. Issued from : A.I. Pinvhuk & A.J. Paul in Univ. Alaska Sea Grant College Progr., 2000. [p.9, Fig.7].
A = vertical distribution of water temperature. B = total zooplankton biomass (mg.m3). E = Calanus glacialis biomass (mg.m3) on the profile along 147°33' E in summer 1964; mesh = 0.168. (from Kotlyar & Chernyavskiy, 1970b). |
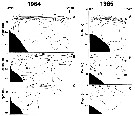 Issued from : A.I. Pinvhuk & A.J. Paul in Univ. Alaska Sea Grant College Progr., 2000. [p.11, Fig.9]. Issued from : A.I. Pinvhuk & A.J. Paul in Univ. Alaska Sea Grant College Progr., 2000. [p.11, Fig.9].
A = vertical distribution of water temperature. B = total zooplankton biomass (mg.m3). C = Calanus glacialis biomass (mg.m3) on the profile along 151°20' E in summers 1964 and 1965; mesh = 0.168. (from Kotlyar & Chernyavskiy, 1970b). |
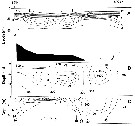
 Issued from : A.I. Pinvhuk & A.J. Paul in Univ. Alaska Sea Grant College Progr., 2000. [p.10, Fig.8]. Issued from : A.I. Pinvhuk & A.J. Paul in Univ. Alaska Sea Grant College Progr., 2000. [p.10, Fig.8].
A = vertical distribution of water temperature. B = total zooplankton biomass (mg.m3). C = Calanus glacialis biomass (mg.m3) on the profile along 147°35' E in summer 197; mesh = 0.168. (from Kotlyar & Chernyavskiy, 1970b) |
 Issued from : A.I. Pinvhuk & A.J. Paul in Univ. Alaska Sea Grant College Progr., 2000. [p.12, Fig.10]. Issued from : A.I. Pinvhuk & A.J. Paul in Univ. Alaska Sea Grant College Progr., 2000. [p.12, Fig.10].
A = vertical distribution of water temperature. B = total zooplankton biomass (mg.m3). C = Calanus glacialis biomass (mg.m3) between Cape Evreinov and Cape Hayryuzov in summers 1965 and 1967; mesh = 0.168. (from Kotlyar & Chernyavskiy, 1970b) |
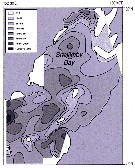 Issued from : A.I. Pinvhuk & A.J. Paul in Univ. Alaska Sea Grant College Progr., 2000. [p.19, Fig.19]. Issued from : A.I. Pinvhuk & A.J. Paul in Univ. Alaska Sea Grant College Progr., 2000. [p.19, Fig.19].
Distribution of Calanus glacialis biomass (mg.m3) in the 0-50 m layer in Shelikhov Bay during June 1963 (from Kotlyar, 1965). |
 Issued from : A.I. Pinvhuk & A.J. Paul in Univ. Alaska Sea Grant College Progr., 2000. [p.21, Fig.24]. Issued from : A.I. Pinvhuk & A.J. Paul in Univ. Alaska Sea Grant College Progr., 2000. [p.21, Fig.24].
Distribution of Calanus glacialis biomass (mg.m3) in the 0-50 m layer in the northern Okhotsk Sea during August,1964. (from Kotlyar, 1965) |
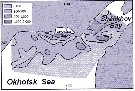
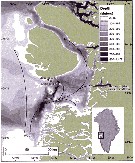
 Issued from : A.I. Pinvhuk & A.J. Paul in Univ. Alaska Sea Grant College Progr., 2000. [p.31, Fig.31 A]. Issued from : A.I. Pinvhuk & A.J. Paul in Univ. Alaska Sea Grant College Progr., 2000. [p.31, Fig.31 A].
Distribution of Calanus glacialis biomass (mg.m3) in the 0-100 m layer in the Okhotsk Sea.
See legend in Metridia pacifica (fig.35 D) 1: September-October 1652 (extended line); 4: August)September 1949 (dotted line). (from Lubny-Gertsik, 1959).
Nota: Compare with Neocalanus plumchrus (Fig. 35 A) and Neocalanus cristatus (Fig.35 B). |
 Issued from : E.F. Møller & T.G. Nielsen in Limnol. Oceanogr., 2019, 9999. [p.2, Fig.1]. Issued from : E.F. Møller & T.G. Nielsen in Limnol. Oceanogr., 2019, 9999. [p.2, Fig.1].
Location of the Calanus spp. sampling site and physical conditions in Disko bay, wzstern Greenland.
WGC is the West Greenland current.
Nota; The target is the study of the climatic change with less sea ice and a modification of the copepod species' composition, therefore the food-web modifications.
See in the same authors Calanus finmarchicus and Calanus hyperboreus. |
 Issued from : E.F. Møller & T.G. Nielsen in Limnol. Oceanogr., 2019, 9999. [p.6, Fig.4]. Issued from : E.F. Møller & T.G. Nielsen in Limnol. Oceanogr., 2019, 9999. [p.6, Fig.4].
Copepod biomass in Disko Bay (W Greenland).
(A) Average biomass of copepods (Calanusfemales, other Calanus and other copepods, ±SE of total copepod biomass).
(B) Average biomass of copepods in May and June from 1992 to 2018.
(C) The contribution (%) of C. finmarchicus females to the total biomass of Calanus females.
Nota: Calanus spp. dominated the copepod community and constituted more than 90% of the biomass in spring and summer (April to August). Females made up 21-62 % of the Calanus population. In May and June, on average 96 % of the copepod biomass was Calanus of which 46 % was females. |
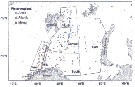 Issued from : J.M. Aarflot, H.R. Skjoldal, P. Dalpadado & M. Skern-Mauritzen in ICES J. Mar. Sc., 2018, 75 (7). [p.2344, Fig.1]. Issued from : J.M. Aarflot, H.R. Skjoldal, P. Dalpadado & M. Skern-Mauritzen in ICES J. Mar. Sc., 2018, 75 (7). [p.2344, Fig.1].
Geographical distribution of samples analysed in this study (n = 616). The Barents Sea was divided into five oceanographic regions with dominating water mass and bottom depth (mean of sampling stations in m) (West: 70-75°N, 15.5-21°E : Atlantic; South: 70-73.5°N, 21-40°E : Atlantic; Central: 74-78°N, 21-38°E : Arctic/mixed; North: 78-80°N, 25-36°E : Arctic/mixed; East: 71-80°N, 41-61°E : Arctic/mixed.
Outer bounds of the polygons are included as a visual aid. Samples were defined as Artic (T >0°C), Atlantic (T >3°C), or mixed (0°CThe Fugløya-Bear transect (FB transect: grey line in the figure) is a standard oceanographic transect in the western region covered five to eight times each year. Samples are regularly processed for species identification, and have consistent seasonal coverage since 1995.
For the authors, Calanus spp. are crucial prey for fishes, seabirds and mammals in the Barents Sea ecosystems, as in the Northwern Atlantic. The objective is to determine the respective contribution of the main pelagic copepods, Calanus finmarchicus, C. hyperboreus, C. glacialis collected over 30-year period. These copepods constitute around 80 % of the total. Though the Calanus species co-occur in most regions, C. glacialis dominates in the Artic waters, while C. finmarchicus dominates in Atlantic waters. The larger (in size) C. hyperboreus has considerably lower biomass in the Barents Sea, than the other Calanus species
In the western area of the Barents Sea , the authors observe indications of an ongoing borealization of the zooplankton community, with a decreasing proportion of C. glacialis over the past 20 years, and the Atlantic C. finmarchicus have increased during the same period.
See figures and Tables in the same authors for C. finmarchicus an and C. hyperboreus. |
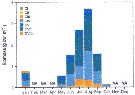 Issued from : J.M. Aarflot, H.R. Skjoldal, P. Dalpadado & M. Skern-Mauritzen in ICES J. Mar. Sc., 2018, 75 (7). [p.2349, Fig.9]. Issued from : J.M. Aarflot, H.R. Skjoldal, P. Dalpadado & M. Skern-Mauritzen in ICES J. Mar. Sc., 2018, 75 (7). [p.2349, Fig.9].
Mean biomass (g dry weight m2) per stage (CI to CVI female and male) for C. glacialis, with data from the Central, North and East regions considered as most representative for this species.
Months with no observations are indicated by NA. |
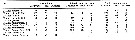 Issued from : N.J. Karnovsky, S. Kwasniewski, J.M. Weslawski, W. Walkusz & A. Beszczynska-Möller in Mar. Ecol. Prog. Ser., 2003, 289. [p.293, Table 1]. Issued from : N.J. Karnovsky, S. Kwasniewski, J.M. Weslawski, W. Walkusz & A. Beszczynska-Möller in Mar. Ecol. Prog. Ser., 2003, 289. [p.293, Table 1].
Calanus glacialis and C. finmarchicus found in little auk diet samples and net tows in Atlantic and Arctic Water masses (%). Copepodi stages denoted C youngest and smallest to older and larger) and mature female (f) and male (m)
Samples during the summer 2001 western Spitsbergen, area surrounding little auk (Alle alle) colonies on Svalbard.
Results indicate that little auks feed mainly on the large copepod Calanus glacialis, restricting their foraging activity to Arctic water that contains this copepod and avoid Atlantic water that contains a smaller copepod C. finmarchicus.
Therefore little auks may be impacted by climater change because during years the flow Atlantic water increases.
Sample: 21 vertical tows to 50 m using a WP-2 net equipped with filtering gauze of 0.5 mm.
Little auk diets: calanus copepods were the most common type of prey (93% of all prey individyuals and 87% of prey biomass (mg dry weight); among the calanus, 75% by number were C. glacialis Stage V (995% of Calanus biomass. |
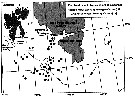 Issued from : N.J. Karnovsky, S. Kwasniewski, J.M. Weslawski, W. Walkusz & A. Beszczynska-Möller in Mar. Ecol. Prog. Ser., 2003, 289. [p.290, Fig. 1]. Issued from : N.J. Karnovsky, S. Kwasniewski, J.M. Weslawski, W. Walkusz & A. Beszczynska-Möller in Mar. Ecol. Prog. Ser., 2003, 289. [p.290, Fig. 1].
Svalbard Archipelago (inset). Station locations of CTD casts and zooplankton net tows are numbered circles to the southwest of Hornsund fjord. Stations were classified as being in Arctic Water (Sorkapp Current, gray dots) or Atlantivc Water (West Spitsbergen Current, black dots) based on physical properties and zooplankton faunistic similarity. |
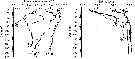 Issued from : N.J. Karnovsky, S. Kwasniewski, J.M. Weslawski, W. Walkusz & A. Beszczynska-Möller in Mar. Ecol. Prog. Ser., 2003, 289. [p.292, Fig. 2]. Issued from : N.J. Karnovsky, S. Kwasniewski, J.M. Weslawski, W. Walkusz & A. Beszczynska-Möller in Mar. Ecol. Prog. Ser., 2003, 289. [p.292, Fig. 2].
Representative temperature and salinity profiles from 6 stations.
Stations were classified as Arctic if they had profiles similar to 18, 17 and 13 (circled numbers); stations were classified as Atlantic if they had profiles similar to 15, 6 and 16. Locations of stations given in Fig.1. |
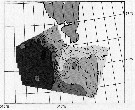 Issued from : N.J. Karnovsky, S. Kwasniewski, J.M. Weslawski, W. Walkusz & A. Beszczynska-Möller in Mar. Ecol. Prog. Ser., 2003, 289. [p.293, Fig.3]. Issued from : N.J. Karnovsky, S. Kwasniewski, J.M. Weslawski, W. Walkusz & A. Beszczynska-Möller in Mar. Ecol. Prog. Ser., 2003, 289. [p.293, Fig.3].
Surface plot of temperature at 2 m showing stro,ng gradient in temperature between Arctic and Atlantic waters. Contour lines of area are temperature (°C). |
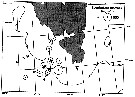 Issued from : N.J. Karnovsky, S. Kwasniewski, J.M. Weslawski, W. Walkusz & A. Beszczynska-Möller in Mar. Ecol. Prog. Ser., 2003, 289. [p.294, Fig. 4]. Issued from : N.J. Karnovsky, S. Kwasniewski, J.M. Weslawski, W. Walkusz & A. Beszczynska-Möller in Mar. Ecol. Prog. Ser., 2003, 289. [p.294, Fig. 4].
Distribution of total biomass in study area (mg dry weight m-3.
The average density of zooplankton was similar in both water masses,, but average biomass was higher at Arctic stations (1151 ind/ m3 and 153 mg/m3 for Atlantic stations; 1173 ind./m3 and 280 mg/m3 for Arctic stations)
Calanus copepods made up 90% of the zooplankton by number and 73% of the biomass (mg/m3) in Atlantic water and 95% by number and 90% of the biomass in Arctic water.
The differences in terms of biomass between the two water masses largely stem from differences in the composition of the Calanus zooplankton. The Atlantic water contained large numbers of C. finmarchicus and the Arctic water C. glacialis.
While C. glacialis and C. finmarchicus were both found in both Arctic and Atlantic water nettows, C. finmarchicus accounted for only 16% of zooplankton by number (7% biomass) in Arctic water and C. glacialis constituted 12% of the zooplankton by number (20% biomass) in Atlantic water. |
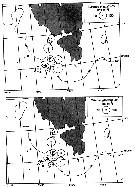 Issued from : N.J. Karnovsky, S. Kwasniewski, J.M. Weslawski, W. Walkusz & A. Beszczynska-Möller in Mar. Ecol. Prog. Ser., 2003, 289. [p.294-295, Figs.5 and 6]. Issued from : N.J. Karnovsky, S. Kwasniewski, J.M. Weslawski, W. Walkusz & A. Beszczynska-Möller in Mar. Ecol. Prog. Ser., 2003, 289. [p.294-295, Figs.5 and 6].
Distribution of stage V copepodids in the study area, individuals m-3 and biomass (mg. m-3. |
| | | | Loc: | | | Arct. (all polar basins), Nansen Basin, Amundsen basin, Barrow Strait, Arct. (Fletcher's Ice Is.), Fram Strait, Spitsbergen, Svalbard Archipelago, Rijpfjorden, White Sea, Chupa Inlet, Barents Sea, Franz Josef Land, Pechora Sea, Laptev Sea, Lomonosov Ridge, Chukchi Sea, SE Beaufort Sea, Canada Basin), Devon Island, Amundsen Gulf, Barrow Strait, Fram Strait, Kongsfjorden (Spitsbergen), Svalbard, Greenland Sea, Baffin Bay, Disko Bay, Nuuk, off shore Godthabsfjord, Davis Strait, Labrador Sea, Nova Scotia, Halifax, Browns Bank, Emerald Basin, G. of St. Lauwrence, Rimouski, off Newfoundland, Gulf of Maine (rare), NE & NW Atlant. (temperate), Norway (fjords), off Bear Island, Kuril-Kamchatka, E Sakhalin, Okhotsk Sea, Bering Sea, S Aleutian Basin, off N Hawaii | | | | N: | 258 | | | | Lg.: | | | (72) F: 4,3-3,4; M: 3,7-3,1; (329) F: 5,46-3,6; M: 5,36-3,9; (339) F: 5,05; (796) F: 5,6-4,7; M: 4,35-5,55; (866) F: 3,3-5,5; M: 3,9-5,4; (1099) F: 4,25-6,0; (1191) F: 3,69-3,94; {F: 3,30-6,00; M: 3,10-5,60}
The mean female size is 4.651 mm (n = 11; SD = 0.9506), and the mean male size is 4.408 mm (n = 8; SD = 0.9201). The size ratio (male : female) is 0.96. | | | | Rem.: | Cette espèce polaire semble s'être accrue recemment en Atlantique NW jusqu'à 39° (Johns & al., 2001) off Georges Bank et par Park (1968) au nord d'Hawaii (30°N, 155°W).
Voir aussi les remarques en anglais | | | Dernière mise à jour : 19/06/2023 | |
|
|
 Toute utilisation de ce site pour une publication sera mentionnée avec la référence suivante : Toute utilisation de ce site pour une publication sera mentionnée avec la référence suivante :
Razouls C., Desreumaux N., Kouwenberg J. et de Bovée F., 2005-2026. - Biodiversité des Copépodes planctoniques marins (morphologie, répartition géographique et données biologiques). Sorbonne Université, CNRS. Disponible sur http://copepodes.obs-banyuls.fr [Accédé le 07 avril 2026] © copyright 2005-2026 Sorbonne Université, CNRS
|
|
|
|

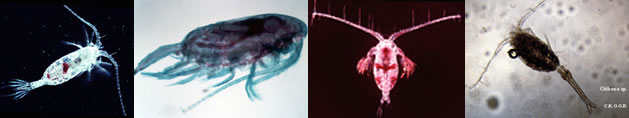


;)
;)
;)
;)
;)
;)
;)
;)
;)
;)
;)
;)
;)
;)
;)
;)
;)
;)
;)
;)
;)
;)
;)
;)
;)
;)
;)
;)
;)
;)
;)
;)
;)
;)
;)
;)
;)
;)
;)
;)
;)
;)
;)
;)
;)
;)
;)
;)
;)
;)
;)
;)
;)
;)
;)
;)
;)
;)
;)
;)
;)
;)
;)
;)
;)
;)
;)
;)
;)
;)
;)
;)
;)
;)
;)
;)
