|
|
 |
Fiche d'espèce de Copépode |
|
|
Calanoida ( Ordre ) |
|
|
|
Calanoidea ( Superfamille ) |
|
|
|
Calanidae ( Famille ) |
|
|
|
Calanus ( Genre ) |
|
|
| |
Calanus propinquus Brady, 1883 (F,M) | |
| | | | | | | Syn.: | Calanus aculeatus Brady,1918;
no C. propinquus : Pearson, 1906 (p.5); Sewell, 1948 (p.395, 555); Ramirez, 1969 (p.35, figs.F,M) | | | | Ref.: | | | Brady, 1883 (p.34, figs.F,M); Giesbrecht, 1892 (part., p.91, 129, figs.F,M) ; Giesbrecht & Schmeil, 1898 (part., p.15); Giesbrecht, 1902 (p.16, figs.F,M); Wolfenden, 1911 (p.190, Rem.F,M); Farran, 1929 (p.207, 214, Rem.); Vervoort, 1951 (p.27, figs.F,M, Rem.); 1957 (p.26, Rem.); Tanaka, 1960 (p.10, figs.F, juv.F); Tanaka, 1964 (p.5); Vervoort, 1965 b (p.384, figs.F,M); ? Ramirez, 1966 (p.5, figs.F,M); Vinogradov, 1968 (1970) (p.66, 67, 69, 234); Bradford, 1971 b (p.15, figs.F,M, Rem.); Marshall & Orr, 1972 (p.8); Brodsky, 1972 (1975) (p.9, 71, 87, 117, figs.); Vyshkvartzeva, 1972 (1975) (p.188, fig.); Bradford & Jillett, 1974 (p.6); Vyshkvartzeva, 1976 (p.14); 1977 a (p.97, figs.); Séret, 1979 (p.20, figs.F,M, Rem.); Björnberg & al., 1981 (p.618, figs.F,M); Schnack, 1982 (p.144, fig.Md); Fleminger, 1985 (p.275, 285, Table 1, 4, Rem.:A1); Prado Por, 1986 (p.517); Bradford, 1988 (p.74, 76); Nishida, 1989 (p.173, table 1, 2, 3: dorsal hump); Razouls, 1994 (p.25, figs.F,M, Rem.); Bradford-Grieve, 1994, figs.F,M, fig.98); Menshenina & Melnikov, 1995 (p.129); Bradford-Grieve & al., 1999 (p.877, 907, figs.F,M); Michels & Schnack-Schiel, 2005 (p.483, , fig.2: Md); Ferrari & Dahms, 2007 (p.62, Rem.); Park & Ferrari, 2009 (p.143, Table 2, Appendix 1, biogeography from Southern Ocean); Cheng F. & al., 2013 (p.119, molecular biology, GenBank, p.125: Rem.); Andronov, 2014 (p.40, figs.: Mx2 & Mxp) | 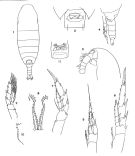 Female: 1, habitus (dorsal); 2, Head (lateral); 3, genital segment (ventral); 4, Th5 and Urosome (lateral); 5, P1; 6, P2; 7, P5; 8, internal side of basipodite 1 of P5; issued from : Brodsky K.A. in Issled. Fauny Morei, 1972, 12 (20): 5-110. 9, P5; 10, internal side of basipodite 1 of P5; issued from : Brady in Rep. scient. Results Voy. Challenger, Zool., 1883, 8 (23): 1-142. 11, genital segment; issued from : Brodsky, 1972
|
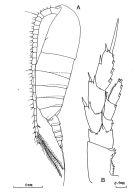 issued from : J.M. Bradford-Grieve in The Marine Fauna of New Zealand: Pelagic Calanoid Copepoda. National Institute of Water and Atmospheric Research (NIWA). New Zealand Oceanographic Institute Memoir, 102, 1994. [p.32, Fig.10]. Female: A, habitus (lateral left side); B, P5.
|
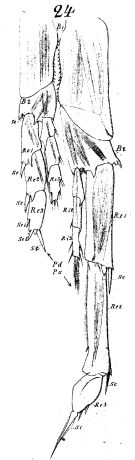 issued from : W. Giesbrecht in Fauna Flora Golf. Neapel, 1892, 19. [Taf.8, Fig.24]. Male: 24, P5 (anterior surface).
|
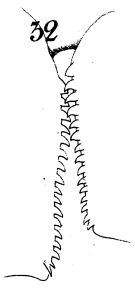 issued from : W. Giesbrecht in Fauna Flora Golf. Neapel, 1892, 19. [Taf.8, Fig.32]. Male: 32, inner border of basipodal segment 1 of P5 (anterior surface).
|
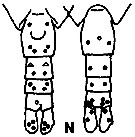 issued from K. Hulsemann in Invert. Taxon., 1994, 8. [p.1477, Fig.28, N]. Female: N, urosome (left: ventral); right: dorsal). Pore signature schematic by pooled samples (symbols are considerably larger than pores): Filled circle: 100 % presence; open circle: 95-99 % presence; triangle: 50-89 % presence. n = 12.
|
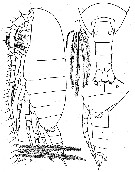 issued from : W. Vervoort in Verh. K. ned. Akad. Wet., Afd. Natuurk., 1951, (Sect. 2) 47 (2). [p.28, Fig.15]. Female (from 51°11'S, 11°17'E): a, habitus (lateral); b, posterior part cephalothorax and urosome (dorsal; caudal setae omitted); c, idem (lateral). Nota : Rostrum composed of 2 slender filaments, slightly swollen at the basal portion (frontal organ). Head and 1st thoracic segment separated, 4th and 5th separated. Proportional lengths of cephalothorax and abdome as 82 :24. Postero-lateral thoracic border broadly triangular, covering the beginning of the genital segment, laterally the apex is produced into a bluntly pointed, triangular, minute flap. Urosome 4-segmented ; proportional lengths with t caudal rami 32 :20 :16 :10 :22 = 100. Anal flap small. Caudal rami about twice as long as wide, carrying 4 marginal setae of subequal length on each ramus, all densely plumose, in addition 1 small, haired, internal seta and 1 short external seta. A1 25-segmented (separation between the 8th and 9th indistinct) reach the apex of the caudal rami ; the 23th and 24th segments have curoous and remarkably long and plumose, thick setae.
|
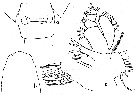 issued from : W. Vervoort in Verh. K. ned. Akad. Wet., Afd. Natuurk., 1951, (Sect. 2) 47 (2). [p.29, Fig.16]. Female: a, genital somite (ventral); b, forehead (dorsal); c, left Mx1. Nota: Genital segment ventrally with slightly elevated genital swelling, 2 small circular receptacles open on the genital sxelling and are covered by a rather small, squarish genital flap.Mx1 big, with a distinct 1st and 2nd outer lobe, the latter with a strong, haired seta ; arrangement and number of setae as in Calanus simillimus.
|
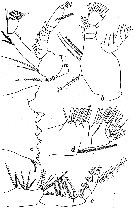 issued from : W. Vervoort in Verh. K. ned. Akad. Wet., Afd. Natuurk., 1951, (Sect. 2) 47 (2). [p.30, Fig.17]. Female: a, left A2; b, left Md (mandibular palp); c, left Md (cutting edge); d, left Mx2; e, left Mxp. Nota: A2 with endopodal segment, about 5 times as long as wide, distal portion of external margin haired. Md with the 2nd basal segment elongate, with 4 setae on the internal margin ; 1st endopodal segment with a big, sack-like tubercle, carrying 4 setae ; 2 nd endopodal segment broad at the apex with 9 marginal setae plus 2 additional setae on the posterior surface ; of the exopod the first two segments apparently fused, there are totally 6 setae of which the apiical segment carries 2. Mx2 is as Calanus simillimus, the ventral border carries a haired seta, not greatly arched.
|
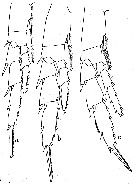 issued from : W. Vervoort in Verh. K. ned. Akad. Wet., Afd. Natuurk., 1951, (Sect. 2) 47 (2). [p.32, Fig.18]. Female: a, right P2; b, right P3; c, right P4. (The anterior surface of all feet has been figured).
|
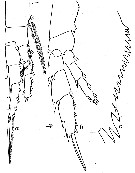 issued from : W. Vervoort in Verh. K. ned. Akad. Wet., Afd. Natuurk., 1951, (Sect. 2) 47 (2). [p.33, Fig.19]. Female: a, right P1 (anterior); b, right P5 (anterior); c, inner edge of the 1st basal segment of the left P5 (showing the arrangement of the teeth). Nota: P5, compared with Calanus simillimus, have differently arranged teeth along the inner edge of the 1st basal segment ; each segment has a curved row of 15 small teeth and a basal group of 3 much bigger teeth ; the outer edge spine on the 3rd exopodal segment divides the margin in proportions of 5 :3.
|
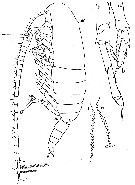 issued from : W. Vervoort in Verh. K. ned. Akad. Wet., Afd. Natuurk., 1951, (Sect. 2) 47 (2). [p.34, Fig.20]. Male (from 64°29'S, 9°39'W): a, habitus (lateral); b, P5 (posterior); c, inner edge of the 1st basal segment of P5. (lt = left foot, rt = right foot). Nota : The general shape of the body differs considerably from that of the female, especially in dorsal aspect. Head and 1st thoracic segment separated by a weak line, 4th and 5th well separated. Cephalon in lateral view smoothly rounded, vaulted, with a distinct chitinous knob opposite place of attachment of A2. Cephalothorax and abdomen proportional lengths as 8 :3. Postero-lateral margin of last thoracic segment produced into rounded flaps, covering the 1st urosomal segment, extreme apex of that margin bluntly pointed (points of lateral thoracic margin more distinctly visible in dorsal aspect). Urosome 5-segmented, proportional lengths with the caudal rami 13 :19 :17 :15 :9 :17 = 100. A1 22-segmented (1st-2nd and 3rd-5th segments completely fused, the line separating the 8th-9th and 24th-25th indistinct), reach beyond the caudal rami by the last 2 or 3 segments. P5 resemble those of Calanus simillimus ; the left le gis slightly longer than the abdomen of the male ; the 1st basal segment on the left side is slightly longer than that on the right, inner edge with a row of 20 small teeth of uniform length ; 16 are found on the right side
|
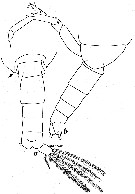 issued from : W. Vervoort in Verh. K. ned. Akad. Wet., Afd. Natuurk., 1951, (Sect. 2) 47 (2). [p.35, Fig.21]. Male: a-b, posterior part cephalothorax and urosome (dorsal and lateral, respectively). Nota: Genital segment slightly asymmetrical, produced on the left side). Caudal rami about twice as mong as wide, with 4 marginal setae of subaqual size on each ramus, in addition 1 small, curved internal seta and 1 short external seta, all setae densely plumose.
|
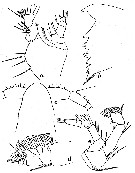 issued from : W. Vervoort in Verh. K. ned. Akad. Wet., Afd. Natuurk., 1951, (Sect. 2) 47 (2). [p.36, Fig.22]. Male: a, right Md (mandibular palp); b, Md (cutting edge); c, forehead (dorsal); d, right Mx2; e, left A2. Nota: A2 and oral parts differ from those of the female in some minor details : in the A2, the exopod is of reduced length ; the mandibular palp has a short and squarish 2nd basal segment, theendopod, of which the first two segments are separated, has remarkably strong setae ; the manducatory plate is of reduced size, but the teeth are strong, they are, however, differently arranged. Mx1 is almost as in the female, the 11 setae on the exopod are stronger ; Mxp is reduced in size, especially the 1st basal segment, which is very short, the 2nd basal segment has a row of teeth like hairs on the basal portion of its internal margin.
|
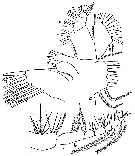 issued from : W. Vervoort in Verh. K. ned. Akad. Wet., Afd. Natuurk., 1951, (Sect. 2) 47 (2). [p.38, Fig.23]. Male: a, left Mx1; b, right Mxp.
|
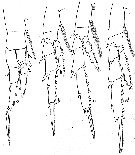 issued from : W. Vervoort in Verh. K. ned. Akad. Wet., Afd. Natuurk., 1951, (Sect. 2) 47 (2). [p.39, Fig.24]. Male: a-d, P1 to P4 (right feet, anterior surface). Nota: P1 to P4 are almost as in the female.
|
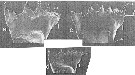 issued from : J. Michels & S.B. Schnack-Schiel in Mar. Biol., 2005, 146. [p.486, Fig.2]. Mandibular gnathobase. a, c: Female (from Weddell and Bellingshausen Seas); . d, Male. a, c: left gnathobase from cranial; b: right gnathobase from distal; V: ventral tooth, C1-C4: central teeth, D1-D3: dorsal teeth, B: dorsal bristle. C4 and dorsal teeth in panel a and ventral tooth in panel c are damaged. Scale bars 0.020 mm.
|
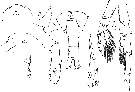 issued from : W. Giesbrecht in Copepoden. Res. voyage du S. Y. Belgica. Rapports scientifiques, Zoologie, 1902. [Taf. I, Figs.1-8]. Female (from Antarctic): 1-2, forehead (dorsal and lateral, respectively); 3, last thoracic segment and urosome (dorsal); 4, last thoracic segment and genital segment (lateral); 5, exopodite 3 of P2; 8, basipodite of P5 (inner margin). Male: 6, exopodite 3 of P4; 7, P5 (anterior).
|
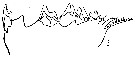 issued from : N.V. Vyshkvartzeva in Issled. Fauny Moreï, 1972, 12 (20). [p.166, Fig.5]. Femele Md: 3, masticatory edge (lateral aspect).
|
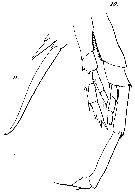 Issued from : G.S. Brady in Rep. Scient. Results Voy. Challenger, Zool., 1883, 8 (23). [Pl. XIV, Figs.10, 11]. Male: 10, P5; 11, terminal spines of one swimming feet.
|
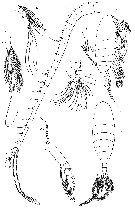 Issued from : G.S. Brady in Rep. Scient. Results Voy. Challenger, Zool., 1883, 8 (23). [Pl. II, Figs. 1-7]. Female: 1- 2, habitus (lateral and dorsal, respectively); 3, A1; 4, endopod of A2; 5, Md; 6, P5 (serratures distorted); 6a, serratures more highly magnified; 7, caudal ramus with setae.
|
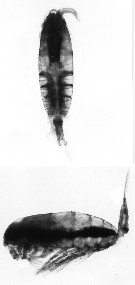 issued from : C. Razouls (pers. coll.). Female (dorsal and lateral) from Kerguelen Islands, 26 October 1995.
|
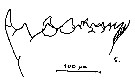 issued from : S.B. Schnack in Crustacean Issue, 1989, 6. [p.144, Fig.7: 5]. 5, Calanus propinquus (from Antarctic): Cutting edge of Md.
|
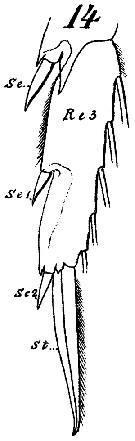 Issued from : W. Giesbrecht in Systematik und Faunistik der Pelagischen Copepoden des Golfes von Neapel und der angrenzenden Meeres-Abschnitte. – Fauna Flora Golf. Neapel, 1892, 19 , Atlas von 54 Tafeln. [Taf. 8, Fig.14]. Female: 14, exopodite 3 of P3 (anterior view).
|
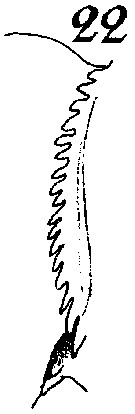 Issued from : W. Giesbrecht in Systematik und Faunistik der Pelagischen Copepoden des Golfes von Neapel und der angrenzenden Meeres-Abschnitte. - Fauna Flora Golf. Neapel, 1892, 19 , Atlas von 54 Tafeln. [Taf. 8, Fig.22]. Female: 22, P5 (inner margin of B1). B1 : c0xa.
|
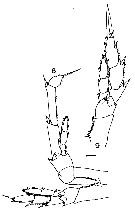 Issued from : J.M. Bradford in N.Z. Oceanogr. Inst., 1971, 206, Part 8, No 59. [p.15, Figs.8, 9]. Male (from 71°15'S - McMurdo Sound, 165°48'E - 179°35'W): 8, P5. Female: 9, P5.
|
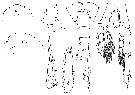 issued from : W. Giesbrecht in Copepoden. Res. voyage du S. Y. Belgica. Rapports scientifiques, Zoologie, 1902. [Taf. I, Figs. 1-8]. Female (S Peter Ist Island): 1, forehead (dorsal); 2, same (lateral); 3, last thoracic segment and urosome; 4, last thoracic segment and genital segment (lateral); 5, exopodal segment 3 of P2; 8, inner margin of basipod segment 1 (= coxa) Male: 6, exopodal segment 3 of P4; 7, P5 (anterior view).
|
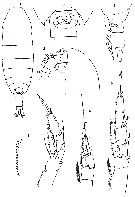 Issued from : O. Tanaka in Spec. Publs. Seto mar. biol. Lab., 10, 1960 [Pl. I]. Female (from 66°05'S-67°03'S, 44°10'E-40°44'E): 1, habitus (dorsal); 2, head (lateral); 3, genital segment (ventral); 4, last thoracic segment and urosome (lateral); 5, P1; 6, P2; 7, P5; 8, inner margin of coxa of P5. Nota: Posterior margin of the last thoracic segment produced triangularly reaching the middle of the genital segment. Proportional lengths of abdominal segments and caudal rami 32 : 19 : 14 : 11 : 24 = 100. Genital segment about as long as wide, produced slightly below. Genital flap squarish. Caudal rami about 2 times as long as wide. Caudal setae are of crimson-red colour. A1 24-segmented, extends to the end of caudal rami by last 2 or 3 segments. Total length of A1 measured 5.45 mm. Remark: Immature specimens of C. propinquus are easily confused with tjhe immatures of C. simillimus.
|
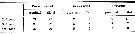 Issued from : O. Tanaka in Spec. Publs. Seto mar. biol. Lab., 10, 1960 [p.11]. Female: The outer marginal spine on the 3rd exopodal segment of the P2 to P4 divides the outer margin in the proportions which differ slightly from those given by Girebrecht and Vervoort, in the table herewith.
|
 Issued from : O. Tanaka in Spec. Publs. Seto mar. biol. Lab., 10, 1960 [p.11]. Female: Proportional lengths of the 3rd exopodal segment and the terminal spine of the swimming legs P1 to P4, in the table herewith.
|
 Issued from : O. Tanaka in Spec. Publs. Seto mar. biol. Lab., 10, 1960 [p.11]. Female: Proportional lengths of segments of A1. Nota: An adult female measuring 5.05 mm had an abnormal structure in the A1. The distal 6 segments were missing The 19th segment had about 15 long setae on the distal margin of the segment. A similar example has been reported by Steuer (1910) in Paracalanus parvus.
|
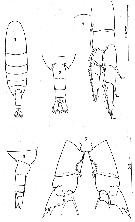 Issued from : C. Séret in Thesis UPMC, Paris 6. 1979 [P. Il]. Female (from off N Kerguelen Is.): 1, habitus (dorsal); 2, last thoracic segment and urosome (dorsal); 3, same (lateral); 4, P1; 5, P5.
|
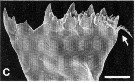 Issued from : T.H.P. Harvey, M.I. Vélez & N.J. Butterfield in PNAS, 109 (5). [p.1591, Fig.2, C]. Gnathal edge of female right mandible of Calanus propinquus; arrow indicates dorsal seta. (Image courtesy of Jan Michels). Nota: The Middle/Late Cambrian copepod-type mandibles are assigned to the coêôd total-group (stem or crown) based on a combination of characters including isometric growth and a dorsal seta. The Deadwood fossils thus extend the record of copepods (broadly defined) back some 190-210 Myr from fragments extracted from a Pennsylvanian (± 303 Ma) bitumen clast (see P.A. Selden & al., 2010); other pre-Holocene records are resticted to the Miocene and Cretaceous (Huys & Boxshall, 1991).
|
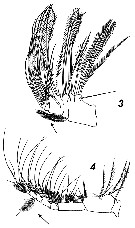 Issued from : V.N. Andronov in Russian Acad. Sci. P.P. Shirshov Inst. Oceanol. Atlantic Branch, Kaliningrad, 2014. [p.40, Fig.10, 3, 4]. Calanus propinquus after Vyshkvartseva, 1977 b . 3, Mx2; 4, Mxp.
|
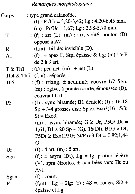 Issued from : C. Razouls in Ann. Inst. océanogr., Paris, 1994, 70 (1). [p.25]. Caractéristiques morphologiques de Calanus propinquus femelle et mâle adultes. Terminologie: A1 = antennules [= antennule]; A2 = antennes [= antenna]; Abd = abdomen [urosome]; art = segment ou article [segment]; B1 = basipodite 1 (= coxa); B2 = basipodite 2 (= basis); biram = biramé [biramous]; Endo = endopodite (rame interne) [inner ramus]; Exo = exopodite (rame externe) [outer ramus]; F = furca (rames caudales) [= caudal rami]; Gén = géniculation [geniculate]; md = mandibule [ mandible]; Mx1 = maxillule (première maxille); Mx2 = maxille (ou 2ème maxille, ou Mxp1: 1er maxillipède) [Maxilla]; Mxp = maxillipède (Mxp2: 2ème maxillipède) [Maxilliped]; o.g = orifice génital ou orifices génitaux) [genital aperture/s]; org.fr = organe frontal [frontal organ]; P = patte natatoire, P1-P5 (de l'avant vers l'arrière) [swimming legs (from anterior to posterior); pl = plumeux (sétules pour une soie) [plumose or setule]; Pr = prosome (partie antérieure du corps jusqu'à l'articulation principale) [Prosome]; R = rostre (extrémité différenciée du front) [Rostrum]; S = soie seta or setae]; Sapp = soie appendiculaire [appendicular seta]; Se = soie externe [outer seta]; Si = soie interne [inner seta]; Sgan = segment anal [anal segment = anal somite]; Sgn = complexe génital ou segment génital [genital segment = genital somite for male or genital double-somite for female]]; Sp = épine [spine]; Spe = épine externe [outer spine]; Spi = épine interne [inner spine]; Spt = épine terminale [terminal spine]; spm = spermathèque [spermatheca]; sp = spinulespin = groupe de spinules [group of spines]; St = soie terminale [terminal seta]; T = front, bord antérieur de la tête [forehead]; Th = segment thoracique [thoracic somite]; unim = uniramé [uniramous]; Ur = urosome (partie postérieure du corps, à partir de l'articulation principale) [Urosome]. Abbréviations et symboles [abbreviations and symbols]: ang= angle [angle], anguleux [angular]; antr = antérieur [anterior]; arr = arrondi [rounded]; asym = asymétrique [asymmetrical]; Avt = vers l'avant [foremost]; Ct = constant [constant]; cyl = cylindrique [cylindrical]; D = en vue dorsale [in dorsal view]; dig = digitiforme [fingerlike]; distal = distal [distal], à l'extrémité [end, tip]; diverg = divergent [divergent]; Dt = côté droit [right side]; drt = rectiligne, droit [straight]; ext = externe [outer, external]; fig = figure [figure]; G = côté gauche [left side]; Gen = géniculation [geniculation, geniculated]; grd = grand [large]; Ht = ver le haut [upstairs]; int = interne [inner, internal, inward]; juv = juvénile (stade copépodite) [copepodite stage]; L = en vue latérale [lateral view]; Lg = longueur (généralement en vue dorsale dans l'axe médian (sauf exception) [Body length]; lg = largeur (en vue dorsale) [wide, broad]; m = mâle [male]; N = naupius [nauplius]; nbx = nombreux [[numerous]; ogiv = ogival [ogival]; part. = partiellement [partially, in part]; Pl., pl. = planche [drawing, figure]; postr = postérieur [posterior]; préh = préhensile [prehensile]; protub = protubérance, proéminence, dilaté [prominence, process]; prox = proximal [proximal]; sym = symétrique [symmetrical]; triang = triangulaire [triangular]; V = en vue ventrale [in ventral view]; ± = plus ou moins [plus or less]; > supérieur à [superior to]; >> = très supérieur à [very highter to]; < = inférieur à [inferior to]; << = très inférieur à [much inferior to].
| | | | | Ref. compl.: | | | Hardy & Gunther, 1935 (1936) (p.123, Rem., distribution charts); Ottestad, 1936 (p.11, 18, 21, 25, vertical and antarctic distribution); Oliveira, 1945 (p.191); Sewell, 1948 (p.516, 548, 565, 569, 572, 574); Baker, 1954 (p.203, 211, fig.5); Fagetti, 1962 (p.6); Brodsky, 1964 (p.105, fig.1, spatial distribution); Murano, 1965 (p.91, fig.2, abundance, geographic distribution); Voronina, 1968 (p.277, Rem.: p.278); 1970 (p.162, spatial distribution); 1972 (p.336, vertical distribution); 1972 a (p.415, vertical distribution); Rudyakov, 1972 (p.886, Table 1, 2, 3: sinking rate); Björnberg, 1973 (p.283, 384); Voronina & Sukhanova, 1976 (1977) (p.614, food composition); Vladimirskaya, 1978 (p.202, vertical distribution, age composition); Arashkevich, 1978 (p.118, Table: diets); Voronina & al., 1978 (p.512, distribution); Ikeda & Hing Fay, 1981 (1982) (p.921, metabolism, ammonia excretion, O:N ratio); Ikeda & Mitchell, 1982 (p.283, metabolism); Biggs, 1982 (p.55, Table 2: NH4 excretion, O2 consumption); Schnack, 1983 (p.63, feeding); De Decker, 1984 (p.315); Schnack & al., 1985 (p.256, fig.4); Bamstedt & Tande, 1985 (p.259, Table 2: literature data respiration & escretion); Hubold, 1985 (p.43, Table 1, predation by fish); Hopkins, 1985 (p.197, Table 1, gut contents); Dearborn & al., 1986 (p.1, predation by benthic star); Zmijewska, 1987 (tab.2a); Hopkins & Torres, 1988 (tab.1); Ward, 1989 (tab.2); Ferrari & Dearborn, 1989 (p.1315, predator); Atkinson & al., 1990 (p.1213, tab.1); Tucker & Burton, 1990 (p.591, tab.1, fig.4, seasonal, spatial variations); Drits & al., 1990 (p.740, diel rhythm feeding); Atkinson, 1991 (p.79, antarctic zonation, seasonal change, vertical distribution); Santos & Ramirez, 1991 (p.79, 80, 82, 83); Rau & al., 1991 (p.1, isotopic forms vs feeding); Schnack-Schiel & al., 1991 (p.17, life cycle); Conover & Huntley, 1991 (p.1, Table 2, 5, 7, 9, 10, 13, polar seas comparison); Atkinson & al., 1992 a (p.49, feeding rates, vertical migration); Siegel & al., 1992 (p.18, tab.34); Huntley & Lopez, 1992 (p.201, Table A1, B1, egg-adult weight, temperature-dependent production, growth rate); Vuorinen & Bonsdorff, 1992 (p.679, dispersion index); Kurbjeweit & al., 1993 (p.255, fig.2); Hagen & al., 1993 (p.135, lipid storage); Bathmann & al., 1993 (p.333, chart distribution, sex ratio, grazing); Drits & al., 1993 (p.13, feeding, metabolism, composition); Marin & Schnack-Schiel, 1993 (p.35, vertical distribution); Zmijewska, 1993 (p.73, seasonal and vertical distributions, life history); Kosobokova, 1994 (p.219, Reproduction); Hosie & Cochran, 1994 (p.21); Schnack-Schiel & Hagen, 1994 (p.1543, life cycle); Atkinson, 1994 a (p.1, feeding); Metz & Schnack-Schiel, 1995 (p.71, feeding); Donnelly & al., 1994 (p.171, chemical composition); Kattner & al., 1994 (p.637, lipid composition); Atkinson & Shreeve, 1995 (p.1291, vertical distribution, grazing); Ward & al., 1995 (p.195, abundance, biomass, vertical distribution); Knox & al., 1996 (tab.1); Atkinson, 1996 (p.85, feeding); Atkinson & al. 1996 (p.195, feeding v.s. phytoplankton bloom); Hagen & Schnack-Schiel, 1996 (p.139, seasonal lipid, maturity); Froneman & al., 1996 (p.15, nutrition, grazing); Pakhomov & McQuaid, 1996 (p.271, abundance, ditribution, seabirds); Zmijewska & al., 1997 (p.127); Errhif & al., 1997 (p.422); Beaumont & Hosie, 1997 (p.121, spatial distribution); Fransz & Gonzalez, 1997 (p.395, weight-length, biomass v.s. N-S transect); Vuorinen & al., 1997 (p.280); Spiridonov & Kosobokova, 1997 (p.233, spatial distribution, vertical migration); Froneman & al., 1997 (p.201, abundance, grazing); Elwers & Dahms, 1998 (p.150, 151); Ward & Shreeve, 1998 (p.142, fig.1, egg hatching vs temperature); Atkinson, 1998 (p.289, Table 1, biological data); Voronina, 1998 (p.375, biomass); Atkinson & al., 1999 (p.63, Krill-copepod interactions, fig.7: diel migration); Tirelli & Mayzaud, 1999 (p.197, gut evacuation); Atkinson & Sinclair, 2000 (p.46, 50, 51, 55, zonal distribution); Razouls & al., 2000 (p.343, tab. 3, 5, Appendix); Pakhomov & al., 2000 (p.1663, Table 1, 2, transect Cape Town-SANAE antarctic base); Voronina & al., 2001 (p.401); Chiba & al., 2001 (p.95, tab.4, 7); Pasternak Schnack-Schiel, 2001 (p.25); Li & al., 2001 (p.894, tab.1); Ward & al., 2002 (p.2183, tab.2); Voronina, 2002 (p.68, abundance vs stations); Cabal & al., 2002 (p.869, Table 1, abundance); Ward & al., 2003 (p.121, tab.4); Kahle & Zauke, 2003 (p.409, metals concentration); Hunt, 2004 (p.1, 74, fig. 4.7, Rem.: p.97, fig.5.10: seasonal abundance); Miller C.B., 2005 (p.219, Rem.); Fuentes & Schnack-Schiel, 2005 (p.253); Calbet & al., 2005 (p.1195, tab.3); Ward & al., 2006 (p.83: tab.4); Schultes & al., 2006 (p.21, fig.1); Hunt & Hosie, 2006 (p.1182, seasonal succession, indicator); Tsujimoto & al., 2006 (p.140, Table1); Kattner & al., 2007 (p.1628, Table 1); Deibel & Daly, 2007 (p.271, Table 6a, 6b, 7a, Fig.5, Rem.: Antarctic polynyas); Schnack-Schiel & al., 2008 (p.1045: Tab.2); Kiko & al., 2008 (p.1000, Table 3); Ward & al., 2008 (p.241, Tabls, Appendix II ); Takahashi & al., 2010 (p.317, Table 3, 4); Sartoris & al., 2010 (p.1860, fig.1, Rem.: cation percentages in hemolymph); Swadling & al., 2010 (p.887, Table 2, 3, A1, fig.6, abundance, indicator species); Hsiao & al., 2010 (p.179, Table III, trace metal concentration); Yang & al., 2011 (p.1065, fig.2b); Yang & al., 2011 a (p.921, Table 2, inter-annual variation 1999-2006); Marrari & al., 2011 (p.1599, table 2, abundance, composition, interannual variation); 2011 a (p.1614, Table 2, Fig.2A, 5, 6); Swadling & al., 2011 (p.118, Table 2, figs. 5, 6, 7, interannual abundance); Ward & al., 2012 (p.78, Table A1, B1, C1, abundance, weight); Tarling & al., 2012 (p.222, Table 1, 3, seasonal biomass); Pond, 2012 (p.443, Rem.: p.447, wax esters); Makabe & al., 2012 (p.432, Table II, abundance vs mesh-size used); Michels & al., 2012 (p.369, Table 1, fig.12, occurrence frequency, vertical distribution); Harvey T.H.P. & al., 2012 (p.1589, fig.2: Md vs Cambrian age); Yang G. & al., 2013 (p.1701, fig.4, Table 2, feeding); Schründer & al., 2013 (p.1, sodium/ammonium and ph effects in the hemolymph); Ojima & al., 2013 (p.1293, Table 2, 3, abundance); Lee D.B. & al., 2013 (p.1215, Table 1, 2: abundance, composition); Hernandez-Leon & al., 2013 (p.196, fig.8, vertical distribution, grazing, ETS activity); Kouwenberg & al., 2014 (p.290, biogeography, Map 3); Fierro Gonzalvez, 2014 (p.1, Tab. 3, 5, occurrence, abundance); Baumgartner & Tarrant, 2017 (p.387, diapause, Rem.); Record & al., 2018 (p.2238, Table 1: diapause);
Xavier & al., 2020 (p.15, fig., Rem.). | | | | NZ: | 5 | | |
|
Carte de distribution de Calanus propinquus par zones géographiques
|
| | | | | | 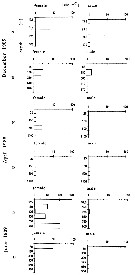 Issued from : M.I. Zmijewska in Oceanologia, 1993, 35. [Fig. 3.2]. Issued from : M.I. Zmijewska in Oceanologia, 1993, 35. [Fig. 3.2].
Diel changes in abundance distribution (ind./ m2) of Calanus propinquus (from Croker Passage, Antarctic Peninsula) adult female and male during 3 austral season.
N = night; D = day. |
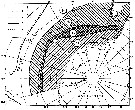 Issued from : K.A. Brodsky in Inf. Bull. Soviet antarct. Exped., 1. [p.108, Fig.1]. Issued from : K.A. Brodsky in Inf. Bull. Soviet antarct. Exped., 1. [p.108, Fig.1].
1 - Antarctic convergence; 2 - northern boundary of range of Calanus propinquus ; 3 - boundaries of range of Calanus simillimus; 4 - southern boundary of tropical zone.
Nota: The Antarctic zone, with a northern boundary at the northernmost limit of the distribution of C. propinquus (Region D). The antarctic convergence passes very close to the northern boundary of the antarctic plankton zone, coinciding in those places where the temperature gradient is very great and deviating in places where temperature gradients are smaller.
See Nota in Calanus simillimus. |
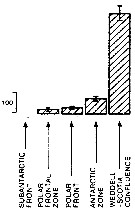 Issued from : A. Atkinson in Mar. Biol., 1991, 109. [p.82, Fig.2] Issued from : A. Atkinson in Mar. Biol., 1991, 109. [p.82, Fig.2]
Calanus propinquus. Mean abundance (nos./1000 m) of vertical haul) in top 1 000 m within five water types. bars represent standard errors of means, calculated from assumed Poisson distribution.
Estimated contributions to total copepod biomass in study area: 3 %.
Nota: Water types:
1- Either in sub-Antarctic zone or in vicinity of subantarctic front.
2- Within polar frontal zone.
3- In vicinity of polar front.
4- Within Antarctic zone.
5- Within Weddell Sea or in Weddell-Scotia confluence. |
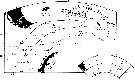 Issued from : A. Atkinson in Mar. Biol., 1991, 109. [p.80, Fig.1]. Issued from : A. Atkinson in Mar. Biol., 1991, 109. [p.80, Fig.1].
Positions of 72 stations sampled in Scotia Sea. The Scotia Sea, containing majority of stations, is bordered on east by a chain of oceanic islands and on west by Drake Passage (between South America and the Antarctic Peninsula.
Mean positions of oceanic fronts, and zones which they separate are drawn from Gordon (1967).
SAF: subantarctic front.
PFZ: polar frontal zone.
PF: polar front.
AZ: Antarctic zone.
WSC: Weddell-Scotia confluence. |
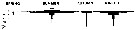 Issued from : A. Atkinson in Mar. Biol., 1991, 109. [p.82, Fig.3]. Issued from : A. Atkinson in Mar. Biol., 1991, 109. [p.82, Fig.3].
Calanus propinquus. Mean vertical distribution during four seasons. Values are numbers/250 m of vertical haul. |
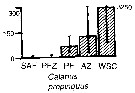 Issued from : A. Atkinson & J.D. Sinclair in Polar Biol., 2000, 23. [p.50, Fig.3] Issued from : A. Atkinson & J.D. Sinclair in Polar Biol., 2000, 23. [p.50, Fig.3]
Calanus propinquus from Scotia Sea.
Median and interquartile ranges of copepods (nos /m2) in the five water zones; from north to south these are SAF Subantractic Front area, PFZ Polar frontal Zone, PF Polar Front area, AZ Antarctic Zone, WSC Weddell-Scotia Confluence area/ East Wind Drift.
Numbers on the plots are upper interquartiles where these could not be scaled. |
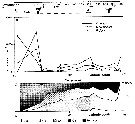 Issued from : V.A. Spiridonov & K.N. Kosobokova in Mar. Ecol. Prog. Ser., 1997, 157. [p.236, Fig.2 (modified)]. Issued from : V.A. Spiridonov & K.N. Kosobokova in Mar. Ecol. Prog. Ser., 1997, 157. [p.236, Fig.2 (modified)].
Abundance of Calanoides acutus, Calanus propinquus and Rhincalanus giga (A) along the Greenwich transect in the upper 0 to 500 m water layer from subantarctic to Antarctic continent (stations 571 to 606), and stage composition C2 to C5 (B), in early to mid-winter.
PF: Polar front; ACC: Antarctic Circumpolar Current; WF: Weddell Front; MR: Maud Rise; CWB: Continental Water Boundary. |
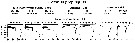 Issued from : S.B. Schnack-Schiel & W. Hagen in J. Plankton Res., 1994, 16 (11). [p.1551, Fig.6]. Issued from : S.B. Schnack-Schiel & W. Hagen in J. Plankton Res., 1994, 16 (11). [p.1551, Fig.6].
Vertical distribution of C. propinquus from eastern Weddell Sea, as a percent of total numbers and temperature profile within the upper 1000 m. |
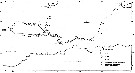 Issued from : M. Murano inThe Ocean Res. Inst., Univ. Tokyo, 1965. Coll. Rep., 1964, Vol.3. [p.101, Fig.2]. Issued from : M. Murano inThe Ocean Res. Inst., Univ. Tokyo, 1965. Coll. Rep., 1964, Vol.3. [p.101, Fig.2].
The quantitative distribution of Calanus propinquus Brady, gathered by NORPAC net, hauls vertically up to the water surface from a depth of 200 m between December, 1961 and February, 1962. |
 issued from A. de C. Baker in 'Discovery' Rep., 1954, 27. [p.215, Fig.5]. issued from A. de C. Baker in 'Discovery' Rep., 1954, 27. [p.215, Fig.5].
Occurrence of Calanus propinquus in all longitudes around Antarctic zone of the Southern Ocean.
The percentage frequency of occurrence in samples taken within every 20° of longitude.
Nota: During the 'Discovery' investigations some thousands of plankton samples have been taken from stations spread over the whole of the Southern Ocean at all seasons of the year, the majority south of the Antarctic Convergence. An arbitrary selection of samples has been made from hauls between the surface and a depth of 250 m, which means that they have been taken from within the limits of the Antarctic surface water.
Compare with Calanus simillimus. |
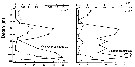 Issued from : P. Ward, A. Atkinson, A.W.A. Murray, A.G. Wood, R. Williams & S. Poulet in Polar Biol., 1995, 15. [p.200, Fig.3]. Issued from : P. Ward, A. Atkinson, A.W.A. Murray, A.G. Wood, R. Williams & S. Poulet in Polar Biol., 1995, 15. [p.200, Fig.3].
Abundance and biomass (g dry mass/m3) profiles for the shelf station (54°48'S, 38°15'W) in January 1990.
Values on the horizontal axes at the base represent abundance and the one above biomass. Solid line = midday haul; hatched line = midnight haul. |
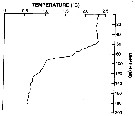 Issued from : P. Ward, A. Atkinson, A.W.A. Murray, A.G. Wood, R. Williams & S. Poulet in Polar Biol., 1995, 15. [p.198, Fig.1, A (modified C.R.)]. Issued from : P. Ward, A. Atkinson, A.W.A. Murray, A.G. Wood, R. Williams & S. Poulet in Polar Biol., 1995, 15. [p.198, Fig.1, A (modified C.R.)].
Temperature profile for the shelf station at Bird Island, South Georgia (54°48'S, 38°15'W) in January 1990. |
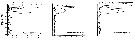 Issued from : P. Ward, A. Atkinson, A.W.A. Murray, A.G. Wood, R. Williams & S. Poulet in Polar Biol., 1995, 15. [p.202, Fig.4, A]. Issued from : P. Ward, A. Atkinson, A.W.A. Murray, A.G. Wood, R. Williams & S. Poulet in Polar Biol., 1995, 15. [p.202, Fig.4, A].
Abundance (10/m3) and biomass (g dry mass/m3) profiles at the oceanic station from the shelf break in water 4000 m deep off Bird Island, South Georgia (53°04'S, 39°51'W) in January 1990.
Values on the horizontal axes at the base of each profile represent abundance and the one above biomass. Solid line = midday haul; hatched line = midnight haul. |
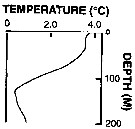 Issued from : P. Ward, A. Atkinson, A.W.A. Murray, A.G. Wood, R. Williams & S. Poulet in Polar Biol., 1995, 15. [p.198, Fig.1, B (modified C.R.)]. Issued from : P. Ward, A. Atkinson, A.W.A. Murray, A.G. Wood, R. Williams & S. Poulet in Polar Biol., 1995, 15. [p.198, Fig.1, B (modified C.R.)].
Profile temperature-depth at the oceanic stations from the shelf break in water 4000 m deep off Bird Island, South Georgia, in January 1990. |
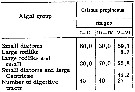 Issued from : N.M. Voronina & I.N. Sukhanova in Oceanology, 1977, 16 (6). [p.615]. Issued from : N.M. Voronina & I.N. Sukhanova in Oceanology, 1977, 16 (6). [p.615].
Frequency of encounter of various groups of diatom algae in the character of leading objects in the food pellet (% of number of digestive tracts with food).
Data from stations between 57°S-69°43'S.
The animals utilize all diatom species from 5 to 300 µm in size, the only animal food found there were tintinnids and radiolarians in negligible quantity. |
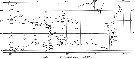 Issued from : N.M. Voronina in Antarctic Ecology, M.W. Holdgate (edit.), 1970, I. [p.170, Fig.7]. Issued from : N.M. Voronina in Antarctic Ecology, M.W. Holdgate (edit.), 1970, I. [p.170, Fig.7].
The northern boundaries of distribution of three copepod species in the 500-0 m layer in the second part of the summer. |
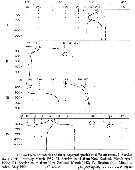 Issued from : N.M. Voronina in Antarctic Ecology, M.W. Holdgate (edit.), 1970, I. [p.169, Fig.6]. Issued from : N.M. Voronina in Antarctic Ecology, M.W. Holdgate (edit.), 1970, I. [p.169, Fig.6].
The northern boundaries of distribution of three copepod species in the 500-0 m layer at different times. |
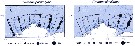 Issued from : K.M. Swadling, So. Kawaguchi & G.W. Hosie in Deep-Sea Research II, 2010, 57. [p.897, Fig.6 (continued)]. Issued from : K.M. Swadling, So. Kawaguchi & G.W. Hosie in Deep-Sea Research II, 2010, 57. [p.897, Fig.6 (continued)].
Distribution of indicator species Calanoides propinquus and Calanus simillimus from the BROKE-West survey (southwest Indian Ocean) during January-February 2006.
Sampling with a RMT1 net (mesh aperture: 315 µm), oblque tow from the surface to 200 m.
The survey area was located predominantly within the seasonal ice zone, and in the month prior to the survey there was considerable ice coverage over the western section but none over the east. |
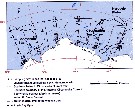 Issued from : K.M. Swadling, So. Kawaguchi & G.W. Hosie in Deep-Sea Research II, 2010, 57. [p.888, Fig.1]. Issued from : K.M. Swadling, So. Kawaguchi & G.W. Hosie in Deep-Sea Research II, 2010, 57. [p.888, Fig.1].
Map showing sampling sites along six north-south transects.Indicates the locations of the southern Antarctic Circumpolar Current front and the southern boundary of the Antarctic Circumpolar Current. Data from Orsi et al. (1995) and Williams et al. (2010).
The Antarctic coastline data is from the Antarctic Digital Database version 4.0c Scientific Committee on Antarctic Research 1993-2003.
Thin lines indicate bathymetric contours (IOC and IHO and BODC, Centenary Edition of the GEBCO Digital Atlas 2003). |
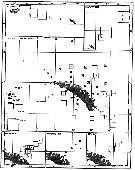 Issued from : A.C. Hardy & E.R. Gunther in Discovery Reports, 1935 (1936), 11. [p.131, Fig.60]. Issued from : A.C. Hardy & E.R. Gunther in Discovery Reports, 1935 (1936), 11. [p.131, Fig.60].
Charts showing the distribution of Calanus propinquus in the upper layers of waters at stations in the 1926-7 surveys around South Georgia.
The squares represent the average numbers per 50 m vertical haul from 250 m (or less at shallow-water stations) to the surface with N 70 V nets. |
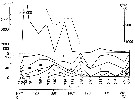 Issued from : N.M. Voronina in Oceanology, 2002, 42 (1). [p.71, Fig.3]. Issued from : N.M. Voronina in Oceanology, 2002, 42 (1). [p.71, Fig.3].
Variation in the abundance and age structure of the Calanus propinquus population along the transect (67°S). Roman numerals: copepodite stages.
Dashed line: salp biomass per 1 m2 within the 0 to 500 m layer. |
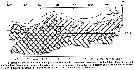 Issued from : N.M. Voronina in Oceanology, 2002, 42 (1). [p.69, Fig.1]. Issued from : N.M. Voronina in Oceanology, 2002, 42 (1). [p.69, Fig.1].
Hydrological characteristics at the transect from Adelaide Island (Antarctic Peninsula) to the Balleny Island along 67°S during the period from February 23 to March 30, 1992.
Over the greater part of the transect, the vertical temperature distribution was typical of the summer season.
The area studied was located entirely within the waters of the Antarctic vertical structure and covered four segments: The low-latitude ACPC waters (stations 694-733), the high-latitude ACC waters (stations 775, 791 and 793), the mixed waters of both types within the Ross Sea (stations 746-771 and 788), and the shelf waters represented by only a single station on its slope (station 779).
The boundary between the low-latitude and mixed waters of the high latitude modification runs along the pronounced secondary frontal zone in the area of station 739, whereas that between the mixed and properly high-latitude water modifications runs near station 778 (see in Maslennikov, 1992). |
 Issued from : N.M. Voronina in Oceanology, 2002, 42 (1). [p.71]. Issued from : N.M. Voronina in Oceanology, 2002, 42 (1). [p.71].
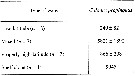
Average abundance (and its error) of the mass population within different waters (ind./m2 within the 0 to 1500 m layer). n: number of stations. |
 Issued from : D.W. Pond in J. Plankton Res., 2012, 34 (6). [p.447, Fig.3 b] Issued from : D.W. Pond in J. Plankton Res., 2012, 34 (6). [p.447, Fig.3 b]
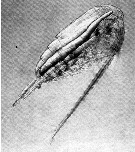
Female Calanus propinquus oil sac containing triacylglycerols. No image of a stage CV is available, but note that these often contain amounts of lipid in their oil sac that are comparable to CV Calanoides acutus.
Nota: The solid-liquid phase transitions of lipids are a factor regulating the buoancy of the copepods. These phase transitions are controlled in relation to the physical environment, through the selective accumulation of specific lipids with optimum levels of unsaturation. The necessity to control buoyancy and maintain an optimum depth is a fundamental evolutionary force, driving anatomical, biochemical and behavioural adaptations within the aquatic realm. It is hypothesized that each species adjusts the amount, composition and anatomical location of lipids, to maximize fitness according to the preferred habitat and life history traits |
 Issued from : C. Séret in Thesis 3ème Cycle, UPMC, Paris 6. 1979, Annexe. [p.21]. Issued from : C. Séret in Thesis 3ème Cycle, UPMC, Paris 6. 1979, Annexe. [p.21].
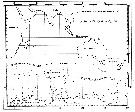
Geographical occurrences of Calanus propinquus in the Indian Ocean and Antarctic zone. [after publications from: Brady, 1883, 1918; Thompson, 1900; Wolfenden, 1908, 1911; With , 1915; Rosendorn, 1917; Farran, 1929; Sewell, 1929, 1947; Brady & Gunther, 1935; Steuer, 1929, 1392, 1933; Ommaney, 1936; Vervoort, 1957; Tanaka, 1960; Brodsky, 1964; Seno, 1966; Andrews, 1966; Grice & Hulsemann, 1967; Seno, 1966; Frost & Fleminger, 1968; Voronina, 1970; Zverva, 1972]. |
 Issued from : A.C. Hardy & E.R. Gunther in Discovery Reports, 1935 (1936), 11. [p.134, Fig.62]. Issued from : A.C. Hardy & E.R. Gunther in Discovery Reports, 1935 (1936), 11. [p.134, Fig.62].
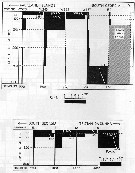
Vertical distribution of Calanus propinquus at stations between Falkland Islands and South Georgia February 1927 and between South Georgia and Tristan da Cunha February 1926.
The scale represents the numbers per 50 m vertical haul taken by a series of closing N 70 V nets.
Horizontal broke lines show the ranges of these vertical hauls. |
 Issued from : A.C. Hardy & E.R. Gunther in Discovery Reports, 1935 (1936), 11. [p.7, Fig.4]. Issued from : A.C. Hardy & E.R. Gunther in Discovery Reports, 1935 (1936), 11. [p.7, Fig.4].
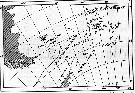
Chart showing the line of the Antarctic Convergence, separating the Antarctic and the sub-Antarctic Zones, and the course of the two surface currents with influence South Georgia within the Antartic Zone. |
 Issued from : J. Michels, S.B. Schnack-Schiel, A. Pasternak, E. Mizdalski, E. Isla & D. Gerdes in Polar Biol., 2012, 35. [p.381, Fig.12 (part., copepodid stages omitted.)]. Issued from : J. Michels, S.B. Schnack-Schiel, A. Pasternak, E. Mizdalski, E. Isla & D. Gerdes in Polar Biol., 2012, 35. [p.381, Fig.12 (part., copepodid stages omitted.)].
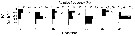
Vertical distribution of the adult females of Calanus propinquus from East Weddell Sea shelf (70°48.558'S, 10°43.698'W) between 9 and 28 December 2003. The water depth at the sampling spots varied between 438 and 484 m.
The white dots represent the weighted mean depths. |
 Issued from : P. Ottestad in On Antarctic Copepods from the ''Norvegia'' Expedition 1930-1931.Scient. Results Norw. Antarct. Exped., 1936, 15. [p.19, Table 7, 8]. Issued from : P. Ottestad in On Antarctic Copepods from the ''Norvegia'' Expedition 1930-1931.Scient. Results Norw. Antarct. Exped., 1936, 15. [p.19, Table 7, 8].
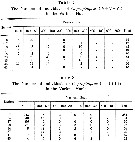
I + II = III and IV + V + VI = copepodid stages; depth in meters. Vertical hauls with standard plankton net (Rustad, 1930).
Nota: In the area between Kerguelen and the Ross Sea (Stations 6 to 18) and also at Station 28 in Bellinghausen Sea the greatest quantities of the 3 oldest stages were found above 200 m. At station 43 in the Scotia Sea they were not found above 100 m. Of the 3 youngest stages the greatest quantities have been taken above 100 m, and only very few individuals were taken below 200 m. On the whole the vertical distribution corresponds well with the distribution of C. acutus. |
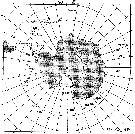 Issued from : P. Ottestad in On Antarctic Copepods from the ''Norvegia'' Expedition 1930-1931. Scient. Results Norw. Antarct. Exped., 1936, 15. [p.7, Fig.1]. Issued from : P. Ottestad in On Antarctic Copepods from the ''Norvegia'' Expedition 1930-1931. Scient. Results Norw. Antarct. Exped., 1936, 15. [p.7, Fig.1].
The position of the biological stations of ''Norvegica'' 1930-1931. |
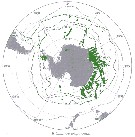 Issued from : J.H.M. Kouwenberg, C. Razouls & N. Desreumaux in Biogeographic Atlas of the Southern Ocean, Scient. Comm. Antarct. Res., Cambridge, 2014, 6.6. [p.291, Map 3]. Issued from : J.H.M. Kouwenberg, C. Razouls & N. Desreumaux in Biogeographic Atlas of the Southern Ocean, Scient. Comm. Antarct. Res., Cambridge, 2014, 6.6. [p.291, Map 3].
Distribution of Calanus propinquus. |
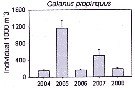 Issued from : K.M. Swadling, F. Penot, C. Vallet & al. in Polar Sci., 2011, 5. [p.125, Fig.5]. Issued from : K.M. Swadling, F. Penot, C. Vallet & al. in Polar Sci., 2011, 5. [p.125, Fig.5].
Mean abundance (ind. per 1000 m3) and standard errors of Calanus propinquus collected each summer (January), 2004-2008 in the region covered the area from 139°E to 145°E from Terre Adélie to the Mertz Glacier Tongue.
Nota: The entire region sampled during 2004 to 2008 surveys was south of the continental slope and was under the influence of the westward flowing Antarctic Coastal Current. Macrozooplankton were collected by oblique tows of a Bongo net (500 µm mesh aperture) |
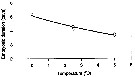 Issued from : P. Ward & R. Shreeve in Polar Biol., 1998, 19. [p.143, Fig.1]. Issued from : P. Ward & R. Shreeve in Polar Biol., 1998, 19. [p.143, Fig.1].
Time to 50% hatching versus temperature (Belehradek function relating embryonic duration: D : days; a = 5077; alpha = - 29.14; b fixed as - 2.05) to temperature (T°C) fitted to the data for Calanus propinquus from South Georgia (53.5° S, 37° W).
Prosome length = 4.23 mm (± 0.15); egg diameter: inner membrane: 155 µm (± 7), outer membrane : 260 µm (± 15). |
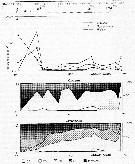 Issued from : V.A. Spiridonov & K.N. Kosobokova in Mar. Ecol. Prog. Ser., 1997, 157. [p.236, Fig.2]. Issued from : V.A. Spiridonov & K.N. Kosobokova in Mar. Ecol. Prog. Ser., 1997, 157. [p.236, Fig.2].
Abundance of Rhincalanus gigas and Calanoides acutus, Calanus propinquus (A) and stage composition of C. acutus (B) and C. propinquus (C) populations along the Greenwich transect in the upper 0 to 500 m water layer. PF: Polar frint; ACC: Antarctic Circumpolar Current; WF: Weddell Fronf; MR: Maud Rise; CWB: Continental Water Boundary. |
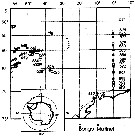 Issued from : V.A. Spiridonov & K.N. Kosobokova in Mar. Ecol. Prog. Ser., 1997, 157. [p.236, Fig.2]. Issued from : V.A. Spiridonov & K.N. Kosobokova in Mar. Ecol. Prog. Ser., 1997, 157. [p.236, Fig.2].
Stations at which zooplankton sampling was performed in the Weddell Sea and adjacent areas during the Winter Weddell Gyre study 1992 (in June-July 1992). |
 Issued from : H. Saito & A. Tsuda in Deep-Sea Res. I, 47. [p.2146, Table I]. Issued from : H. Saito & A. Tsuda in Deep-Sea Res. I, 47. [p.2146, Table I].
Egg diameter and prosome length (PL) of females of Calanus propinquus after Kosobokova, 1994.
Nota: Compare with N. cristatus, N. tonsus and N. flemingeri and others species in genus Calanus. |
| | | | Loc: | | | Antarct. (Amundsen Sea, King George Is., Potter Cove, Gerlache & Bransfield Straits, Bellingshausen Sea, S Peter 1st Island, Peninsula, South Georgia, Scotia Sea, Weddell Sea, off Halley Bay, Lazarev Sea, SW & SE Atlant., Prydz Bay, Lützow-Holm Bay, Indian, Dumont d'Urville Sea, SW & SE Pacif. SW, SE, McMurdo Sound), sub-Antarct. (SW Atlant., Indian, Davis station-Gardner Is., Pacif. (SW, SE), off S South Africa, Namibia, ? G. of Guinea, Bermuda (in Wilson, 1936 c, p.89), Caribbean (in Wilson, 1942 a, p.173), Argentina, Rio de Janeiro, Chile (Valparaiso) | | | | N: | 195 | | | | Lg.: | | | (10) F: 5,5-5; (25) F: 6-4,95; M: 5,3-4,75; (31) F: 5,3-4,8; M: 4,95-4,85; (33) F: 4,9-5,3; M: 5,2; (35) F: 5,5-5,3; (66) F: 5,54-5,5; (114) F: 5,2; (196) F: 5,1; 4,95; ? (322) F: 2,25; M: 2 [Mar del Plata]; {F: 4,80-6,00; M: 4,75-5,30}8984 (n = 3; SD = 0.0572). The form from Mar del Plata of very different body size excluded.
The mean female size is 5.256 mm (n = 15; SD = 0.3200), and the mean male size is 5.10 mm (n = 5; SD = 0.2424). The size ratio (male : female) is 0.
Prosome: (1204) F: 4.23 mm (± 0.15). (1205) F: 4.29 mm (SD = 0.046) | | | | Rem.: | Epipélagique, parfois plus profonde.
Sampling depth (Antarct., sub-Antarct.) : 0-1000 m.
Confondu parfois avec Calanus simillimus, mais de taille plus grande.
Les localisations tropicales ou subtropicales fournies par Wilson (1942 a, p.173) semblent douteuses et ne sont pas reportées dans la matrice, de même que la signalisation en Méditerranée (Malte) par Thompson (1888 d (p.139), bien que deux espèces (Ctenocalanus citer et Spinocalanus terranovae) connues seulement en Antarctique viennent récemment d'y être observées (off Malte SE, bassin Levantin NE);
Ramirez (1966) indique des tailles plus conformes à celles de C. simillimus.
Voir aussi les remarques en anglais | | | Dernière mise à jour : 17/06/2021 | |
|
|
 Toute utilisation de ce site pour une publication sera mentionnée avec la référence suivante : Toute utilisation de ce site pour une publication sera mentionnée avec la référence suivante :
Razouls C., Desreumaux N., Kouwenberg J. et de Bovée F., 2005-2026. - Biodiversité des Copépodes planctoniques marins (morphologie, répartition géographique et données biologiques). Sorbonne Université, CNRS. Disponible sur http://copepodes.obs-banyuls.fr [Accédé le 10 juin 2026] © copyright 2005-2026 Sorbonne Université, CNRS
|
|
|
|




;)
;)
;)
;)
;)
;)
;)
;)
;)
;)
;)
;)
;)
;)
;)
;)
;)
;)
;)
;)
;)
;)
;)
;)
;)
;)
;)
;)
;)
;)
;)
;)
;)
;)

;)
;)
;)
;)
;)
;)
;)
;)
;)
;)
;)
;)
;)
;)
;)
;)
;)
;)
;)
;)
;)
;)
;)
;)
;)
;)
;)
;)
;)
;)
;)
;)
;)
;)
;)
;)