|
|
 |
Fiche d'espèce de Copépode |
|
|
Calanoida ( Ordre ) |
|
|
|
Calanoidea ( Superfamille ) |
|
|
|
Calanidae ( Famille ) |
|
|
|
Nannocalanus ( Genre ) |
|
|
| |
Nannocalanus minor (Claus, 1863) (F,M) | |
| | | | | | | Syn.: | Cetochilus minor Claus, 1863 (p.172);
Calanus valgus Brady, 1883 (p.33, figs.F,M); T. Scott, 1894 b (p.24);
Calanus minor : Giesbrecht, 1892 (p.90, 128, 770, figs.F,M); Giesbrecht & Schmeil, 1898 (p.15, Rem. F,M); Wheeler, 1901 (p.165, figs.F); Cleve, 1904 a (p.186); Esterly, 1905 (p.126, Rem.F,M); Carl, 1907 (p.16); A. Scott, 1909 (p.7); Wolfenden, 1911 (p.193); Sewell, 1912 (p.353, 354: Rem.F); 1914 a (p.192, Rem.); Pesta, 1913 (p.30); Sewell, 1914 a (p.192); Pesta, 1920 (p.496); Farran, 1926 (p.228); Rose, 1925 (p.151); 1927, p.50, Rem.); Farran, 1929 (p.207, 214); Wilson, 1932 a (p.22, figs.F); Dakin & Colefax, 1933 (p.203); Rose, 1933 a (p.63, figs.F,M); Hardy & Gunther, 1935 (1936) (p.123, Rem.); Farran, 1936 a (p.77); Mori, 1937 (1964) (p.17, figs.F,M); Wilson, 1942 a (p.173); Oliveira, 1945 (p.191); Tanaka, 1956 (p.258); Chiba & al., 1957 (p.306); 1957 a (p.11); Yamazi, 1958 (p.146); Deevey, 1960 (p.5, Table II, annual abundance) ; Furnestin, 1960 (p.167, fig.F); Gaudy, 1962 (p.93, 99, Rem.: p.101, Pl.III: juv., Tableau 3: development); Ahlstrom & Thrailkill, 1963 (p.57, Table 5, abundance); Shmeleva, 1963 (p.141); V.N. Greze, 1963 a (tabl.2); Shmeleva, 1965 b (p.1350, lengths-volume-weight relation); Pavlova, 1966 (p.43); Furuhashi, 1966 a (p.295, vertical distribution in Kuroshio region, Table 10); Ehrhardt, 1967 (p.737, geographic distribution), Rem.); Delalo, 1968 (p.137); Berdugo & Kimor, 1968 (p.447); Champalbert, 1969 a (p.626); Moraitou-Apostolopoulou, 1969 (p.2); Dowidar & El-Maghraby, 1970 (p.267); Salah, 1971 (p.319); Brodsky, 1972 (p.256); Apostolopoulou, 1972 (p.327, 332); Gaudy, 1972 (p.175, 209, figs.20-24, annual cycle); Bradford & Jillett, 1974 (p.6); Greenwood, 1976 (p.6, fig.M); Brodsky, 1972 (1975) (p.9, 73, 89, figs.); Vyshkvartzeva, 1976 (p.14); 1977 a (p.97, figs.); Binet, 1979 (p.400); Dawson & Knatz, 1980 (p.5, figs.F,M); Vaissière & Séguin, 1980 (p.23, tab.2); Vives, 1982 (p.290); Rudyakov, 1982 (p.208, Table 2); Kovalev & Shmeleva, 1982 (p.82); Greze & al., 1983 (p.17, Rem/.: p.24); Dessier, 1983 (p.89, Tableau 1, 2, Rem., %); Tremblay & Anderson, 1984 (p.4, Rem.); Binet, 1984 (tab.3); 1985 (p.85, tab.3); Petipa & Borichenko, 1985 (tab.2); Jansa, 1985 (p.108, Tabl.I, , II, III, IV, V); Wishner & Allison, 1986 (tab.2); Madhupratap & Haridas, 1986 (p.105, tab.1); Dessier & Donguy, 1987 (p.14393, abundance vs. years 1979-1984); Dessier, 1988 (tabl.1); Cervantes-Duarte & Hernandez-Trujillo, 1989 (tab.3); Nishida, 1989 (p.173, table 2, no M dorsal hump); Echelman & Fishelson, 1990 a (tab.2); Hirakawa & al., 1990 (tab.3); Othman & al., 1990 (p.561, 563, Table 1); Hattori, 1991 (tab.1, Appendix); Samba Diouf, 1991 (p.103, tab.1); Yoo, 1991 (tab.1); Seguin & al., 1993 (p.23); Suarez Morales, 1994 b (tab.1); Palomares Garcia & Vera, 1995 (tab.1); Hirakawa & al., 1995 (tab.2); Kotani & al., 1996 (tab.2); Park & Choi, 1997 (Appendix); Padmavati & al., 1998 (p.349); Gilabert & Moreno, 1998 (tab.1, 2); Mauchline, 1998 (tab.23, 30, 47, 53, 58); Suarez-Morales, 1998 (p.345, Table 1); Suarez-Morales & Gasca, 1998 a (p108);Smith S. & al., 1998 (p.2369, Table 6, moonsoon effects); Dolganova & al., 1999 (p.13, tab.1); Suarez-Morales & Gasca, 2000 (1247, tab.1); Lopez-Salgado & al., 2000 (tab.1); Moraitou-Apostolopoulou & al., 2000 (tab.I); Madhupratap & al., 2001 (p. 1345, vertical distribution vs. O2, figs.4, 5: clusters, Rem.: p.1353); Holmes, 2001 (p.37); Zerouali & Melhaoui, 2002 (p.91, Tableau I); Miller C.B., 2005 (p.363, fig.16.16, Rem.); Maiphae & Sa-ardrit, 2011 (p.641, Table 2); Selifonova, 2011 a (p.77, Table 1, alien species in Black Sea);
Calanus (Nannocalanus) minor : Fleminger, 1967 a (tabl.1); Hernandez-Trujillo, 1991 (1993) (tab.I);
Calanus caroli : Wolfenden, 1905 (p.994);
Undinula caroli : Sewell, 1912 (p.356);
Canthocalanus minor : Brodsky, 1972 (1975) (p.116,118) | | | | Ref.: | | | Sars, 1925 (p.9); Rose, 1929 (p.8); Sewell, 1929 (p.20, Rem.: 2 forms); Dakin & Colefax, 1940 (p.87, figs.F,M); Lysholm & al., 1945 (p.7); Vervoort, 1946 (p.26, Rem.); Sewell, 1947 (p.14, figs.M, Rem: 2 forms); 1951 (p.363, 390, figs.F,M, Rem.: parasites); C.B. Wilson, 1950 (p.268); Vervoort, 1946 (p.26, Rem.); Marques, 1958 (p.205); Tanaka, 1960 (p.14); Grice, 1962 (p.177, figs.F,M, Rem.); Brodsky, 1962 c (p.98, figs.F,M); Vervoort, 1963 b (p.80, Rem.); Tanaka, 1964 (p.5); Chen & Zhang, 1965 (p.30, figs.F,M); Owre & Foyo, 1967 (p.31, figs.F,M); Vilela, 1968 (p.8); Vinogradov, 1968 (1970) (p.78); Vidal, 1968 (p.15, figs.F,M); Pallares, 1968 (p.246, figs.F,M); Park, 1968 (p.532, Rem.); Ramirez, 1969 (p.39, figs.F, Rem.); Corral Estrada, 1970 (p.70, Rem.); Bradford, 1971 b (p.15, fig.F, Rem.); Grice, 1972 (p.177, figs.F,M); Kos, 1972 (Vol. I, figs.F, M, Rem.); Marques, 1974 (p.11); 1976 (p.985); Arnaud & al., 1980 (p.213, gut structure); Björnberg & al., 1981 (p.616, figs.F,M); Zheng Zhong & al., 1984 (1989) (p.227, figs.F,M); Alvarez-Marques, 1984 (p.114, figs.F,M, annual abundance); Sazhina, 1985 (p.30, figs.N); Fleminger, 1985 (p.276, 285, Table 1, 4, fig.M, Rem.: A1); Bradford, 1988 (p.76, 79); Suarez & Gasca, 1991 (tab.2); Bradford-Grieve, 1994 (p.39, figs.F,M, fig.98); Bucklin & al., 1996 (p.285); Chihara & Murano, 1997 (p.737, Pl.64: F,M); Bucklin & Wiebe, 1998 (p.383, Rem.: molecular genetic diversity); Lapernat, 1999 (p.10); Bradford-Grieve & al., 1999 (p.877, 906, 907, figs.F,M); Barthélémy, 1999 a (p.10, Fig.14, B-D, F); Andronov, 2001 (p.277, figs.F,M, Rem.); Bucklin & al., 2003 (p.335, tab.2, fig. 4, Biomol.); Conway & al., 2003 (p.148, figs.F,M, Rem.); G. Harding, 2004 (p.5, figs.F,M); Conway, 2006 (p.8: copepodite stages 1-6, Rem.) ; Andronov & al., 2006 (p.2, Redescr.F,M; figs.F,M, Rem.); Avancini & al., 2006 (p.61, Pl. 30, figs.F,M, Rem.); Vives & Shmeleva, 2007 (p.899, figs.F,M, Rem.); Phukham, 2008 (p.113, figs.F,M); Blanco-Bercial & al., 2014 (p.5: Rem.: problematical for barcoding); Fornshell & Ferrari, 2014 (p.110, fig.7: Von Vaupel Klein's organ). | 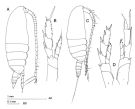 issued from : J.M. Bradford-Grieve in The Marine Fauna of New Zealand: Pelagic Calanoid Copepoda. National Institute of Water and Atmospheric Research (NIWA). New Zealand Oceanographic Institute Memoir, 102, 1994. [p.40, Fig.15]. Female: A, habitus (right lateral sidel); B, P5. Male: C, habitus (right lateral side); D, P5 (I = left leg; r = right leg).
|
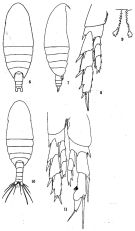 issued from: Q.-c Chen & S.-z. Zhang in Studia Marina Sinica, 1965, 7. [Pl.3, 6-11]. Female (E China Sea): 6, habitus (dorsal); 7, idem (lateral right side); 8, P5 (anterior); 9, serrate inner margin of 1st basipod of P5. Male: 10, habitus (dorsal); 11, P5 (anterior).
|
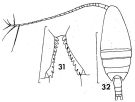 issued from : F.C. Ramirez in Contr. Inst. Biol. mar., Buenos Aires, 1969, 98. [p.42, Lam. VI, figs.31, 32]. As Nannocalanus minor var. major. Female (from off Mar del Plata): 31, internal margin of basipodal segment 1 of P5; 32, habitus (dorsal). Scale bars in mm: 0.1 (31); 1 (32). Nota: Basipodal segment 1 of P5 with 10 and 12 teeth on the internal margin.
|
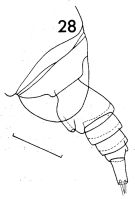 issued from : F.C. Ramirez in Contr. Inst. Biol. mar., Buenos Aires, 1969, 98. [p.40, Lam. V, fig.28]. As Nannocalanus minor var. major. Female (from off Mar del Plata): 28, last thoracic segment and urosome (lateral left side). Scale bar in mm: 0.2.
|
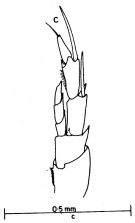 issued from : J.G. Greenwood in Proc. R. Soc. Qd, 1976, 87. [p.9, Fig.3, c]. As Calanus minor. Male (from Moreton Bay, E Australia): c, P5.
|
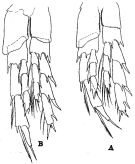 issued from : R.B.S. Sewell in The John Murray Expedition, 1933-34, Scientific Reports, VIII (1), 1947. [p.15, Fig.1]. Male (from Arabian Sea): A,, P5 forma minor; B, P5 forma major. Nota: Two distinct size groups in the same sample. Forma major Female: length ranging from 1.800-2.133 mm (average 1.974 mm); Male: 1.666-1.800 (average 1.734). Forma minor Female: 1.538-1.817 (average 1.726); Male 1.533-1.666 (average 1.597). The proportional lengths of the various segments of A1 show slight differences in the two forms of the male, very similar in the two forms female.
|
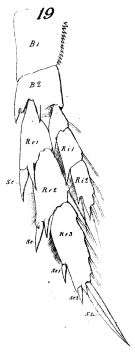 issued from : W. Giesbrecht in Fauna Flora Golf. Neapel, 1892, 19. [Taf.8, Fig.19]. As Calanus minor. Female; 19, P5 (anterior surface)
|
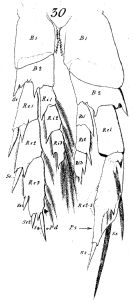 issued from : W. Giesbrecht in Fauna Flora Golf. Neapel, 1892, 19. [Taf.8, Fig.30]. As Calanus minor. Male; 30, P5 (anterior surface)
|
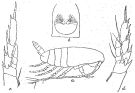 issued from : R.B.S. Sewell in Mem. Indian Mus., 1929, X. [p.22, Fig.2]. As forma major.
Female (from Nankauri Harbour: Nicobar Is.): a, habitus (lateral right side); b, genital segment (ventral); c, P2; d, P5.
|
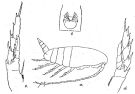 issued from : R.B.S. Sewell in Mem. Indian Mus., 1929, X. [p.23, Fig.3]. As forma minor.
Female (from Nankauri Harbour: Nicobar Is.): a, habitus (lateral right side); b, genital segment (ventral); c, P2; d, P5.
|
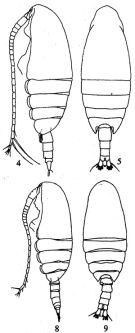 issued from : V.N. Andronov in Zoosystematica Rossica, 2001, 9 (2). [p.279, Figs.4-5, 8-9]. Female (from SE Pacific): 4, habitus (lateral left side); 5, idem (dorsal). Male: 8, habitus (lateral left side); 9, idem (dorsal).
|
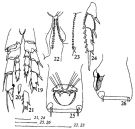 issued from : V.N. Andronov in Zoosystematica Rossica, 2001, 9 (2). [p.280, Figs.10-18]. Female: 23, P5 (inner edge of basipodite 1); 24, exopodiite of P2; 25-26, genital somite (ventral and left side). Male: 19, P5; 20-21, left and right endopodite 3 of P5 (another male); 22, P5 (inner edge of basipodite 1).
|
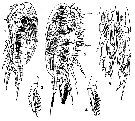 issued from : T. Mori in The pelagic Copepoda from the neighbouring waters of Japan, 1937 (1964). [Pl.5, Figs.1-5]. As Calanus minor. Female: 2, habitus (lateral); 3, P5; 4, P2. Male: 1, habitus (lateral); 5, P5.
|
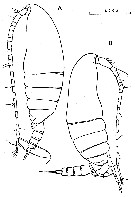 issued from : C. Razouls in Th. Doc. Etat Fac. Sc. Paris VI, 1972, Annexe. [Fig.22]. Female (from Banyuls, G. of Lion): A, habitus (lateral). Male: B, habitus (lateral).
|
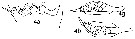 issued from : N.V. Vyshkvartzeva in Issled. Fauny Moreï, 1972, 12 (20). [p.168, Fig.7, 4a, 4b,4g). As Calanus minor. Female Md (masticatory edge): 4a, lateral view; 4b, left Md (above view); 4g, right Md (above view).
|
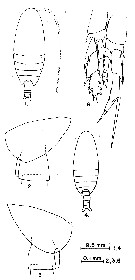 issued from : G.D. Grice in Fish. Bull. Fish and Wildl. Ser., 1962, 61. [p.176, Pl.1, Fig.1-6]. Female (from equatorial Pacific): 1, habitus (dorsal); 2, posterior part of thorax and genital segment (left side); 3, same (right side). Male: 4, habitus (dorsal); 6, P5.
|
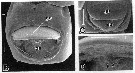 issued from : R.-M. Barthélémy in These Doct. Univ. Provence (Aix-Marseille I), 1999. [Fig.14, B-D]. Female (from 39°45'S, 177°54.6'E): B, external ventral view genital double-somite; C, external view genital area (female insiminated: sp): Note the seminal products (sp) lifting up the operculum and hidding the gonoporal plates; D, detail of the atrial cavity ceiling showing gonopores (arrowheads) go = genital operculum. Scale bars: 0.100 mm (B); 0.050 mm (C, D).
|
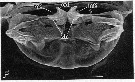 issued from : R.-M. Barthélémy in These Doct. Univ. Provence (Aix-Marseille I), 1999. [Fig.14, F]. Female: internal genital area. m2 = egg-laying ducts muscles; ed = egg-laying duct; sh = shell ducts. Scale bar: 0.050 mm.
|
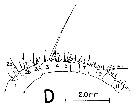 issued from : A. Fleminger in Mar. Biol., 1985, 88. [p.284, Fig.6, D]. Male : Left A1 proximal segments (ventral view); Nota: see remarks in Calanus s.l. pacificus californicus (Fleminger, 1985, p.275) concerning the dimorphism in the female A1.
|
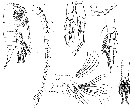 Issued from : G.S. Brady in Rep. Scient. Results Voy. Challenger, Zool., 1883, 8 (23). [Pl. III, Figs.1-7]. As Calanus valgus. Female: 1, habitus (lateral); 2, A1; 3, Md; 4, P4. Male: 5, P5; 6, right P5 (in flexed position); 7, urosome.
|
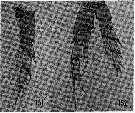 issued from : H.B. Owre & M. Foyo in Fauna Caribaea, 1967, 1, Part 1: Copepoda. [p.31, Figs. 151-152]. Female (Florida Current): 151, P5. Male: 152, P5.
|
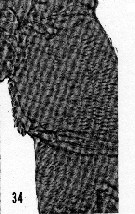 issued from : H.B. Owre & M. Foyo in Fauna Caribaea, 1, Crustacea, 1: Copepoda. Copepods of the Florida Current. 1967. [p.15, Fig.34]. Male: 34, bqsipodite 1 of P5.
|
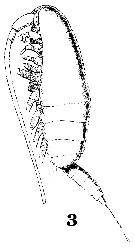 Issued from : W. Giesbrecht in Systematik und Faunistik der Pelagischen Copepoden des Golfes von Neapel und der angrenzenden Meeres-Abschnitte. - Fauna Flora Golf. Neapel, 1892, 19 , Atlas von 54 Tafeln. [Taf.6, Fig.3]. As Calanus minor. Male: 3, habitus (lateral).
|
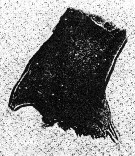 issued from : P.E. Lapernat & C. Razouls in Vie Milieu, 2002, 52 (1). [p.20, Pl. I, fig.3]. Masticatory edge of Md gnathobase female (from off Malta, Mediterranean Sea).
|
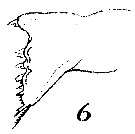 Issued from : W. Giesbrecht in Systematik und Faunistik der Pelagischen Copepoden des Golfes von Neapel und der angrenzenden Meeres-Abschnitte. - Fauna Flora Golf. Neapel, 1892, 19 , Atlas von 54 Tafeln. [Taf. 7, Fig.6]. As Calanus minor. Female: 6, masticatory edge of Md (posterior view).
|
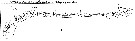 Issued from : W. Giesbrecht in Systematik und Faunistik der Pelagischen Copepoden des Golfes von Neapel und der angrenzenden Meeres-Abschnitte. – Fauna Flora Golf. Neapel, 1892, 19 , Atlas von 54 Tafeln. [Taf. 8, Fig.1]. As Calanus minor. Male: 1, A1 (ventral view).
|
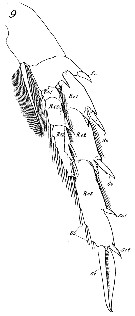 Issued from : W. Giesbrecht in Systematik und Faunistik der Pelagischen Copepoden des Golfes von Neapel und der angrenzenden Meeres-Abschnitte. – Fauna Flora Golf. Neapel, 1892, 19 , Atlas von 54 Tafeln. [Taf. 8, Fig.9]. As Calanus minor. Female: 9, P3 (anterior view).
|
 issued from : R. Gaudy in Rev. Trav. St. Mar. End., Bull. 27 (42). [p.126, Tableau 3]. Identification of copepodids stages Nannocalanus minor. A: Stage; B: number of swimming legs; C: number of thoracic segments; D: number of abdominal segments; E, Size.
|
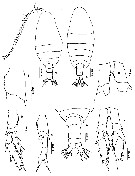 issued from : N. Phukham in Species diversity of calanoid copepods in Thai waters, Andaman Sea (Master of Science, Univ. Bangkok). 2008. [p.196, Fig.70]. Female (from W Malay Peninsula): a, habitus (dorsal); b, coxa of P5; c, P5. Male: d, habitus (dorsal); e, urosome (dorsal); f, coxa of right P5; h, left P5. Body length after the drawings: F = 1.733 mm; M = 1.460 mm.
|
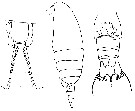 Issued from : F. Alvarez-Marques in Rev. Biol. Univ. Oviedo, 1984, 2. [p.116, Pl. II, Figs.1, 3, 5]. Female (from off Gijon, Bay of Biscay): 1, habitus (lateral); 3, urosome (ventral) with spermatheca; 5, inner margin of coxa of P5.
|
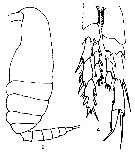 Issued from : F. Alvarez-Marques in Rev. Biol. Univ. Oviedo, 1984, 2. [p.116, Pl. II, Figs.2, 4]. Male: 2, habitus (lateral); 4, P5.
|
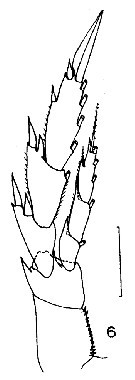 Issued from : J.M. Bradford in N.Z. Oceanogr. Inst., 1971, 206, Part 8, No 59. [p.15, Fig.6]. Female (from 78°26'S, 174°50'W): 6, P5. Scale bar: 100 µm. Nota: Specimen damaged without doubt a stray into Antarctic environment.
|
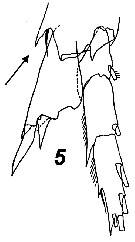 Issued from : V.N. Andronov in Russian Acad. Sci. P.P. Shirshov Inst. Oceanol. Atlantic Branch, Kaliningrad, 2014. [p.41, Fig.11, 5]. Nannocalanus minor after Brodsky & al., 1983. 5, P5 female (part., the arrow indicates the setule on the basis outer distal edge)
|
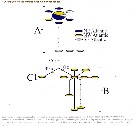 Issued from : L. Blanco-bercial, A. Cornils, N. Copley & A. Bucklin in PLoS Currents, 2014, Version 1. åp.7]. For the authors: Nannocalanus minor barcodes form a cluster comprising 3 clades in both the tree-based and TCS analysis. The sequence variation did not show any geographical pattern; all 3 clades contained sequences from the NW Atlantic and in some cases were found in the same sample. Cluster A included a number of individuals with identical sequences collected from the NE and SE Atlantic. Within each clade, individuals differed by < 1.5% on average, differences ranged from 9.2-14.3%. Morphological analyses of 2 females from Clade A and B, respectively indicate different numbers of teeth on the inner edge of the basipodite 1 of P5: the Clade A individual showed 11 denticles, compared to 16 for Clade B. Individual variability is known to be high for this character, and either of the 2 described Nannocalanus species may exhibit 16 teeth. However, 11 teeth on the P5 basipodite 1 is outside the known range for this character for N. minor sensu stricto, suggesting potential reproductive isolation among the 3 Clades, which may be sympatric, cryptic species.
|
 Issued from M. Rose in Résult. Camp. scient. Prince Albert I, 1929, 78, p.8-9. Remarques concernant Nannocalanus minor identifié aux cours des campagnes de 1904, 1905, 1908, 1909, 1910, 1911, 1912, 1913 et 1914.
|
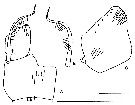 Issued from : J.A. Fornshell & F.D. Ferrari in Crustaceana, 2014, 87 (1). [p.110, Fig.1, A-C]. Von Vaupel Klein's organ on right endopodal segment 1 and right basal seta of P1. A, anterior, distal up; B, right basal seta; C, proximal endopodal segment (showing, denticles, pores and ventral seta noted Scale line; short = 25 µm; long = 95 µm. The Von Vaupel Klein organ is an association (srtucture) of the distal seta from basis and the proximal endopodal segment of P1. This structure shows significant variability among many gymnoplean copepods, in the shape of the distodorsal corner of the proximal endopodal segment, presence and location of denticles on the anterior face of the segment, presence and size of denticles along the distal margin of the segment , number of pores on the segment, shape of the seta that originates on the basis, and the morphology of the basis at the origin of the seta. The function of this complex structure is not known.
|
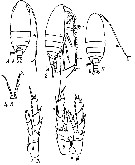 Issued from : M.C. Kos in Field guide for plankton. Zool Institute USSR Acad., Vol. I, 1972. As Calanus (Nannocalanus) minor. After Brodsky, 1962. Female: 1-2, habitus (dorsal and lateral, respectively); 3, P5; 4, inner margin of basipodites of P5. Male: 5, habitus (dorsal); 6, P5.
| | | | | Ref. compl.: | | | Ref. compl.: Wilson, 1942 a (p.173); Sewell, 1948 (p.322, 357, 381, 390, 395, 403, 407, 412, 414, 422, 433, 442, 450, 453, 455, 456, 459, 463, 467, 468, 484, 487, 489, 491, 493, 513); C.B. Wilson, 1950 (p.268); Krishnaswamy, 1953 (p.107); ? King & Hida, 1955 (p.11); Duran, 1955 (p.52); Kott, 1957 (p.5, Rem.: p.16); Zoppi, 1961 (p.219); Fagetti, 1962 (p.7); Ganapati & Shanthakumari, 1962 (p.7, 15); Cervigon, 1962 (p.181, tables: abundance distribution); Grice & Hart, 1962 (p.287, table 3); Grice, 1963 a (p.495); Björnberg, 1963 (p.11, Rem.); Bary, 1963 a (p.1519, Table 1); 1964 (p.183, T-S diagram-occurrences); Unterüberbacher, 1964 (p.14, Rem.); De Decker, 1964 (p.16, 23, 30); De Decker & Mombeck, 1964 (p.13); Anraku & Azeta, 1965 (p.13, Table 2, fish predator); Grice & Hulsemann, 1965 (p.223); Mullin, 1966 (p.546, Table I, III, diet); Neto & Paiva, 1966 (p.17, Table III); Mazza, 1966 (p.69); 1967 (p.357: Rem., 399, fig.76); Grice & Hulsemann, 1967 (p.13); De Decker, 1968 (p.45); Evans, 1968 (p.13); Séguin, 1968 (p.488); Vinogradov, 1968 (1970) (p.78, 79, 80, 83, 91, 268, 269, 277); Samyshev, 1970 (p.32, nutrition); Park, 1970 (p.474); Morris, 1970 (p.2300); Shih & al., 1971 (p.37); Deevey, 1971 (p.224); Timonin, 1971 (p.281, trophic group); Subbaraju & Krishnamurphy, 1972 (p.25, 26 ); Binet & al., 1972 (p.73); Boucher & Thiriot, 1972 (p.47, Tableau 4); Razouls S., 1972 b (p.2, respiration); Razouls C., 1972 (p.94); Roe, 1972 (p.277, tabl.1, tabl.2); 1972 a (p.319); Bainbridge, 1972 (p.61, Appendix Table I: vertical distribution vs day/night, Table II: %, Table IV); Heinrich, 1973 (p.95); Björnberg, 1973 (p.283, 292, 388); Harding, 1974 (p.141, tab.3, gut contents); Ikeda, 1974 (p.1, respiration, ammonia excretion rate); Corral Estrada & Pereiro Muños, 1974 (tab.I); S. Razouls, 1974 (147, oxygen rate); Arashkevich, 1975 (p.351, digestion time); Vives & al., 1975 (p.35, tab.II, III, IV); Timonin, 1976 (p.79, vertical distribution); Tranter, 1977 (p.596); Deevey & Brooks, 1977 (p.256, Table 2, Station "S"); Carter, 1977 (1978) (p.35); Grindley, 1977 (p.341, Table 2); Timonin & Voronina, 1977 (p.283); Arashkevich, 1978 (p.118, Table: diets); Dessier, 1979 (p.131, 204); Hayward, 1980 (p.295, Table 2, vertical distribution, feeding); Andronov & Maigret, 1980 (p.71); Brenning, 1981 (p.1, spatial distribution, T-S diagram, Rem.); Turner & Dagg, 1983 (p.16); Guangshan & Honglin, 1984 (p.118, tab.); Cummings, 1984 (p.163, Table 2); De Decker, 1984 (p.315); Sameoto, 1984 (p.767, vertical migration); Scotto di Carlo & al., 1984 (p.1042); Regner, 1985 (p.11, Rem.: p.22); Brenning, 1985 a (p.23, 24, Table 2); Kinzer & Schulz, 1985 (tab.4); Brinton & al., 1986 (p.228, Table 1); Chen Y.-Q., 1986 (p.205, Table 1: abundance %, Table 2: vertical distribution); M. Lefèvre, 1986 (p.33); Boucher & al., 1987 (p.133, spatial distribution/physical structure); Ambler & Miller, 1987 (tab.2, 3, 4, 5); Jimenez-Perez & Lara-Lara, 1988; Wiebe & al., 1988 (tab.7); Lozano Soldevilla & al., 1988 (p.57); Timonin, 1990 (p.479); Kouwenberg & Razouls, 1990 (p.23, climatic change); Madhupratap & Haridas, 1990 (p.305, fig.6 (as Calanopia minor [lapsus calami): vertical distribution night/day; fig.7 (as Calanus minor: cluster); Heinrich, 1990 (p.16); Suarez & al., 1990 (tab.2); Suarez, 1992 (App.1); Ashjian & Wishner, 1993 (p.483, abundance, species group distributions); Hays & al., 1994 (tab.1); Verheye & al., 1994 (p.155); Kouwenberg, 1994 (tab.1); Heinrich, 1995 (tab.1); Shih & Young, 1995 (p.68); Padmavati & Goswami, 1996 a (p.85, fig.2, 3, Table 4, vertical distribution); Errhif & al., 1997 (p.422); Go & al., 1997 (tab.1); Siokou-Frangou, 1997 (tab.1); Suarez-Morales & Gasca, 1997 (p.1525); Timonin, 1997 (p.83, Rem.); Hure & Krsinic, 1998 (p.17, 99); Alvarez-Cadena & al., 1998 (tab.1,2,3,4); Hsieh & Chiu, 1998 (tab.2); Kouwenberg, 1998 (p.203, seasonal variation, fig.3: global change); Wong & al, 1998 (tab.2); Noda & al., 1998 (p.55, Table 3, occurrence); Stephen, 1998 (p.339, chart); Bucklin, 1998 (p.78, genetic types I, II, III, molecular analysis in the Gulf Stream and Sargasso Sea); Hernandez-Trujillo, 1999 (p.284, tab.1); Lavaniegos & Gonzalez-Navarro, 1999 (p.239, Appx.1); Lopes & al., 1999 (p.215, tab.1); Neumann-Leitao & al., 1999 (p.153, tab.2); Onishchik, 1999 (p.76, figs.2, 5); Lapernat, 2000 (tabl.3, 4); Razouls & al., 2000 (p.343, Appendix); Fernandez-Alamo & al., 2000 (p.1139, Appendix); Seridji & Hafferssas, 2000 (tab.1); d'Elbée, 2001 (tabl.1); Lapernat & Razouls, 2001 (tab.1); Rebstock, 2001 (tab.2); 2002 (p.71, Table 3, 5, 6, Fig.2, climatic variability); Lo & al., 2001 (1139, tab.I); Sameoto & al., 2002 (p.13); Beaugrand & al., 2002 (p.1692); Beaugrand & al., 2002 (p.179, figs.5, 6); Osore & al., 2003 (p.69); Hwang & al., 2003 (p.193, tab.2); Bode & al., 2003 (p.85, Table 1, abundance); Shimode & Shirayama, 2004 (tab.2); Hsiao & al., 2004 (p.325, tab.1); Hsieh & al. 2004 (p.397,tab. 1); Rezai & al., 2004 (p.490, tab.2); Daly Yahia & al., 2004 (p.366, fig.1, tab.1); Lan & al., 2004 (p.332, tab.1, tab.2); Lo & al., 2004 (p.218, tab.1, fig.6); Fernandez de Puelles & al., 2004 (p.654, fig.7); Pusch & al., 2004 (251, tab.3); Kang & al., 2004 (p.1524); Gallienne & al., 2004 (p.5, tab.3); CPR, 2004 (p.57, fig.166); Yin & al., 2004 (p.3); Lo & al., 2004 (p.89, tab.1); Obuid Allah & al., 2005 (p.123, occurrence % vs metal contamination); Shimode & al., 2005 (p.113 + poster); Dias & Bonecker, 2005 (p.100 + poster); Souissi & al., 2005 (p.161); Berasategui & al., 2005 (p.313, fig.2); Smith & Madhupratap, 2005 (p.214, tab.4,5); Prusova & Smith, 2005 (p.76); Zuo & al., 2006 (p.159, tab.1, 3, abundance, fig.8: stations group); Isari & al., 2006 (p.241, tab.II); Hwang & al., 2006 (p.943, tab.I); Dias & Araujo, 2006 (p.32, Rem., chart); Lopez-Ibarra & Palomares-Garcia, 2006 (p.63, Tabl. 1, seasonal abundance vs El-Niño); Rakhesh & al., 2006 (p.93, Table 2, spatial distribution); Lavaniegos & Jiménez-Pérez, 2006 (p.148, tab.2, Rem.); Mackas & al., 2006 (L22S07, Table 2); Hwang & al., 2007 (p.23); Fernandez de Puelles & al., 2007 (p.348); Cornils & al., 2007 (p.278, Table 2); Guglielmo & al., 2007 (p.747, Table 5); Valdés & al., 2007 (p.103: tab.1); Busatto, 2007 (p.26, Tab.3); Khelifi-Touhami & al., 2007 (p.327, Table 1); Jitlang & al., 2008 (p.65, Table 1); Cabal & al., 2008 (289, Table 1); Lopez Ibarra, 2008 (p.1, Table 1, fig.11: abundance); McKinnon & al., 2008 (p.843: Table.1); Neumann-Leitao & al., 2008 (p.799: Tab.II, fig.6); Morales-Ramirez & Suarez-Morales, 2008 (p.513, 518); Fernandes, 2008 (p.465, Tabl.2); Ayon & al., 2008 (p.238, Table 4: Peruvian samples); Muelbert & al., 2008 (p.1662, Table 1); Gaard & al., 2008 (p.59, Table 1, N Mid-Atlantic Ridge); Raybaud & al., 2008 (p.1765, Table A1); Wishner & al., 2008 (p.163, Table 2, fig.8, vertical zonation-oxycline); Lan Y.C. & al., 2008 (p.61, Table 1, % vs stations); Tseng L.-C. & al., 2008 (p.153, Table 2, fig.5, occurrence vs geographic distribution, indicator species); Tseng L.-C. & al., 2008 (p.46, table 2, abundance vs moonsons); Pagano, 2009 (p.116); C.-Y. Lee & al., 2009 (p.151, Tab.2); Galbraith, 2009 (pers. comm.); Miyashita & al., 2009 (p.815, Tabl.II); Skovgaard & Salomonsen, 2009 (p.425, Table 2, as Nanocalanus minor); Tseng & al., 2009 (p.327, fig.5, feeding); W Zhang & al., 2009 (p.261, table 2); Lan Y.-C. & al., 2009 (p.1, Table 2, % vs hydrogaphic conditions); C.E. Morales & al., 2010 (p.158, Table 1); Brugnano & al., 2010 (p.312, Table 2, 3, fig.8); Drira & al., 2010 (p.145, Tanl.2); Williamson & McGowan, 2010 (p.273, Table 3, Pacific central gyres: N and S); Hernandez-Trujillo & al., 2010 (p.913, Table 2); Cornils & al., 2010 (p.2076, Table 3); Schnack-Schiel & al., 2010 (p.2064, Table 2: E Atlantic subtropical/tropical); Hidalgo & al., 2010 (p.2089, Table 2); Dias & al., 2010 (p.230, Table 1); Mazzocchi & Di Capua, 2010 (p.424); Medellin-Mora & Navas S., 2010 (p.265, Tab. 2); Xu & Gao, 2011 (p.514, figs.3, 4, Table 2: optimal salinity); Nowaczyk & al;, 2011 (p.2159, Table 2); Hsiao S.H. & al., 2011 (p.475, Appendix I); Tutasi & al., 2011 (p.791, Table 2, abundance distribution vs La Niña event); Tseng L.-C. & al., 2011 (p.47, Table 2, occurrences vs mesh sizes); Kâ & Hwang, 2011 (p.155, Table 3: occurrence %); Hsiao & al., 2011 (p.317, Table 2, indicator of seasonal change); Pillai H.U.K. & al., 2011 (p.239, Table 3, vertical distribution); Mazzocchi & al., 2011 (p.1163, Table II, fig.6, long-term time-series 1984-2006); Isari & al., 2011 (p.51, Table 2, abundance vs distribution); Mazzocchi & al., 2012 (p.135, annual abundance 1984-2006); Shiganova & al., 2012 (p.61, Table 4); Glushko & Lidvanov, 2012 (p.138, Tableau 1); Uysal & Shmeleva, 2012 (p.909, Table I); Salah S. & al., 2012 (p.155, Tableau 1); Zizah & al., 2012 (p.79, Tableau I, Rem.: p.86); Miloslavic & al., 2012 (p.165, Table 2, transect distribution); Jose & al., 2012 (p.20, fig.3 a, b, c: % vs monsoon); Lavaniegos & al., 2012 (p. 11, Appendix); Dorgham & al., 2012 (p.473, Table 3: abundance %); Jang M.-C & al., 2012 (p.37, abundance and seasonal distribution); Tseng & al., 2012 (p.621, Table 3: abundance); Belmonte & al., 2013 (p.222, Table 2, abundance vs stations); Hidalgo & al., 2012 (p.134, Table 2); Teuber & al., 2013 (p.28, Table 1, respiration rates); Palomares-Garcia & al., 2013 (p.1009, Table I, abundance vs environmental factors); in CalCOFI regional list (MDO, Nov. 2013; M. Ohman, comm. pers.); Tachibana & al., 2013 (p.545, Table 1, seasonal change 2006-2008); Tseng & al., 2013 (p.507, seasonal abundance); Rakhesh & al., 2013 (p.7, Table 1, abundance vs stations); Jagadeesan & al., 2013 (p.27, Table 3, seasonal distribution); Bode M. & al., 2013 (p.1, Table 1, 3, respiration rate & ETS activity); Hirai & al., 2013 (p.1, Table I, molecular marker); Schukat & al., 2013 (p.1, Table 1, 2, fig.2, respiration, ingestion); Peijnenburg & Goetze, 2013 (p.2765, genetic data); Mendoza Portillo, 2013 (p.37: Fig.7, seasonal dominance); Tseng & al., 2013 a (p.1, Table 3, 4, abundance); Varadharajan & Soundarapandian, 2013 (p.2: as Nanaocalanus, occurrence vs stations); Lidvanov & al., 2013 (p.290, Table 2, % composition); Hwang & al., 2014 (p.43, Appendix A: seasonal abundance); Fernandez de Puelles & al., 2014 (p.82, Table 3, seasonal abundance); Bonecker & a., 2014 (p.445, Table II: frequency, horizontal & vertical distributions); Bode & al., 2014 (p.1, fig.4, 5, 10, 11, abundance vs long-term 2005-2011); Lopez-Ibarra & al., 2014 (p.453, fig.6, biogeographical affinity); Mazzocchi & al., 2014 (p.64, Table 3, 4, 5, spatial & seasonal composition %); Zaafa & al., 2014 (p.67, Table I, occurrence): Fierro Gonzalvez, 2014 (p.1, Tab. 3, 5, occurrence, abundance); Dias & al., 2015 (p.483, Table 2, abundance, biomass, production, Table 4: % vs. season); Nakajima & al., 2015 (p.19, Table 3: abundance); Rojas-Herrera & al., 2016 (p.40, Table 2: temporal abundance); Zakaria & al., 2016 (p.1, Table 1, 3, 4); Ben Ltaief & al., 2017 (p.1, Table III, Summer relative abundance); Benedetti & al., 2016 (p.159, Table I, fig.1, functional characters); Jerez-Guerrero & al., 2017 (p.1046, Table 1: temporal occurrence); El Arraj & al., 2017 (p.272, table 2, spatial distribution); Benedetti & al., 2018 (p.1, Fig.2: ecological functional group); Belmonte, 2018 (p.273, Table I: Italian zones); Chaouadi & Hafferssas, 2018 (p.913, Table II: occurrence); Abo-Taleb & Gharib, 2018 (p.139, Table 5, p.146, occurrence %); Dias & al., 2018 (p.1, Tables 2, 4, 5: vertical distribution, abundance vs. season); Dias & al., 2018 a (p.189, Rem.: p.196); Palomares-Garcia & al., 2018 (p.178, Table 1: occurrence); Hure M. & al., 2018 (p.1, Rem.: p.12); Bode & al., 2018 (p.66, fig.5, vertical distribution %, Rem). Acha & al., 2020 (p.1, Table 3: occurrence % vs. ecoregions, Table 5: indicator ecoregions); Hirai & al., 2020 (p.1, Fig. 5: cluster analysis (OTU), spatial distribution); Bode-Dalby & al., 2026 (p.6-14, figs and tables) | | | | NZ: | 23 | | |
|
Carte de distribution de Nannocalanus minor par zones géographiques
|
| | | | | | | | | | | | | | | 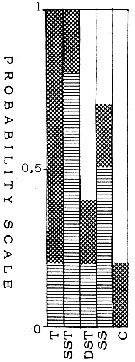 issued from : T.S.K. Björnberg in Bol. Inst. Oceanogr., Sao Paulo, 1963, XIII (1). [p.12, Fig.2]. issued from : T.S.K. Björnberg in Bol. Inst. Oceanogr., Sao Paulo, 1963, XIII (1). [p.12, Fig.2].
Probability of occurrence of Nannocalanus minor in different environments.
T: Tropical waters (above 36.00 p.1000 salinity and above 20°C temperature); SST: Surface subtropical waters (salinity around 36 p.1000 and temperature 18°C or less); DST: Deeper shelf waters (salinity between 34 and 36, temperature under 20°C p.1000); SS: Surface shelf waters (same salinity and temperature above 20°C);
C: coastal waters with low salinity and variable temperature.
In each column no shading means no probability of finding the species in the samples from this environment; horizontal shading indicates the probability of finding the sepecies in percentages less than one in samples from this environment; cross shading indicates the probability of finding it in percentages higher than one and black shading represents the probability of finding it in the largest percentages of the total number of copepods. |
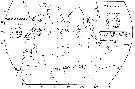 issued from : R. Stephen in Pelagic Biogeography ICoPB II. Proc. 2nd Int. Conf. Final report of SCOR/IOC working group 93. 9-14 July 1995. Workshop Rep. No.142. UNESCO, 1998. issued from : R. Stephen in Pelagic Biogeography ICoPB II. Proc. 2nd Int. Conf. Final report of SCOR/IOC working group 93. 9-14 July 1995. Workshop Rep. No.142. UNESCO, 1998.
P.339, Fig.1: Distribution of Nannocalanus minor in the Indian Ocean. |
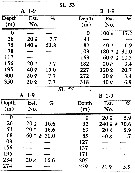 issued from : H.B. Owre & M. Foyo in Fauna Caribaea, 1, Crustacea, 1: Copepoda. Copepods of the Florida Current. 1967. [p.31, Table 4]. issued from : H.B. Owre & M. Foyo in Fauna Caribaea, 1, Crustacea, 1: Copepoda. Copepods of the Florida Current. 1967. [p.31, Table 4].
Vertical distribution of Nannocalanus minor at the ''40-Mile station'' in the Florida Current (± 25°35'N, 79°27'W).
SL 53: 18 V 1958; SL 55: 21 VII 1958. A: during midday; B: during midnight |
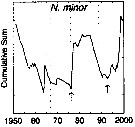 issued from : G.A. Rebstock in Global change Biology, 2002, 8. [p.77, Fig.2 g]. issued from : G.A. Rebstock in Global change Biology, 2002, 8. [p.77, Fig.2 g].
Climatic regime shifts and decadal-scale variability in calanoid copepod populations off southern California (31°-35°N, 117°-122°W.
Cumulative sums of nonseasonal anomalies from the long-term means of copepod abundance from years 1950 to 2000.
A negative slope indicates a period of below-average anomalies; a positive slope indicates a period of above-average anomalies. Abrupt changes in slope indicate step changes. Step changes are marked with arrows (downward -pointing for decreases).
The October 1966 cruise (prior to the increase in sampling depth), March 1976 cruise (prior to the 1976-77 climatic regime shift), and October 1988 cruise (prior to the hypothesized 1989 climatic regime shift) are marked with vertical lines. |
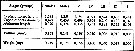 issued from : A.A. Shmeleva in Bull. Inst. Oceanogr., Monaco, 1965, 65 (n°1351). [Table 6: 3]. As Calanus minor (from South Adriatic). issued from : A.A. Shmeleva in Bull. Inst. Oceanogr., Monaco, 1965, 65 (n°1351). [Table 6: 3]. As Calanus minor (from South Adriatic).
Dimensions, volume and Weight wet. Means for 50-60 specimens. Volume and weight calculated by geometrical method. Assumed that the specific gravity of the Copepod body is equal to 1, then the volume will correspond to the weight. |
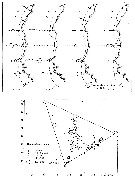 issued from : U. Brenning in Wiss. Z. Wilhelm-Pieck-Univ. Rostock - 30. Jahrgang 1981. Mat.-nat. wiss. Reihe, 4/5. [p.5, Figs.4, 5]. issued from : U. Brenning in Wiss. Z. Wilhelm-Pieck-Univ. Rostock - 30. Jahrgang 1981. Mat.-nat. wiss. Reihe, 4/5. [p.5, Figs.4, 5].
Spatial distribution and T-S Diagram for Nannocalanus minor from 8° S - 26° N; 16°- 20° W, and Namibia (SW Africa), for different expeditions (V1: Dec. 1972-Jan. 1973; V2: Feb./Mar. 1973; IV: Jun.-Jul. 1972; V: Feb.-Mar. 1973; VI: May 1974; VIII: 21 Sept.-17 Dec. 1976).
SO: Southern Surface Water (S °/oo: 34,50; T°C: 29,0); ND: Northern Water of the Surface Layer (S °/oo: 37,5; T°C: 21,0); SD: Southern Deep Water of the surface layer (S °/oo: 35,33; T°C: 13,4). See commentary in Calanus helgolandicus and Brenning (1985 a, p.6). |
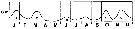 issued from : R. Gaudy in Tethys, 1972, 4 (1). [p.237, Fig.36]. issued from : R. Gaudy in Tethys, 1972, 4 (1). [p.237, Fig.36].
Schematic quantitative abundance of Calanus (= Nannocalanus) minor in the Gulf of Marseille (Mediterranean Sea) established from samples during the period between October 1960 to December 1967.
Gaudy (p.216) points to 5 generations per year with difficuty because the quantitative paucity of individuals. |
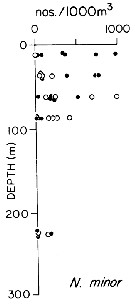 issued from : T.L. Hayward in Mar. Biol., 1980, 58. [p.299, Fig.2]. issued from : T.L. Hayward in Mar. Biol., 1980, 58. [p.299, Fig.2].
Plots of day (open circle) and night (filled circle) depth distributions of Nannocalanus minor in the North Pacific central gyre (main sampling location: 25°N, 155°W with drogue), September 1968. |
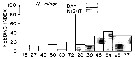 issued from : T.L. Hayward in Mar. Biol., 1980, 58. [p.302, Fig.4]. issued from : T.L. Hayward in Mar. Biol., 1980, 58. [p.302, Fig.4].
Day and night feeding indices (relative degree of gut fullness of copepods collected under differing environmental conditions) for females Nannocalanus minor from N Pacific central gyre (main sampling location: 28°N, 155°W), June 1973.
Numbers in abscisse : stations. |
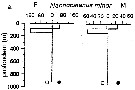 Issued from : P.-E. Lapernat in DEA Océanogr. Biol., Univ. P. & M. Curie, Paris VI. July 5, 2000. [Fig.10 a]. Issued from : P.-E. Lapernat in DEA Océanogr. Biol., Univ. P. & M. Curie, Paris VI. July 5, 2000. [Fig.10 a].
Verical distribution of Nannocalanus minor at an oligotrophe site (off NW Cape Verde Islands: 21° N, 31° W) in females (F) and males (M) (ind. per m3) in the day (white circle) and night (black circle).
Nota: Sampling in the water column 0-1000 m, one during the day and another during the night with BIONESS multiple-net: 0-75; 75-150; 150-250; 250-350; 350-450; 450-550; 550-700; 700-850; 850-965 m. In May-June 1992. |
 Issued from S. Razouls in XXIII rd Congress of Athens, 3-11 November 1972. [p.2]. Oxygen consumed by individual (adult) in the Banyuls Bay. Issued from S. Razouls in XXIII rd Congress of Athens, 3-11 November 1972. [p.2]. Oxygen consumed by individual (adult) in the Banyuls Bay.
(1) Hydrological season in the stability period: Eté = Summer: 18-20 °C; Hiver = Winter: 13-10°C.
Espèces = species; Saison = Season; Lg céph.= cephalothoracic length; an = individual. |
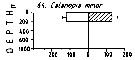 Issued from : M. Madhupratap & P. Haridas in J. Plankton Res., 12 (2). [p.313, Fig.6]. Issued from : M. Madhupratap & P. Haridas in J. Plankton Res., 12 (2). [p.313, Fig.6].
Vertical distribution of calanoid copepod (mean +1 SE), abundance No/100 m3. 64- As Calanopia minor [lapsus calami] = Nannocalanus minor.
Night: shaded, day: unshaded.
Samples collected from 6 stations located off Cochin (India), SE Arabian Sea, November 1983, with a Multiple Closing Plankton Net (mesh aperture 300 µm), in vertical hauls at 4 depth intervalls (0-200, 200-400, 400-600, 600-1000 m). |
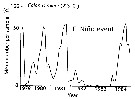 Issued from : C.B. Miller in Biological Oceanography, Blackwell Publishing, 2005. [p.363, Fig. 16.16 (c)]. After Dessier & Donguy, 1987. Issued from : C.B. Miller in Biological Oceanography, Blackwell Publishing, 2005. [p.363, Fig. 16.16 (c)]. After Dessier & Donguy, 1987.
Time series of abundance estimates for Calanus minor (= Nannocalanus minor) species sampled along the Pacific equator from passenger liner on a regular schedule.
Miller underlines that serial abundance for this species from the equator to 2°N shows strong seasonality and dramatic reduction during the 1982-1983 El Niño (with a a sharp reduction of nitrate). A long list of other species also nearly vanished in that event. At least the stocks of hebivorous species rebounded immediately in 1984 (see E. rimana, a predator). |
 Issued from : M. Bode, A. Schukat, W. Hagen & H. Auel in J. Exp. Mar. Biol. Ecol., 2013, 444. [p.3, Table 1]. Issued from : M. Bode, A. Schukat, W. Hagen & H. Auel in J. Exp. Mar. Biol. Ecol., 2013, 444. [p.3, Table 1].
As Calanoides carinatus (probably C. natalis).
Dry mass, individual respiration rate and ETS activity from the northern Benguela Current upwelling system along transects at 23°S and 26°40'S, off Walvisbay and Lüderitz (Namibia).
For female in Ikeda & al. (2001) the respiration rate (µl O2 h-1 ind-1) was 0.21 ± 0.01 (40 µg) in the tropical Pacific Ocean.
Relationship between individual ETS activities and individual respiration rates; mean ETS activities with standard deviations are plotted again mean respiration rates (Cf. in Calanoides natalis. The letter besides each point identifies the associated species in Table 1 (c) for this species) in the same authors.
Cf. Table 1: Dry mass, individual respiration rate and ETS activity.
For Ikeda & al. (2001) the female respiration rate at 26.9°C were 0.21 ±0.01 µl O2 h ind-1 (DM: 40 µg) in the Tropical Pacific Ocean. |
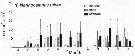 Issued from : M. Bode, A. Kreiner, A.K. van der Plas, D.C. Louw, R. Horaeb, H. Auel & W. Hagen in PoS ONE, 2014, 9 (5). [p.5, Fig.4h]. Metridia lucens Issued from : M. Bode, A. Kreiner, A.K. van der Plas, D.C. Louw, R. Horaeb, H. Auel & W. Hagen in PoS ONE, 2014, 9 (5). [p.5, Fig.4h]. Metridia lucens
Monthly means (±SD) of number of individuals (no) m-2 x 10³.
Copepods samples collected along transect at 20°S off Namibia starting in March 2005 (see map), using a WP2 net (200 µm mesh aperture) from 200 m (or less) to the surface from offshore to inshore.
Cf. map 1 and complementary informations in Calanoides natalis from the same authors (2014). |
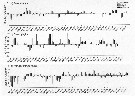 Issued from : M. Bode, A. Kreiner, A.K. van der Plas, D.C. Louw, R. Horaeb, H. Auel & W. Hagen in PLoS ONE, 2014, 9 (5). [p.6, Fig.5 a, b, g]. Issued from : M. Bode, A. Kreiner, A.K. van der Plas, D.C. Louw, R. Horaeb, H. Auel & W. Hagen in PLoS ONE, 2014, 9 (5). [p.6, Fig.5 a, b, g].
Log-transformed monthly anomalies between 2005 and 2011 of a) temperature at 10 m, b) chlorophyll a, and g) abundance of Nannocalanus minor (no. m2.
Cf. in Calanoides natalis map and remarks from the same authors. |
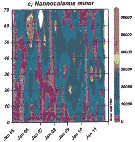 Issued from : M. Bode, A. Kreiner, A.K. van der Plas, D.C. Louw, R. Horaeb, H. Auel & W. Hagen in PLoS ONE, 2014, 9 (5). [p.9, Fig.9, c]. Issued from : M. Bode, A. Kreiner, A.K. van der Plas, D.C. Louw, R. Horaeb, H. Auel & W. Hagen in PLoS ONE, 2014, 9 (5). [p.9, Fig.9, c].
Monthly abundances (no. m-2along transect from inshore (0 nm) to offshore (70 nm) (See map).
Note patches in the spatial distributions from inshore (0 nm) and offshore (70 nm).
Compare with Calanoides natalis, Metridia lucens, Rhincalanus nasutus from the same authors. |
| | | | Loc: | | | Cosmopolite (mainly tropical, temperate) : Antarct. (in Hardy & Gunther, 1935: Atlant. sector; Guglielmo & al., 2007: Ross Sea; very rare), sub-Antarct. (Indian, SE Pacif.), Patagonia, South Africa (E & W), Saldanha, Namibia, off Angola, Baia Farta, Congo, G. of Guinea, Ivorian shelf, Atlant. (central equatorial), Uruguay (continental shelf), Brazil (S, off Rio de Janeiro, Guanabara Bay, Campos Basin, off Vitoria - Cabo de Sao Tomé, off Macaé, Camamu, off Natal), Argentina, Dakar, Cape Verde Is., off Mauritania - NW Cape Verde Is., Morocco-Mauritania, Cap Ghir, Great Meteor Seamount, Azores, Canary Is., Portugal, off Coruña, Caribbean Colombia, Cariaco Basin, Caribbean Sea, Chetumal Bay, Yucatan, Cuba, Cariaco Basin, E Costa Rica, G. of Mexico, E Florida, Sargasso Sea, Station "S" (32°10'N, 64°30'W), off Cape Hatteras, off E Cape Cod, Long Island, Delaware Bay (outside), off Woods Hole, Gulf Stream (41°N,58°W), off Newfoundland, off SE Nova Scotia, S Iceland, off Ireland (N & SW), North Sea, off Gijon, Bay of Biscay, Ibero-moroccan, off W Tangier, Bay, Medit. (Alboran Sea, Habibas Is., Sidi Fredj coast, Castellon, Gulf of Annaba, El Kala shelf, Baleares, Banyuls, Marseille, Ligurian Sea, Tyrrhenian Sea, Napoli, Messina, Taranto, NW Tunisia, G. of Gabes, Malta, Adriatic Sea, G. of Gabès, Ionian Sea, Aegean Sea, Thracian Sea, Black Sea, N Lebanon Basin, Alexandria, W Egyptian coast), G. of Aqaba, Hurghada, off Sharm El-Sheikh, Safâga, Red Sea, Arabian Sea, Persian Gulf, India (Goa - Gujarat, Mangalore coast, Lawson's Bay), W Indian, Madras, equatorial Indian Ocean, off SE La Réunion Is., off Madagascar S, Nosy Bé, Rodrigues Is. - Seychelles, Mascarene Basin, Natal, S Indian (subtropical convergence), Gulf of Mannar, Porto Novo, Palk Bay, Godavari region, Bay of Bengal, Nicobar Is., Batten Island, W Malay Peninsula (Andaman Sea), W Australia, Straits of Malacca, Indonesia-Malaysia, Ambon Bay, Tioman Is., SW Celebes, Philippines, Hainan (Sanya Bay), Gulf of Tonkin, China Seas (Yellow Sea, East China Sea, South China Sea, Yellow Sea), Taiwan Strait, Taiwan (S, E, SW, W, NW, N, Mienhua Canyon, NE), Okinawa, Korea (S & E), Korea Strait, Japan Sea, Tsushima Straits, Japan (Nagazaki, Izu, Tokyo Bay, Tanabe Bay), off Japan (Kuchinoerabu Is., SE, NE), Kuroshio Current, Alaska SW, Aleutians Is., Bering Sea, Pacif. (W equatorial), Pacific (central gyres: N and S), Australia (G. of Carpentaria, Great Barrier, Moreton Bay), New Caledonia, New Zealand, Moorea Is., off British Columbia, California, Baja California (Bahia Magdalena, W), Gulf of California, La Paz, Acapulco Bay, G. of Tehuantepec, W Costa Rica, Clipperton Is., Hawaii, off Hawaii (N & S), Guaymas Basin, Galapagos, Pacif. (SE tropical), S Pacif. (NPFZ), Bahia Cupica (Colombia), Peru, Chile (N-S, off Valparaiso, off Santiago, Concepcion) | | | | N: | 445 | | | | Lg.: | | | (11) F: 2,133-1,538; M: 1,8-1,533; (14) F: 2,05-1,45; M: 1,8-1,33; (28) M: 1,7-1,17; (34) F: 1,8-1,5; M: 1,52-1,48; (35) F: 2,05-1,56; (38) F: 2,28-1,98; M: 2-1,98; (45) F: 2-1,75; M: 1,8-1,7; (47) F: 2-1,8; M: 1,8-1,7; (66) F: 2-1,78; M: 1,4-1,37; (72) F: 2,24-1,7; M: 2,01-1,55; (101) F: 1,8-1,51; M: 1,51-1,24; (104) F: 2; (114) F: 2,12-2,06; (125) F: 1,84-1,77; M: 1,56-1,5; (142) F: 2-1,8; (150) F: 1,77-1,6; M: 1,7-1,5; (187) F: 1,98-1,86; M: 1,68-1,6; (188) F: 2-1,8; M: 1,8-1,7; (196) F: 2,15-1,55; M: 1,85-1,2; (199) F: 2,05-1,52; M: 1,82-1,37; (237) F: 1,8-1,9; M: 1,4-1,8; (254) F: ±1,8; (290) F: 1,95-1,6; M: 1,78-1,7; (321) F: 2,09-1,93; M: 2; (327) F: 2,14-1,77; M: 1,92-1,66; (335) F: 1,61; M: 1,7-1,68; (337) F: 1,88-1,7; M: 1,62-1,45; (340) F: 1,9; (786) F: 2,2-1,75; M: 1,84-1,67; (432) F: 2,3-1,95; (795) F: 1,5; (830) F: 2-1,56; M: 1,76-1,5; (866) F: 1,7-2,4; (920) F: 1,775-1,825; M: 1,718;1,732; (927) F: 1,83-1,87 [winter]; 1,73-1,81 [summer]; M: 1,75-1,77 [winter]; (943) F: 1,72-2,2; M: 1,62-1,8; (991) F: 1,7-2,3; M: 1,2-2,01; (1107) F: 1,6-2,45; M: 1,65-2,06; (1137) F: 2,20-1,81; M: 1,95-1,78; (1230) F: 1,5-2; M: 1,5-1,7; {F: 1,45-2,45; M: 1,17-2,06} | | | | Rem.: | épipélagique-mésopélagique, 1500 m (off Malte).
Sampling depth (Antarct., sub-Antarct.) : 0-600 m.
La plupart des références sont sous l'appellation Calanus minor.
Des confusions sont possibles avec N. elegans (Cf. Andronov & al., 2006).
Nannocalanus minor f. major Sewell,1929 (F)
Ref.: Sewell, 1929 (p.21, figs.F); 1951 (p.363, Rem.); Marques, 1953 (p.91); 1958 (p.205); Grice, 1962 (p.177); Silas, 1972 (p.644); Marques, 1973 (p.232); Ambler & Miller, 1987 (tab.2, 3, 4, 5); Bucklin & al., 1996 (p.285); Lapernat, 1999 (p.10); Andronov, 2001 (p.281: Rem.); Boxshall & Halsey, 2004 (p.81: fig.M)
Loc.: Chili, Indien, Angola, Is. Sao Tomé et Principe, mar del Plata, Lisbonne, Gulf Stream, off Malte, off Hawaii NE
Lg.: (28) F: 2,09-1,53; (29) F: 1,64-1,55; (340) F: 1,9
Rem.: épipélagique, 1500 m (off Malte)
Nannocalanus minor f. minor Sewell,1929 (F)
Ref.: Sewell, 1929 (p.22, figs.F, juv.V); 1951 (p.363); Krishnaswamy, 1953 (p.107); Silas, 1972 (p.644); Marques, 1974 (p.11); Ambler & Miller, 1987 (tab.2, 3, 4, 5); Bucklin & al., 1996 (p.285); Andronov, 2001 (p.281: Rem.)
Loc.: Indien, Is. du Cap Vert, Gulf Stream, off Hawaii NE
Lg.: (28) F: 1,38-1,26; (29) F: 1,49-1,32; (795) F: 1,5
Voir aussi les remarques en anglais | | | Dernière mise à jour : 11/03/2026 | |
|
|
 Toute utilisation de ce site pour une publication sera mentionnée avec la référence suivante : Toute utilisation de ce site pour une publication sera mentionnée avec la référence suivante :
Razouls C., Desreumaux N., Kouwenberg J. et de Bovée F., 2005-2026. - Biodiversité des Copépodes planctoniques marins (morphologie, répartition géographique et données biologiques). Sorbonne Université, CNRS. Disponible sur http://copepodes.obs-banyuls.fr [Accédé le 01 juin 2026] © copyright 2005-2026 Sorbonne Université, CNRS
|
|
|
|




;)
;)
;)
;)
;)
;)
;)
;)
;)
;)
;)
;)
;)
;)
;)
;)
;)
;)
;)
;)
;)
;)
;)
;)
;)
;)
;)
;)
;)
;)
;)
;)
;)
;)
;)
;)
;)

;)
;)
;)
;)
;)
;)
;)
;)
;)
;)
;)
;)
;)
;)
;)
;)
;)