|
|
 |
Fiche d'espèce de Copépode |
|
|
Calanoida ( Ordre ) |
|
|
|
Metridinidae ( Famille ) |
|
|
|
Metridia ( Genre ) |
|
|
| |
Metridia lucens Boeck, 1864 (F,M) | |
| | | | | | | Syn.: | Paracalanus hibernicus Brady & Robertson, 1873 (p.126, figs.F,M);
Metridia hibernica : Giesbrecht, 1892 (p.339, 345, figs.F,M); Wheeler, 1901 (p.176, figs.F,M);
Metridia armata Brady, 1878 (p.42);
? no M. lucens : Campbell, 1929 (p.316); Davis, 1949 (p.48, figs.F, p.66: Rem.);
? Metridia pacifica Brodsky, 1950 (1967) (p.295, figs.F,M);
Cf.: in Shih & al., 1971 (p.148);
M. lunces : Rosales & Sepulveda, 1992 (p.38: lapsus calami);
M. norvegica : Herring, 1988 (p.184);
M. pacifica : Mazzocchi & Ianora, 1991.
Metridia lucens lucens : Acha & al., 2020 (p.1, Table 3: occurrence % vs ecoregions, Table 5: indicator ecoregions; offshore Northern and Southern region).
Metridia lucens pacifica : Acha & al., 2020 (p.1, Table 3: occurrence % vs ecoregions, Table 5: indicator ecoregions; shelf region). | | | | Ref.: | | | Giesbrecht, 1895 c (p.257); Giesbrecht & Schmeil, 1898 (p.106); Sars, 1902 (1903) (p.113, figs.F,M); Thompson & Scott, 1903 (p.234, 249); Esterly, 1905 (p.177, figs.F, Rem.F,M); Farran, 1908 b (p.60); Willey, 1920 (p.16); Sars, 1925 (p.198); Farran, 1926 (p.270); Rose, 1929 (p.29); Farran, 1929 (p.209, 258, Rem.); Wilson, 1932 a (p.119, figs.F,M); Rose, 1933 a (p.178, figs.F,M); Jespersen, 1934 (p.98, fig.26); Mori, 1937 (1964) (p.67, figs.F,M); Jespersen, 1940 (p.45, fig.5); Wilson, 1942 a (p.194, fig.M); Farran, 1948 c (n°14, p.3, figs.F); Brodsky, 1950 (1967) (p.294, figs.F,M, Rem.); Vervoort, 1951 (p.120: Rem.); Chiba, 1956 (p.31, figs. M juv.); Vervoort, 1957 (p.119, Rem.); David & Conover, 1961 (p.92: biolux); Furuhashi, 1965 a (p.49); Fleminger, 1967 a (p.XII, Rem.); Park, 1968 (p.555, Rem.); Ramirez, 1969 (p.68, figs.F,M, Rem.); Shih & al., 1971 (p.41, 205); ? Vidal, 1971 a (p.13, 22, 116, figs.F,M, Rem.); Bradford, 1972 (p.44, figs.F,M); Björnberg, 1972 (p.31, figs., Rem.N); Zvereva, 1972 (1975) (p.254, figs.F); Arcos, 1976 (p.85, Rem.: p.95, Table II, fig.F, M); Séret, 1979 (p.131, figs.F); Dawson & Knatz, 1980 (p.5, figs.F,M); Björnberg & al., 1981 (p.640, figs.F,M); Gardner & Szabo, 1982 (p.324, figs.F,M); Roe, 1984 (p.358); Szabo & Gardner, 1986 (p.1560: Appendix, Rem.); Razouls, 1994 (p.144, figs.F,M); Karlson & Bamstedt, 1994 (p.79, fig.2: Md); Mazzocchi & al., 1995 (p.51, figs.F,M, Rem.); Bucklin & al., 1995 (p.655, 658: phylogeny); Chihara & Murano, 1997 (p.837, tab.6); Cuoc & al., 1997 (p.654, figs.F); Bradford-Grieve & al., 1999 (p.884, 948, figs.F,M); Bradford-Grieve,1999 b (p.115, figs.F,M, Rem., figs.178, 192); G. Harding, 2004 (p.32, figs.F,M); Conway, 2006 (p.18, 25, copepodides 1-6, Rem.); Ferrari & Dahms, 2007 (p.63, Rem.); Vives & Shmeleva, 2007 (p.363, figs.F,M, Rem.); Stupnikova & al., 2013 (p.451, genetic variability: 2 gryptic species within M. lucens | 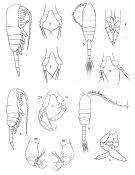 Female: 1, lateral view; 2, 2', P5; issued from : Vidal, 1971. 3, dorsal view; 4, P2; 5, P5; issued from : Mori, 1964. Male: 6, lateral view; 7, P5 Dt: right, G: left); issued from Vidal, 1971. 8, dorsal view; 9, P5; issued from Mori, 1964. 10 and 10', segments 3 and 4 pf left P5 from Metridia pacifica issued from : Vaupel-Klein, 1970.
|
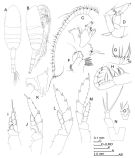 issued from : J.M. Bradford-Grieve in The Marine Fauna of New Zealand: Pelagic Calanoid Copepoda. National Institute of Water and Atmospheric Research (NIWA). NIWA Biodiversity Memoir, 111, 1999. [p.108, Fig.72]; Female (from 53°26.34'S, 170°15'Eç: A, habitus (dorsal); B, idem (right lateral side); C, A1; D, A2; E, Md; F, Mx1; G, Mx2; H, Mxp; I, P1; J, P2; K, segment 1 of endopod and exopod of P2; L, P3; M, P4; N, P5; O, P5. Nota: Cephalosome about same length as remaining pedigerous segments together, and vaulted in the middle. - Lateral corners of last pediger segment with an acute point. - Genital segment shorter than next two segments combined. - Caudal rami scarcely as long as anal segment and of nearly uniform width throught their length, outer edge seta at midlength. - A1 extends slightly beyond the prosome, there is no toothed projection on segment 10. - P5 3-segmented, the last 2 being fused.
|
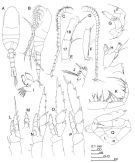 issued from : J.M. Bradford-Grieve in The Marine Fauna of New Zealand: Pelagic Calanoid Copepoda. National Institute of Water and Atmospheric Research (NIWA). NIWA Biodiversity Memoir, 111, 1999. [p.109, Fig.73]. Male: A, habitus (dorsal); B, idem (left lateral side); C, left A1; D, right A1; E, segments 17 and 18 of left A1; F, segments 19-21 of left A1; G, A2; H, Md; I, Mx1; J, Mx2; K, Mxp; L, P1 (posterior); M, endopod of P1 (anterior); N, P2; O, P3; P, P4; Q, P5 (L = left leg; R = right leg). Nota: Left A1 (rarely right) geniculate. - P5 with terminal segment on both sides of oblong form, spiniform orocess on segment 3 of right leg elongate, slightly sigmaoid and finely denticulated on one side distally.
|
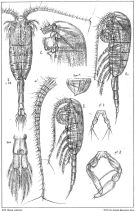 issued from : G.O. Sars in An Account of the Crustacea of Norway. Vol. IV. Copepoda Calanoida. Published by the Bergen Museum, 1903. [Pl.LXXVII]. Female & Male.
|
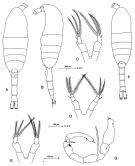 Issued from: M.G. Mazzocchi, G. Zagami, A. Ianora, L. Guglielmo & J. Hure in Atlas of Marine Zooplankton Straits of Magellan. Copepods. L. Guglielmo & A. Ianora (Eds.), 1995. [p.53, Fig.3.5.1]. Female: A, habitus (dorsal); B, idem (lateral left side); C-E, P5 (showing variations in number of segments and spines on outer margins. Nota: Proportional lengths of urosomites and furca 41:24:16:19 = 100. Male: F, habitus (dorsal); G, P5. Nota: Proportional lengths of urosomites and furca 14:19:18:18:13:18 = 100. Caudal rami are longer than the anal somite and the left P5 bears 2 spines on the inner margin (as in M. pacifica). Some specimens had P5 with reversed rami.
|
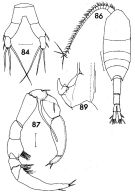 issued from : F.C. Ramirez in Contr. Inst. Biol. mar., Buenos Aires, 1969, 98. [p.64, Lam. XII, figs.84, 86, 87, 89 ]. Female (from off Mar del Plata): 84, P5; habitus (dorsal); 89, P2 (detail). Male: 87, P5. Scale bars in mm: 0.05 (84, 87, 89); 0.5 (86)
|
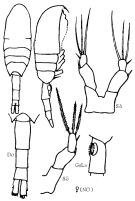 Issued from : K.A. Brodskii in Calanoida of the Far Eastern Seas and Polar Basin of the USSR. Opred. Fauna SSSR, 1950, 35 (Israel Program for Scientific Translations, Jerusalem, 1967) [p.294, Fig.200]. Female (from Norvegian Sea): habitus (dorsal and lateral right side); Do, urosome (dorsal); GsLa, genital segment (lateral leftt side); S5, P5. Nota: See in Remarks.
|
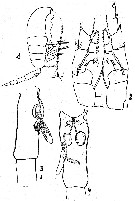 issued from : J.A. Zvereva in Issled. Fauny Moreï, 1972, 12 (20). [p.221, Fig.3, 1-4]. Female (from Antactic): 1, habitus (lateral); 2, P2; 3, genital segment (lateral right side); 4, idem (ventral).
|
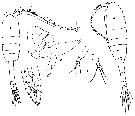 issued from : T. Mori in The pelagic Copepoda from the neighbouring waters of Japan, 1937 (2nd edit., 1964). [Pl.34, Figs.1-5]. Female: 3, P5; 4, habitus (dorsal); 5, P2. Male: 1, habitus (dorsal); 2, P5.
|
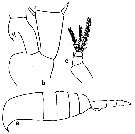 issued from : C.O. Esterly in Univ. Calif. Publs. Zool., 1905, 2 (4). [p.178, Fig.35, a-c]. Female (from San Diego Region): a, habitus (lateral); b, 2nd basal segment and 1st segment of endopod of P2 (showing hooks); c, P5.
|
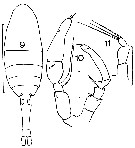 issued from : J.M. Bradford in Mem. N. Z. Oceonogr. Inst., 1972, 54. [p.43, Fig.10, (9-11)]. Female (from Kaikoura, New Zealand): 9, habitus (dorsal); ; 11, P5. Male: 10, P5. Scale bars: 1 mm (9); 0.1 mm (10, 11).
|
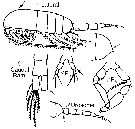 issued from : G. Harding in Key to the adullt pelagic calanoid copepods found over the continental shelf of the Canadian Atlantic coast. Bedford Inst. Oceanogr., Dartmouth, Nova Scotia, 2004. [p.32]. Female & Male. Nota: Metasome produced posteriotly into acute points. Cephalosome highly vaulted in lateral view. Caudal rami twice as long as broad in both sexes.
|
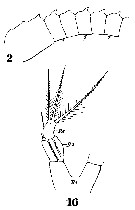 Issued from : W. Giesbrecht in Systematik und Faunistik der Pelagischen Copepoden des Golfes von Neapel und der angrenzenden Meeres-Abschnitte. – Fauna Flora Golf. Neapel, 1892, 19 , Atlas von 54 Tafeln. [Taf.33, Figs.2, 16]. As Metridia hibernica. Female: 2, A1 (proximal segments); 16, P5.
|
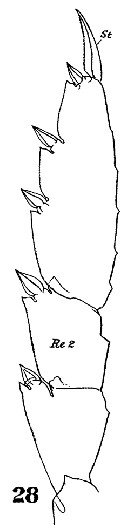 Issued from : W. Giesbrecht in Systematik und Faunistik der Pelagischen Copepoden des Golfes von Neapel und der angrenzenden Meeres-Abschnitte. – Fauna Flora Golf. Neapel, 1892, 19 , Atlas von 54 Tafeln. [Taf.33, Figs.28]. As Metridia hibernica. Female: 28, exopod of P3 (inner setae missing). St = terminal seta; Re 2 = exopodal segment 2
|
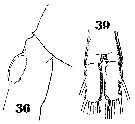 Issued from : W. Giesbrecht in Systematik und Faunistik der Pelagischen Copepoden des Golfes von Neapel und der angrenzenden Meeres-Abschnitte. – Fauna Flora Golf. Neapel, 1892, 19 , Atlas von 54 Tafeln. [Taf.33, Figs.36, 39]. As Metridia hibernica. Female: 36, 5th thoracic segment and genital segment (lateral); 39, anal segment and caudal rami (dorsal).
|
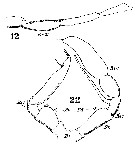 Issued from : W. Giesbrecht in Systematik und Faunistik der Pelagischen Copepoden des Golfes von Neapel und der angrenzenden Meeres-Abschnitte. – Fauna Flora Golf. Neapel, 1892, 19 , Atlas von 54 Tafeln. [Taf.33, Figs.12, 22]. As Metridia hibernica. Male: 12, A1 (geniculation); 22, P5 (anterior view). Ps = left P5; Pd = right P5.
|
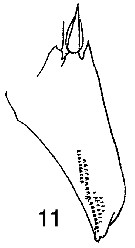 Issued from : W. Giesbrecht in Systematik und Faunistik der Pelagischen Copepoden des Golfes von Neapel und der angrenzenden Meeres-Abschnitte. - Fauna Flora Golf. Neapel, 1892, 19 , Atlas von 54 Tafeln. [Taf.32, Fig.11]. As Metridia hibernica. Female: 11, exopodal segment 1 of P2 (anterior view).
|
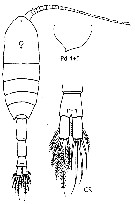 issued from : J.M. Bradford-Grieve, E.L. Markhaseva & C.E.F. Rocha & B. Abiahy in South Atlantic Zooplankton, Edit. D. Boltovskoy. 1999. Vol.2. Copepoda. [p.1054, Fig. 7.323]. Female: habitus (dorsal); Pd 4+5, posterior corners of prosome pointed; CR, Anal segment and caudal rami. Nota: Prosome with posterior corners pointed; Caudal ramus twice as long as wide.
|
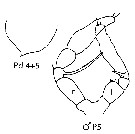 issued from : J.M. Bradford-Grieve, E.L. Markhaseva & C.E.F. Rocha & B. Abiahy in South Atlantic Zooplankton, Edit. D. Boltovskoy. 1999. Vol.2. Copepoda. [p.1054, Fig. 7.323]. Male: Pd 4+5, posterior corners of prosome pointed; P5 (r = right side; l = left side). Nota: posterior corners of prosome pointed. Both P5 rounded distally.
|
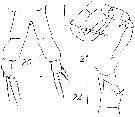 issued from : D.F. Arcos in Rev. Com. Perm. Pacifico Sur, 1976, 5. [Figs. 20, 21, 22]. Female (from Isla Riesco & Tierra del Fuego); 20, P5 (50 µ). Male; 21, P5 (200 µ); 22, 1st segment endopodite of P2 (50 µ).
|
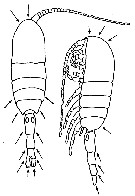 issued from : C.N. David & R.J. Conover in Biol. Bull., 121 (1). [p.95, Fig.2]. Metridia lucens (from Cape Cod Bay): left, a dorsal view; right, a lateral view. Arrows indicate the general regions of the body where luminescent glands were found. Nota: Measurements of luminescence were made in a ''black box'' with a bathyphotometer (Breslau, 1959). Metridia do not generally luminesce spontaneously in the laboratory, mechanical or electrical stimulation must be applied to study the characteristics of the flashing. The glands varied in shape somewhat depending on their location in the body. Those in the urosome had a long connecting duct between the glands and the external pore while those in the thorax opened directly to the outside through a short duct. In several cases masses of dark material which might be the luminescent substance were observed in these ducts. Observations on the behavior of Metridia during and just after luminescence suggest that the flashing may be involved in an escape mechanism in front of predators.
|
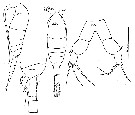 Issued from : C. Séret in Thesis 3ème Cycle UPMC, Paris 6. 1979. [Pl. XXXV, Figs.220-223]. Female (from off Kerguelen Is.) : 220-221, habitus (dorsal and lateral, respectively); 222, last thoracic segment and genital segment with spermatophore attached + 2nd urosomal segment; 223, P5.
|
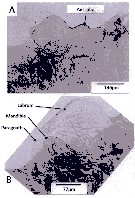 Issued from : A. Lewis in Crustaceana, 2014, 87 (10). [p.1211, Fig.4]. Metridia lucens Boeck, 1864 (s.l.): A, lateral view of labrum-paragnath complex including anterior labral lobe (Ant lobe) and separate lobate structure just anterior to anterior labral lobe; B, enlarged view of labrum, left paragnath and left mandible. See http://booksandjournals.brillonline.com/content/journals/15685403. Nota: Relative to the body axis, the average angle of the labral-paragnath complex is +8°; the complex faces down and slightly forward. The antrerior margin of the labrum proper is located a short distance behind the first antenna, about 7% of the total body length. In lateral view, the labrum forms an extendef hood and bears a number of setules (ffig.5A). The labrum is contiguous with an anterior labral lobe that, from a ventral view, appears to wrap around the labrum almost like a travel neck pillow (fig.5B). Although a lip is not obvious, the distal end of the hood is bilobate, each lobe bearing setules. The paragnaths are short and form laterally flattened cones with setules and claw-like spinules. The average length of the complex (without the anterior labral lobe) is 10% of the total body length, 14% with the lobe. The length of the labrum (without the anterior labral lobe) is just over 37% of the labrum-paragnath complex. The height of the labrum is slightly less than twice the length of the base; the height of each paragnath is about 60% of the base length
|
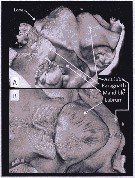 Issued from : A. Lewis in Crustaceana, 2014, 87 (10). [p.1212, Fig.5]. Metridia lucens Boeck, 1864 (s.l.): A, confocal: ventral-lateral view of complex rotated to show lobes on distal posterior surface of labrum; B, confocal: ventral view showing anterior labral lobe wrapped around labrum. See http://booksandjournals.brillonline.com/content/journals/15685403.
|
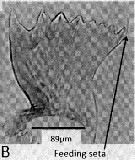 Issued from : A. Lewis in Crustaceana, 2014, 87 (10). [p.1220, Fig.13, B]. Metridia lucens Boeck, 1864 (s.l.): B, gnathobase. Nota: The mandible gnathobase bears a graded series of small to fairly large teeth, similar to those described by Sullivan & al. (1975); the spinulate feeding seta on each gnathobase is short; this seta on the dorsal end fits into the oesophagus and enables food introduction into the disgestive tract as a result of gnathobase movement (Lewis & al., 1998). Although the gnathobase had its pronounced teeth and ridges, suggests a varied diet capability, there is greatest evidence for a herbivore life style (Batchelder, 1986).
|
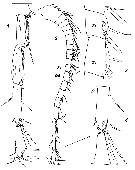 Issued from : V.N. Andronov in Russian Acad. Sci. P.P. Shirshov Inst. Oceanol. Atlantic Branch, Kaliningrad, 2014. [p.28, Fig.3]. Left geniculate A1 of Metridia lucens male: 1, distal part; 2, general view; 3, proximal additional geniculate segment; 4, distal additional geiculate segment (original illustration by V.F. Grudina).
|
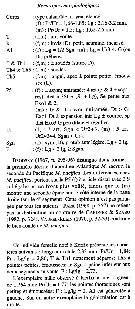 Issued from : C. Razouls in Ann. Inst. océanogr., Paris, 1994, 70 (1). [p.144]. Caractéristiques morphologiques de Metridia lucens femelle et mâle adultes. Terminologie et abbréviations: voir à Calanus propinquus. La station ''Kerfix'' est située à l'entrée de la Baie du Morbihan (Ïles Kerguelen)
|
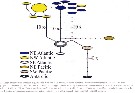 Issued from : L. Blanco-bercial, A. Cornils, N. Copley & A. Bucklin in PLoS Currents, 2014, Version 1, p.8]. TCS analysis on the Metridia lucens sequences. For the authors: Metridia lucens is a cospopolitan species that showed significant differentiation among the six geographic regions analysed: NW Atlantic (19 individuals), NE Atlantic (10), SW Pacific (4), NE Pacific (5) and Antarctic (1). No haplotypes were shared between ocean basins, and genetic distances between regions were on average 10-times that obtained within regions. The Antarctic individual was excluded from analysis. Genetic distances (under K2P model) indicated high and significant isolation between NW and NE Atlantic regions, although this may result partly small sample sizes bias. it is possible that M. lucens, which exhibits strong vertical migration, may experience lower exchange among populations and show strong regional-scale genetic structure. The Antarctic sample showed a highly divergent sequence, env. 8 % different from other M. lucens individuals, which is similar to results obtained with larger sample sizes by Stupnikova & al. (2013). As comparison, genetic distances between M. lucens and the closely related M. pacifica Brodsky (1950) ranged from 12.6 %-14.4 %. Consequently, genetic variation among Antarctic M. lucens samples may reflect either recent speciation or strong regional isolation.
|
 Issued from : A.N. Stupnikova, T.N. Molodtsova, N.S. Mugue & T.V. Neretina in J. Mar. Syst., 2013, 128. [p.181, Fig.3]. Distribution of Metridia lucens North (MLN) and Metridia lucens South (MLS) in the Southern Ocean. Front position by A.H. Orsi & al., 1995); ACC: Antarctic Circumpolar Current; STF: Subtropical front; SAF: Subantracyic Front; PF: Polar Front; SACCF: Southern ACC Front; STZ: Subtropical Zone; SAZ: Subantarctic Zone; PFZ: Polar Front Zone; AZ: Antarctic Zone. Nota: For the authors Metridia lucens shows two genetically distinct groups in the South part of the Atlantic. These two groups may be considered as representing two cryptic species within the M. lucens complex. These forms are found mainly to the North and to the South of the South Polar Front. No hybrids between the two forms were detected. M. lucens North inhabits the waters > 4°C.
| | | | | Ref. compl.: | | | T. Scott, 1902 (p.454); Cleve, 1904 a (p.192); Pearson, 1906 (p.23); Esterly, 1919 (p.1, 52, light-dark reactions); Lysholm & Nordgaard, 1921 (p.22); Rose, 1924 d (p.480); Wilson, 1932 (p.25); Hardy & Gunther, 1935 (1936) (p.179, distribution charts); Jespersen, 1939 (p.67, Rem.); Lysholm & al., 1945 (p.32); Sewell, 1948 (p.349, 503, 508, 512, 514, 546, 549, 557, 559, 567, 568); C.B. Wilson, 1950 (p.265); Fleury, 1950 (p.47, fig.2); Gundersen, 1953 (p.1, 22, Table 19, seasonal abundance); Østvedt, 1955 (p.15: Table 3, p.17, 73); Deevey, 1956 (p.127, tab.IV); Minoda, 1958 (p.253, Table 1, 2, abundance); Deevey, 1960 (p.5, Table II, annual abundance); David C.N. & Conover, 1961 (p.92, bioluminescence); Fagetti, 1962 (p.27); Grice & Hart, 1962 (p.287, table 4: abundance); Marshall & Orr, 1962 (tab.1, 3); Grice, 1963 a (p.496); Bary, 1963 a (p.1519, Table 1); Unterüberbacher, 1964 (p.26); De Decker, 1964 (p.16, 22, 29); De Decker & Mombeck, 1964 (p.13); Bary, 1964 (p.183, T-S diagram-occurrences); Sherman & Schaner, 1965 (p.618, parasitism); Grice & Hulsemann, 1965 (p.224); 1967 (p.17); Kitou, 1965 (p.95, Tables 1-5); Marshall & Orr, 1966 (p.513, Table 4, respiration); Furuhashi, 1966 a (p.295, vertical distribution vs mixing Oyashio/Kuroshio region, Tale 8, 10); Matthews, 1967 (p.159, Table 1, Rem.); Maclellan D.C., 1967 (p.101, 102: occurrence); Haq, 1967 (p.40, nutrition); Fleminger, 1967 a (tabl.1: Rem.); De Decker, 1968 (p.45); Corner & Cowey, 1968 (p.393, Table 8, assimilation); Vinogradov, 1968 (1970) (p.61, 65, 68, 158); Itoh, 1970 a (p.8: tab.2); Roe, 1972 (p.277, tabl.1, tabl.2); Bainbridge & Forsyth, 1972 (p.21, Table I: indictor species, Table II: correlation analysis, Pl. XIII: seasonal abundance); Rudyakov, 1972 (p.886, Table 1: sinking rate); Matthews & Sands, 1973 (p.19, Table 4); Heinrich, 1973 (p.95, fig.1); Björnberg, 1973 (p.338, 387); Beaudouin J., 1973 (p.69); Harding, 1974 (p.141, tab.2, 3, gut contents); Peterson & Miller, 1975 (p.642, 650, Table 3, interannual abundance); Vives & al., 1975 (p.44, tab.II, III, IV, XII); Mackas & Bohrer, 1976 (p.77, fig.3, gut contents); Peterson & Miller, 1976 (p.14, Table 1, 2, 3, abundance vs interannual variations); Deevey & Brooks, 1977 (p.256, tab.2, Station "S"); Peterson & Miller, 1977 (p.717, Table 1, seasonal occurrence); Sameoto, 1977 (p.1, fig.11, abundance); Colebrook, 1978 (tab.1); Longhurst & Williams, 1979 (p.1, Table IVb, V, fig.4a, 8a, vertical distribution/North Atlantic Drift); Pipe & Coombs, 1980 (p.223, figs. 1, 2, 4, table 1, vertical distribution); Brenning, 1981 (p.5, spatial distribution, T-S diagram, Rem.); Herman & al., 1981 (p.1065, front effect- chlorophyll production); Herman & Mitchell, 1981 (p.739, Table 1, 3, length-volume); Vives, 1982 (p.293); Citarella, 1982 (p.791, 798: listing, frequency, Tableau II, V); Kovalev & Shmeleva, 1982 (p.84); Turner & Dagg, 1983 (p.16, fig.16); De Decker, 1984 (p.316, 355: chart); 1984 a (p.156); Tremblay & Anderson, 1984 (p.5); Sameoto, 1984 (p.767, vertical migration); Greze & al., 1985 (p.9); Williams & Collins, 1985 (p.28); Colebrook, 1985 (p.261, tab.1); Brenning, 1985 a (p.24, Table 2); Kawamura & Hirano, 1985 (p.626, Table 1, fig.2, horizontal distribution); Wishner & Allison, 1986 (tab.2); Lewis & Thomas, 1986 (p.1079, tidal transport); Mikhailovsky, 1986 (p.83, Table 1, ecological modelling); Cowles & al., 1987 (p.653, fig.6, Table 4, vertical distribution); Zmijewska, 1987 (tab.2a); Sasaki al., 1988 (p.505, tab.1, fecal pellets flux); Ward, 1989 (tab.2); Citarella, 1989 (p.123, abundance); McLaren & al., 1989 (p.1989 (p.560, life history, annual production); Atkinson & al., 1990 (tab.1); Timonin, 1990 (p.479); Shih & Marhue, 1991 (tab.2, 3); Hay & al., 1991 (p.1453, Table 2, 5); Fransz & al., 1991 (p.8); Santos Ramirez, 1991 (p.79, 80); Buskey, 1992 (p.691, tab.1); Herman, 1992 (p.395, fig.8 a, size distribution by OPC); Lapota & al., 1993 (p.665, bioluminescence); Mumm, 1993 (tab.1); Ashjian & Wishner, 1993 (p.483, abundance, species group distributions); Dagg, 1993 (p.163, Table 1, 2, 3, figs., abundance, gut pigment); Seguin & al., 1993 (p.26, Rem.); Bollens & al., 1993 (p.1827, vertical distribution/predators); Hays & al., 1994 (tab.1); Landry & al., 1994 (p.55, abundance, grazing); Landry & al., 1994 a (p.73, grazing, gut evacuation); Verheye & al., 1994 (p.155); Osgood & Frost, 1994 (p.627, life history, vertical migration); 1994 a (p.13, ontogenic vertical migration); Hajderi, 1995 (p.542); Hays, 1995 (p.301, Table 1, vertical migration); 1995 a (p.1461, ontogeny); Hays & al., 1995 (p.469, vertical migration/months); Krause & al., 1995 (p.81, Rem.: p.130); Atkinson, 1996 (p.85, feeding); Atkinson & al., 1996 (p.195, feeding vs. phytoplankton bloom); Fernandez de Puelles & al., 1996 (p.97, occurrence: p.101); Atkinson & al., 1996 (p.1387, diel periodicity, feeding); Errhif & al., 1997 (p.422); Timonin, 1997 (p.83, vertical migration, Rem.); Falkenhaug & al., 1997 (p.449, spatio-temporal pattern); Park & Choi, 1997 (Appendix); Mauchline, 1998 (tab.20, 33, 58, 61, 63, 64); Barange & al., 1998 (p.1663, Table 2, 5, abundance vs STC region); Reid & Hunt, 1998 (p.310, figs.2, 3, Rem.); Verheye & al., 1998 (p.317, Table II); Siokou-Frangou, 1999 (p.476); Widder & al., 1999 (p.429); Halvorsen & Tande, 1999 (p.279, figs.3, 5); Ansorge & al., 1999 (p.135, Table 2, abundance v.s. TS diagram); Onishchik, 1999 (p.76); Corten, 1999 (p.191, Table 1, fig.3, 7); Harvey & al., 1999 (p.1, 49: Appendix 5, in ballast water vessel); Atkinson & Sinclair, 2000 (p.46, 50, 51, 54, 55, zonal distribution); Sautour & al., 2000 (p.531, Table II, abundance); Lapernat, 2000 (tabl. 3, 4); Pakhomov & al., 2000 (p.1663, Table 1, 2, transect Cape Town-SANAE antarctic base)Razouls & al., 2000 (p.343, tab. 5, Appendix); Musaeva & Gagarin, 2000 (p.534, tab.1); Beare & al., 2000 (p.1545, Atlantic index indicatot); d'Elbée, 2001 (tabl. 1); Musaeva & Suntsov, 2001 (p.511); Holmes, 2001 (p.18, Rem.); Fransz & Gonzalez, 2001 (p.255, tab.1); Hidalgo & Escribano, 2001 (p.159, tab.2); Hunt & al., 2001 (p.374, tab.1, 2); Sameoto & al., 2002 (p.13); Beaugrand & al., 2002 (p.1692); Beaugrand & al., 2002 (p.179, figs.5, 6); Labat & al., 2002 (p.741, tab.3); Takahashi & al., 2002 (p.97, Table 2, fig.5); Kane, 2003 (p.151); Bonnet & Frid, 2004 (p.485, fig.5); CPR, 2004 (p.57, fig.165); Hunt, 2004 (p.1, 47, 74, Table 3.2, 4.4, fig. 4.7, Rem.: p.95); Fernandez & al., 2004 (p.501, tab.5); Veistheim & al., 2005 (p.382, tab.2, fig.1); Manning & Bucklin, 2005 (p.233, Table 1, fig.5); Berasategui & al., 2005 (p.313, fig.2); Blachowiak-Samolyk & al., 2006 (p.101, tab.1); Mackas & al., 2006 (L22S07, Table 2); Tsujimoto & al., 2006 (p.140, Table1); Hooff & Peterson, 2006 (p.2610); Durbin & Casas, 2006 (p.2537, Table 2a, 2b); Lewis & al., 2006 (p.501, Table I); Hop & al., 2006 (p.182, Table 4); Head & Sameoto, 2007 (p.2686, abundance vs interdecadal variability); Valdés & al., 2007 (p.104: tab.1); Biancalana & al., 2007 (p.83, Tab.2, 3); Ferrari & Dahms, 2007 (p.64, Rem.: diel migration); Blachowiak-Samolyk & al., 2007 (p.2716, Table 2); Cabal & al., 2008 (289, Table 1); Mayzaud & al., 2007 (p.202, Table 2, Figs.2, 4; Table 4); Gaard & al., 2008 (p.59, Table 1, N Mid-Atlantic Ridge); Blachowiak-Samolyk & al., 2008 (p.2210, Table 3, 5, biomass, composition vs climatic regimes); Brylinski, 2009 (p.253: Tab.1, p.255: Rem.); Assmus & al., 2009 (p.1895, Table 1, figs.2, 3, 4, 6, 7, 8, 9, 10); Park & Ferrari, 2009 (p.143, Table 5, Appendix 1, biogeography); Dvoretsky & Dvoretsky, 2009 a (p.11, Table 2, abundance); DFO, 2009 (p.1, fig. 13, seasonal variability); C.E. Morales & al., 2010 (p.158, Table 1); Lewis & al., 2010 (p.695, Table I); Eloire & al., 2010 (p.657, Table II, temporal variability); Lidvanov & al., 2010 (p.356, Table 3); Dvoretsky & Dvoretsky, 2010 (p.991, Table 2); Takahashi & al., 2010 (p.317, Table 3, 4, fig. 5); Schnack-Schiel & al., 2010 (p.2064, Table 2: E Atlantic subtropical/tropical); Swadling & al., 2010 (p.887, Table A1, abundance, indicator species); Hidalgo & al., 2010 (p.2089, Table 2); Hirche & Kosobokova, 2011 (p.2359, Table 3, abundance, biomass %); Kosobokova & al, 2011 (p.29, Table 2, Rem.: Nansen Basin); Turner & al., 2011 (p.1066, Table II, abundance 1998-2008); Pepin & al., 2011 (p.273, Table 2, seasonal abundance); Selifonova, 2011 a (p.77, Table 1, alien species in Black Sea); Takahashi & al., 2011 (p.134, distribution); Fileman & al., 2011 (p.403, abundance vs bloom condition); Guglielmo & al., 2012 (p.1301,Table 3); Ward & al., 2012 (p.78, Table A1, weight); Van Ginderdeuren & al., 2012 (p.3, Table 1); Shiganova & al., 2012 (p.61, Table 4); Hidalgo & al., 2012 (p.134, Table 2, 3, figs.6, 8: occurrence vs hydtology); Johnson C & al., 2012 (p.1, 15, fig. 23a, 24a, seasonal variability); Alvarez-Fernandez & al., 2012 (p.21, Rem.: Table 1); Dvoretsky & Dvoretsky, 2012 (p.1321, Table 2, 3, 4, 5, abundance, biomass, production); McGinty & al., 2012 (p.122, time series abundance); Tarling & al., 2012 (p.222, Table 1, 3, seasonal biomass); Bode & al., 2012 (p.108, spatial distribution vs time-series, % biomass); Sobrinho-Gonçalves & al., 2013 (p.713, Table 2, fig.8, seasonal abundance vs environmental conditions); Gusmao & al., 2013 (p.279, Table 3, sex-specific predation by fish); Bode M. & al., 2013 (p.1, Table 1, 3, respiration rate & ETS activity); Schukat & al., 2013 (p.1, Table 1, 2, fig.2, respiration, ingestion); Julies & Kaholongo, 2013 (p.78, fig.4, Rem, %); Lidvanov & al., 2013 (p.290, Table 2, % composition); Bode & al., 2014 (p.1, fig.4, 5, 10, 11, abundance vs long-term 2005-2011); Ward & al., 2014 (p.305, Table 4, 6, 7, seasonal and abundance abundance in the ''Discovery'' Investigations in the 1930s); Fierro Gonzalvez, 2014 (p.1, Tab. 3, 5, occurrence, abundance); El Arraj & al., 2017 (p.272, table 2); Record & al., 2018 (p.2238, Table 1: diapause); Acha & al., 2020 (p.1, Table 3: occurrence % vs ecoregions, Table 5: indicator ecoregions). | | | | NZ: | 22 | | |
|
Carte de distribution de Metridia lucens par zones géographiques
|
| | | | | | | | | | | | | | | 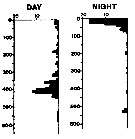 issued from : A. Longhurst & R. Williams in J. Plankton Res., 1979, 1 (1). [p.23, Fig.8a]. issued from : A. Longhurst & R. Williams in J. Plankton Res., 1979, 1 (1). [p.23, Fig.8a].
Day/night percentage numerical profiles at India Station (59°N, 19°W) at end of March 1975.
Depth in meter.
Sampling by LHPRs (Longhurst-Hardy Plankton Recorders). |
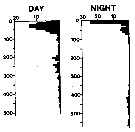 issued from : A. Longhurst & R. Williams in J. Plankton Res., 1979, 1 (1). [p.24, Fig.8b]. issued from : A. Longhurst & R. Williams in J. Plankton Res., 1979, 1 (1). [p.24, Fig.8b].
Day/night percentage numerical profiles at India Station (59°N, 19°W) in early May 1975.
Depth in meter. |
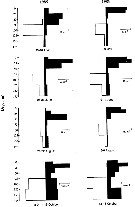 issued from : S.M. Bollens, K. Osgood, B.W. Frost & S.D. Watts in Limnol. Oceanogr., 1993, 38 (8). [p.1831, Fig.1].Vertical distribution of adult females of Metridia lucens in 1985 and 1986 at Dabob Bay (Washington State). issued from : S.M. Bollens, K. Osgood, B.W. Frost & S.D. Watts in Limnol. Oceanogr., 1993, 38 (8). [p.1831, Fig.1].Vertical distribution of adult females of Metridia lucens in 1985 and 1986 at Dabob Bay (Washington State).
For each set of dates, day (clear) and night (black) vertical distributions are means of four vertical series collected in pairs near noon and midnight on each of two consecutives days.Compared with Calanus pacificus, appears two differences between the migration behavior. M. lucens was more deeply distributed, both day and night, than C. pacificus. The most obvious and straightforward explanation of these observations is an interspecific difference in susceptibility to predation by fishes (Electivity);
It must be kept in mind that although these two suspension-feeding copepod species are superficially similar, they differ in several ways other than their migration behavior. M. lucens is classified as an omnivore while C. pacificus is essentialy herbivorous. Also the population level, both fecundity and mortality would need to be considered in determining a species's susceptibility to predation. |
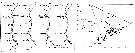 issued from : U. Brenning in Wiss. Z. Wilhelm-Pieck-Univ. Rostock - 35. Jahrgang 1986. Mat.-nat. wiss. Reihe, 5. [p.6, 7, Figs.1, 3]. issued from : U. Brenning in Wiss. Z. Wilhelm-Pieck-Univ. Rostock - 35. Jahrgang 1986. Mat.-nat. wiss. Reihe, 5. [p.6, 7, Figs.1, 3].
Spatial distribution and T-S Diagram for Metridia lucens from 8° S - 26° N; 16°- 20° W, for different expeditions (V1: Dec. 1972-Jan. 1973; V2: Feb./mar. 1973; VI: May 1974; IV: Jun./Jul. 1972), and from SW Africa: Namibia (VIII: 21/9-17/12 1976).
SO: Southern Surface Water (S °/oo: 34,50; T°C: 29,0); ND: Northern Water of the Surface Layer (S °/oo: 37,5; T°C: 21,0); SD: Southern Deep Water of the surface layer (S °/oo: 35,33; T°C: 13,4). See commentary in Temora stylifera and Brenning (1985 a, p.6). |
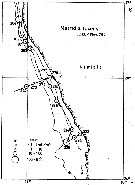 issued from : U. Brenning in Wiss. Z. Wilhelm-Pieck-Univ. Rostock - 35. Jahrgang 1986. Mat.-nat. wiss. Reihe, 5. [p.6, 7, Fig.2]. issued from : U. Brenning in Wiss. Z. Wilhelm-Pieck-Univ. Rostock - 35. Jahrgang 1986. Mat.-nat. wiss. Reihe, 5. [p.6, 7, Fig.2].
Spatial distribution for Metridia lucens from Namibia. |
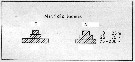 issued from : U. Brenning in Wiss. Z. Wilhelm-Pieck-Univ. Rostock - 35. Jahrgang 1986. Mat.-nat. wiss. Reihe, 5. [p.7, Fig.4]. issued from : U. Brenning in Wiss. Z. Wilhelm-Pieck-Univ. Rostock - 35. Jahrgang 1986. Mat.-nat. wiss. Reihe, 5. [p.7, Fig.4].
Vertical distribution for Metridia lucens from NW and SW Africa.
T: daylight; N: night. |
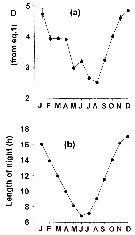 issued from : G.C. Hays, A.J. Warner & C. Proctor in Limnol. Oceanogr., 1995, 40 (2). [p.472, Fig. 4 (partial)]. issued from : G.C. Hays, A.J. Warner & C. Proctor in Limnol. Oceanogr., 1995, 40 (2). [p.472, Fig. 4 (partial)].
Metridia lucens collected by the Continuous Plankton Recorder (CPR) between 1948 and 1992 in the area bounded by 47-63°N and 10-30°W.
a: Mean length of time (D± 2 SE) that the species was present near the surface in each month. D: Index calculated from equation of Bailey (1981); the standard error (SE) of this standard deviation (i.e. measure of the accuracy with which D was estimated) was calculated after Sokal & Rohlf (1969).
b: Mean length of night in each month at 55°N (in hours).
Graphs in panels a and b reduced to zero mean and unit of variance to facilitate visual comparison.
Nota: The length of time spent near the surface varied seasonally and was closely correlated with seasonal change in length of night. |
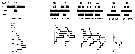 issued from : I.A. McLaren, M.J. Tremblay, C.J. Corkett & J.C. Roff in Can. J. Fish. Aquat. Sci., 1989, 46. [p.568, Fig.6]. issued from : I.A. McLaren, M.J. Tremblay, C.J. Corkett & J.C. Roff in Can. J. Fish. Aquat. Sci., 1989, 46. [p.568, Fig.6].
Annual cycle of Metridia lucens on Emerald Bank (43°30'N, 63°00'W), 1979-80.
Successive generations labelled Go, etc. For convenience, Nov. 1979 sample placed at end (after 1980). Upper panel: abundance as proportions of stages (AD: adults). Lower panel: size-frequencies of adult females.
The samples were obtained by vertical hauls from near bottom (usually 25 m) by Hensen-type nets (one of 0.250 mm mesh and the other of 0.064 mm mesh). |
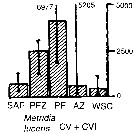 Issued from : A. Atkinson & J.D. Sinclair in Polar Biol., 2000, 23. [p.50, Fig.3] Issued from : A. Atkinson & J.D. Sinclair in Polar Biol., 2000, 23. [p.50, Fig.3]
Metridia lucens from Scotia Sea.
Median and interquartile ranges of copepods (nos /m2) in the five water zones; from north to south these are SAF Subantractic Front area, PFZ Polar frontal Zone, PF Polar Front area, AZ Antarctic Zone, WSC Weddell-Scotia Confluence area/ East Wind Drift.
Numbers on the plots are upper interquartiles where these could not be scaled. |
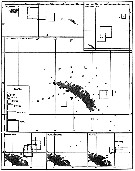 Issued from : A.C. Hardy & E.R. Gunther in Discovery Reports, 1935 (1936), 11. [p.174, Fig.81]. Issued from : A.C. Hardy & E.R. Gunther in Discovery Reports, 1935 (1936), 11. [p.174, Fig.81].
Charts showing the distribution of Metridia lucens in the upper layers of waters at stations in the 1926-7 surveys around South Georgia.
The squares represent the average numbers per 50 m vertical haul from 250 m (or less at shallow-water stations) to the surface with N 70 V nets. |
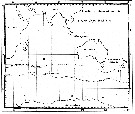 Issued from : C. Séret in Thesis 3ème Cycle, UPMC, Paris 6. 1979, Annexe. [p.43]. Issued from : C. Séret in Thesis 3ème Cycle, UPMC, Paris 6. 1979, Annexe. [p.43].
Geographical occurrences of Metridia lucens in the Indian Ocean and Antarctic zone. [after publications from: Brady, 1883, 1918; Thompson, 1900; Wolfenden, 1908, 1911; With , 1915; Rosendorn, 1917; Farran, 1929; Sewell, 1929, 1947; Brady & Gunther, 1935; Steuer, 1929, 1392, 1933; Ommaney, 1936; Vervoort, 1957; Tanaka, 1960; Brodsky, 1964; Seno, 1966; Andrews, 1966; Grice & Hulsemann, 1967; Seno, 1966; Frost & Fleminger, 1968; Voronina, 1970; Zverva, 1972].
Nota/b>: C. Séret notes the species around the Kerguelen Islands in 11 stations |
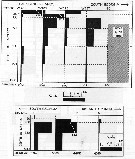 Issued from : A.C. Hardy & E.R. Gunther in Discovery Reports, 1935 (1936), 11. [p.178, Fig.83]. Issued from : A.C. Hardy & E.R. Gunther in Discovery Reports, 1935 (1936), 11. [p.178, Fig.83].
Vertical distribution of Metridia lucens at stations between the Falkland Islands and South Georgia February 1927 and between South Georgia and Tristan da Cunha February 1926.
The scale represents the numbers per 50 m vertical haul taken by a series of closing N 70 V nets.
Horizontal broken lines show the ranges of these vertical hauls. |
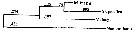 Issued from : A. Bucklin, B.W. Frost & T.D. Kocher in Mar. Biol., 1995, 121. [p.661, Fig.4]. Issued from : A. Bucklin, B.W. Frost & T.D. Kocher in Mar. Biol., 1995, 121. [p.661, Fig.4].
Phylogenetic relationships among three Metridia species based on sequence data for a 387 base pair region of the mitochondrial 16S rRNA gene and determined by neighbor joining (Saitou & Nei, 1987). Statistical methods for phylogenetic reconstruction are identical to those for calanus spp..
Numbers on horizontal branches are branch lengths; numbers at branchpoints (in iralics) are percentages of trees that show that branchpoint among 1000 bootstrapped replicates.
Nannocalanus is a outgroup by comparison.
M. pacifica from Dabob Bay, WA (Puget): 47°46'N, 122°50'W (B. Frost collector); M. lucens from Gulf of Maine (GOM): 42°30'N, 69°48'W (E. Durbin collector); M. longa from Gulf of St. Lawrence (STL): 48°40'N, 68°35'W ( J. Runge collector). |
 Issued from : M. Bode, A. Schukat, W. Hagen & H. Auel in J. Exp. Mar. Biol. Ecol., 2013, 444. [p.3, Table 1]. Issued from : M. Bode, A. Schukat, W. Hagen & H. Auel in J. Exp. Mar. Biol. Ecol., 2013, 444. [p.3, Table 1].
Dry mass, individual respiration rate and ETS activity from the northern Benguela Current upwelling system along transects at 23°S and 26°40'S, off Walvisbay and Lüderitz (Namibia).
Relationship between individual ETS activities and individual respiration rates; mean ETS activities with standard deviations are plotted again mean respiration rates (Cf. in Calanoides natalis. The letter besides each point identifies the associated species in Table 1 (f for this species) in the same authors.
Cf. Table 1: Dry mass, individual respiration rate and ETS activity. |
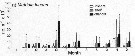 Issued from : M. Bode, A. Kreiner, A.K. van der Plas, D.C. Louw, R. Horaeb, H. Auel & W. Hagen in PoS ONE, 2014, 9 (5). [p.5, Fig.4g]. Metridia lucens Issued from : M. Bode, A. Kreiner, A.K. van der Plas, D.C. Louw, R. Horaeb, H. Auel & W. Hagen in PoS ONE, 2014, 9 (5). [p.5, Fig.4g]. Metridia lucens
Monthly means (±SD) of number of individuals (no) m-2 x 10³.
Copepods samples collected along transect at 20°S off Namibia starting in March 2005 (see map), using a WP2 net (200 µm mesh aperture) from 200 m (or less) to the surface from offshore to inshore.
Cf map and complementary informations in Calanoides natalis from the same authors (2014). |
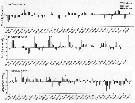 Issued from : M. Bode, A. Kreiner, A.K. van der Plas, D.C. Louw, R. Horaeb, H. Auel & W. Hagen in PLoS ONE, 2014, 9 (5). [p.6, Fig.5 a, b, f]. Issued from : M. Bode, A. Kreiner, A.K. van der Plas, D.C. Louw, R. Horaeb, H. Auel & W. Hagen in PLoS ONE, 2014, 9 (5). [p.6, Fig.5 a, b, f].
Log-transformed monthly anomalies between 2005 and 2011 of a) temperature at 10 m, b) chlorophyll a, and f) abundance of Metridia lucens (no. m2.
Cf. in Calanoides natalis map and remarks from the same authors. |
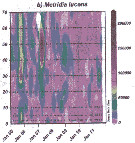 Issued from : M. Bode, A. Kreiner, A.K. van der Plas, D.C. Louw, R. Horaeb, H. Auel & W. Hagen in PLoS ONE, 2014, 9 (5). [p.9, Fig.9, b]. Issued from : M. Bode, A. Kreiner, A.K. van der Plas, D.C. Louw, R. Horaeb, H. Auel & W. Hagen in PLoS ONE, 2014, 9 (5). [p.9, Fig.9, b].
Monthly abundances (no. m-2, b) Metridia lucens.
Note patches in the spatial distributions along transect from inshore (0 nm) and offshore (70 nm) (See map).
Compare with Calanoides natalis, Nannocalanus minor, Rhincalanus nasutus from the same authors. |
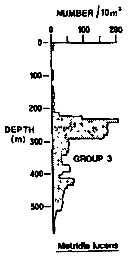 Issued from : R.K. Pipe & S.H. Coombs in J. Plankton Res., 1980, 2 (3). [p.230, Fig.4]. Issued from : R.K. Pipe & S.H. Coombs in J. Plankton Res., 1980, 2 (3). [p.230, Fig.4].
Metridia lucens from Wyville Thomson Ridge (60°03.4' N, 07°03.9' W to 60°08' N, 07°02.9' W on 24 April 1978): Vertical distribution.
Members of this group (Group 3) contained six of the most abundant taxa and would not be associated with a single water mass. This species was found in and just above Norwegian Sea Deep water with the main peak in mid-depths; that is, in North Atlantic Oceanic water. |
| | | | Loc: | | | Cosmopolite: Antarct. (Peninsula, Scotia Sea, SW Atlant., Indian, SW & SE Pacif.), Strait of Magellan, Mallaganes region, sub-Antarct. (Drake Passage, SW Atlant., Scotia Sea, off Prince Edward Is., Indian, SW & SE Pacif.), Benguela Current, South Africa (E & W, STC region), Namibia, Patagonia, Argentina, off Orenoque, off Rio de Janeiro, off Morocco-Mauritania, Canary Is., off Madeira, Ibero-moroccan Bay, Portugal, off W Cape Finisterre, NW Spain (Vigo-Santander), Bay of Biscay, Sargasso Sea, off Bermuda: Station ‘’ S’’ (32°10’N, 64°30’W), off Cape Hatteras, Delaware Bay (outside), Chesapeake Bay, Cape Cod, off SE Cape Cod, Long Island Sound, G. of Maine, Woods Hole, Massachusetts Bay, Bay of Fundy, Halifax, Bedford Basin, Shédiac Bay, Northumberland Strait, G. of St. Lawrence, off SE & SW Nova Scotia, Labrador Sea, Davis Strait, Godthaab Fjord (W Greenland), Greenland Sea, Fram Strait, Kongsfjorden, Newfoundland, Iceland, Greenland Sea, Faroe Is., Norwegian Sea, S Norway (Raunefjorden, Kordfjorden, Malangen fjord), Nordvestbanken, Wyville Thomson Ridge, Barents Sea, Nansen Basin, Pechora Sea, NE Scotland, North Sea, Ireland, Scottish coasts, Morey Firth, off SW Ireland, Celtic Sea, Irish Sea (off Is. of Man SW, Galway Bay), Bristol Channel, English Channel, Strait of Dover, Medit. (Alboran Sea, Aegean Sea, Marmara Sea, Black Sea), G. of Suez, Red Sea, Indian, S Indian (subtropical convergence), Burma, Philippines, S Korea, Japan (Oyashio region, Kuroshio extension, off Hokkaido), Okhotsk Sea, Chukchi Sea, Beaufort Sea, Alutian, Alaska, NE Pacif., Station ''P'', British Columbia, Vancouver Is., Dabob Bay, Oregon (Yaquina, off Newport), California, Santa Monica Basin, off NE Hawaii, G. of Panama, New Zealand (Kaikoura, South, sub-Antarct.), S Pacif. (NPFZ), off W Kermadec Is., off Galapagos, off Peru, Chile (N-S, off Valparaiso, off Santiago, Concepcion), Mejillones Peninsula), Straits of Magellan, Ushuaia | | | | N: | 288 | | | | Lg.: | | | (25) F: 2,93-2,25; M: 1,8-1,62; (35) F: 2,96-2,5; (38) F: 2,49-2,4; M: 1,92-1,8; (45) F: 3-2,5; M: 2,5-2; (46) F: 2,85-2,45; M: 2; (65) F: 2,5; M: 2,3; (72) F: 2,78-2,68; (91) F: 4-2,5; M: 3-2; (116) F: 2,16; M: 1,82; 1,5; (142) F: 3,2; (188) F: 2,85-2,45; M: 2; (199) F: 2,28-1,9; (246) F: 3,02-2,22; (254) F: ± 2,9; M: 2,25; ? (377) F: 3,59; M: 2,25; (432) F: 2,9-2,37; (786) F: 2,92-2,24; M: 1,83-1,78; (909) F: 2,07-2,88; M: 1,85-2,22; (1108) F: 1,98-2,5; M: 1,54-1,78; {F: 1,90-4,00; M: 1,50-3,00}
The mean female size is 2.613 mm (n = 32; SD = 0.4197), and the mean male size is 1.998 mm (n = 20; SD = 0.3857). The size ratio (male : female) is 0.79 (n = 11; SD = 0.0938). | | | | Rem.: | épi-mésopélagique-Nathypelaqique.
Sampling depth (Antarct., sub-Antarct.) : 0-1000 m. Dans une pêche verticale 2000-1000 m (talus continental) et 4000-3000 m (en pleine mer des Sargasses) (Harding, 1974).
Une certaine confusion existe entre cette espèce et M. pacifica. Fleminger (1967 a) estime qu'il y a synonymie entre cette espèce et M. pacifica; See remarks in Mazzocchi & al. (1995, p.51).Cf. commentaire détaillée in Bradford-Grieve (1999 b, p.115-116).
La présence de cette espèce semble sporadique en Antarctique.
Voir aussi les remarques en anglais | | | Dernière mise à jour : 25/10/2022 | |
|
|
 Toute utilisation de ce site pour une publication sera mentionnée avec la référence suivante : Toute utilisation de ce site pour une publication sera mentionnée avec la référence suivante :
Razouls C., Desreumaux N., Kouwenberg J. et de Bovée F., 2005-2026. - Biodiversité des Copépodes planctoniques marins (morphologie, répartition géographique et données biologiques). Sorbonne Université, CNRS. Disponible sur http://copepodes.obs-banyuls.fr [Accédé le 15 juin 2026] © copyright 2005-2026 Sorbonne Université, CNRS
|
|
|
|




;)
;)
;)
;)
;)
;)
;)
;)
;)
;)
;)
;)
;)
;)
;)
;)
;)
;)
;)
;)
;)
;)
;)
;)
;)
;)
;)
;)
;)

;)
;)
;)
;)
;)
;)
;)
;)
;)
;)
;)
;)
;)
;)
;)
;)
;)
;)