|
|
 |
Fiche d'espèce de Copépode |
|
|
Calanoida ( Ordre ) |
|
|
|
Calanoidea ( Superfamille ) |
|
|
|
Calanidae ( Famille ) |
|
|
|
Calanus ( Genre ) |
|
|
| |
Calanus sinicus Brodsky, 1965 (F,M) | |
| | | | | | | Syn.: | Calanus pacificus Brodsky, 1948 (part.); 1950 (1967) (part., p.90, figs.F,M); Shen & Bai, 1956 (part., p.218, Pl.I: figs.1-3: F);
Calanus finmarchicus : Mori, 1929; Tanaka, 1956 (p.252, small forms); Furuhashi, 1966 a (p.295, vertical distribution vs mixing Oyashio/Kuroshio region);
Calanus finmarchicus sinicus : Kun, 1969 (p.995, fig.F, Rem., chart);
Calanus pacificus japonicus : Yamada, 1971;
? Calanus syunpuensis Kurasige, 1931 (p.221, figs.F);
Calanus helgolandicus : Mori, 1937 (1964) (p.14, figs.F,M); ? Anraku & Azeta, 1965 (p.13, Table 2, fish predator) | | | | Ref.: | | | Brodsky, 1962 a (p.1416, nomen nudum ); Chen & Zhang, 1965 (p.26, figs.F,M); Brodsky, 1965 (p.2, 5); 1972 (1975) (p.9, 66, 82, 118, figs.); Bradford & Jillett, 1974 (p.6); Jaschnov, 1975 (p.34, figs.F,M); Vyshkvartzeva, 1976 (p.14); 1977 a (p.97, figs.); Li & Fang, 1983 (p.110, figs.juv.); Brodsky & al., 1983 (p.170, figs.F, M, Rem.); van der Spoel & Heyman, 1983 (p.62, fig.79); Bradford, 1988 (p.74, 76, Rem.); Nishida, 1989 (p.173, table 2, 3, dorsal hump); Zheng Zhong & al., 1984 (1989) (p.225, figs.F,M); Hirose & al., 1992 (p.186, egg, ultrastucture); Hulsemann, 1994 (p.1462, figs. F,M, Rem.); Bucklin & al., 1995 (p.658); Chihara & Murano, 1997 (p.739, Pl.67: F,M); Hill & al., 2001 (p.279, fig.2: phylogeny); Tan & al., 2003 (p.87, Rem.: molecular biology); Nishida & Nonomura, 2011 (p.801, figs. F, Rem.: caudal exocrine glands); Minxiao & al., 2011 (p.1, mitochondrial genome, phylogeneticrelationship); Kozol & al., 2012 (p.1, genetic analysis, Rem.); Zhang H. & al., 2013 (p.57, RNA-extraction method); Kim S. & al., 2013 (p.64, fig.3: mitochondrial genome); Ning & al., 2013 (p.1, transcriptome sequencing); Blanco-Bercial & al., 2014 (p.5: Rem.: problematic taxa); Zhou & al., 2016 (p.551, size, gonad development, metabolism vs genetic, ); Choquet & al., 2017 (p.506, fig.1, phylogeny) | 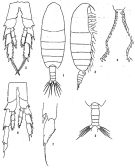 issued from: Q.-c Chen & S.-z. Zhang in Studia Marina Sinica, 1965, 7. [Pl.1, 1-7]. Female (from E China Sea): 1, habitus (dorsal); 2, idem (lateral right side); 3, P5 (posterior); 4, serrate inner margin of 1st basipod of P5. Male: 5, urosome (dorsal); 6, P5 (posterior); 7, distal segment of exopod of left P5.
|
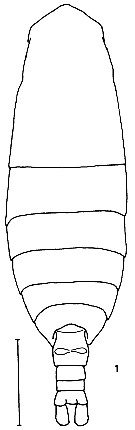 issued from K. Hulsemann in Invert. Taxon., 1994, 8. [p.1463, Fig.1]. Female: (from NW Pacific): 1, habitus (dorsal). Scale bar = 0.5 mm.
|
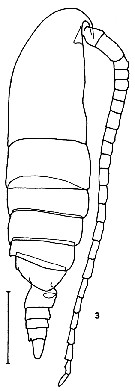 issued from K. Hulsemann in Invert. Taxon., 1994, 8. [p.1464, Fig.3]. Female: (from NW Pacific): 2, habitus (lateral). Scale bar = 0.5 mm.
|
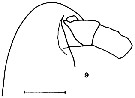 issued from K. Hulsemann in Invert. Taxon., 1994, 8. [p.1466, Fig.9]. Female: (from NW Pacific): 9, forehead (lateral). Scale bar = 0.2 mm.
|
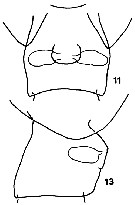 issued from K. Hulsemann in Invert. Taxon., 1994, 8. [p.1467, Figs.11, 13]. Female: (from NW Pacific): 11, genital segment (ventral); 13, idem (lateral).
|
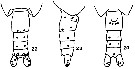 issued from K. Hulsemann in Invert. Taxon., 1994, 8. [p.1476, Figs.22-24]. Female: (from NW Pacific), schematic, showing sites of integumental organs: 22, urosome (dorsal); 23, idem (lateral); 24, idem (ventral). Filled circle: 100 % presence; open circle: 95-99 % presence; triangle: 40-49 % presence; dot: 30 % or less presence. n = 53.
|
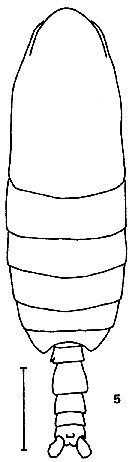 issued from K. Hulsemann in Invert. Taxon., 1994, 8. [p.1465, Fig.5]. Male: (from NW Pacific): 5, habitus (dorsal). Scale bar = 0.5 mm.
|
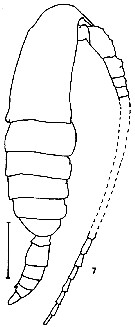 issued from K. Hulsemann in Invert. Taxon., 1994, 8. [p.1466, Fig.7]. Male: (from NW Pacific): 7, habitus (lateral. Scale bar = 0.5 mm.
|
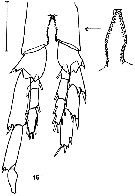 issued from K. Hulsemann in Invert. Taxon., 1994, 8. [p.1468, Fig.15]. Male: (from NW Pacific): 15, P5 (posterior). Scale bar = 0.2 mm.
|
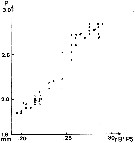 issued from K. Hulsemann in Invert. Taxon., 1994, 8. [p.1471, Fig.17]. length of 1st basal segment of right P5 (bB1P5) plotted against prosome (P) length of males of Calanus sinicus (open circles) and C. jashnovi (filled circles). n = 23.
|
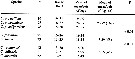 issued from : K. Hulsemann in Invert. Taxon., 1994, 8. [p.1470, Table 2]. Number of teeth on inner margin of 1st basipodal segment of P5 males of Pacific and southern Calanus species.
|
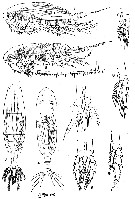 issued from : T. Mori in The pelagic Copepoda from the neighbouring waters of Japan, 1937 (1964). [Pl.1, Figs.1-9]. As . After Hulsemann, 1994 (p.1462).
Female: 1, habitus (lateral); 3, idem (dorsal); 6, P5; 7, P1; 8, P2; 9, P3.
Male: 2, habitus (lateral); 4, idem (dorsal); 5, P5.
|
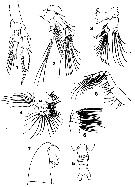 issued from : T. Mori in The pelagic Copepoda from the neighbouring waters of Japan, 1937 (1964). [Pl.2, Figs.1-8]. As Calanus helgolandicus. After Hulsemann, 1994 (p.1462). Female: 1, P4; 2, A2; 3, Md; 4, Mx1; 5, urosome (ventral); 6, Mx2; 7, head (lateral); 8, Mxp.
|
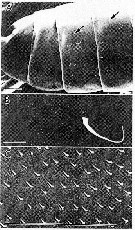 issued from : S. Ohtsuka & R. Huys in Hydrobiologia, 2001, 453/454. [p.451, Fig.6]. Female (from Japan): A, pedigers 2-5, lateral, dorsolateral patch of minute ridges arrowed (not clearly seen in pedigers 4 and 5, but similar patches present); B, dorsolateral patch of minute ridges on pediger 3; C, magnification of dorsolateral ridges. Scale bars: 0.1 mm (A, B); 0.001 mm (C).
|
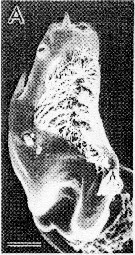 issued from : S. Ohtsuka & R. Huys in Hydrobiologia, 2001, 453/454. [p.452, Fig.7, A]. Male (from Japan): A, terminal exopodal segment of left P5. Scale bar 0.1 m. Nota: The male may scrape off an empty spermatophore, and the terminal serrated and ridged processes on the 2nd exopodal segment of left P5, compensate for the loss of the female P5.
|
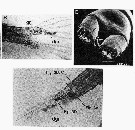 issued from : S. Nishida & T. Nonomura in J. Mar. Biol. Ass. U.K., 2011, 91 (4). [p.801, fig.1, B, D; 802, fig.2]. Female (adult from Sagami Bay): Fig.1 (above); B, posterior urosomal somites and caudal rami (dorsal), showing inner and outer glands, granules in inner gland (gr) and discharged granules (dgr); D, anal segment and caudal rami (ventral), showing pores of inner gland (black arrows) and outer gland (white arrows). Fig. (below): abdominal somites and caudal rami (lateral), showing granules in inner gland and discharged granules (dgr). Lines indicate locations of cross-section for histological analysis (see in publication fig.3). Light microscopy in Fig.1 B; Scanning electron microscopy photograph in D and fig.2. Nota: The mechanical disturbance of the live specimens kept in seawater failled to excite luminescence from the copepods. No autofluorescence was observed from the caudal glands of live specimens under UV excitation. Alternative possible functions include secretion of defensive substances (predator avoidance) or substances that might enhance swarm formation and/or the possible functions of the glands for egg and sex pheromone. A survey of preserved copepod collections indicated presence of similar glands in others species in Calanus, Cosmocalanus, Mesocalanus and Nannocalanus genera.
|
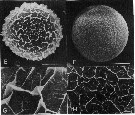 issued from : H. Toda & E. Hirose Scanning electron micrographs of two types of Calanus sinicus eggs.
E-G: egg A-type; F-H: egg B-type.
Nota: Egg A-type:(diameter: average 0.175 mm, range = 0.157-0.187, C/N ratio : 4.6). Egg B-type: diameter: 0.165 mm, range = 0.158-0.173, C/N ratio: 5.10.
Both types of eggs started to develop immediately after release, and hatched into nauplii within one day;
A-type eggs observed were similar to the eggs of Calanus from Tromsø reported by marshall & Orr (1955), whereas B-type eggs resembled those of calanus helgolandicus. The bulky blister observed in A-type eggs would correspond to the outer membrane mentioned in their book.. No intermediate form of eggs between these two types appear.
|
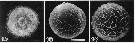 Issued from : E. Hirose, H. Toda, Y. Saito & H. Watanabe in J. Crustacean Biol., 1992, 12 (2). [p.187, Fig.1] Fertilization envelope in the embryo of Calanus sinicus (from 34°37'N, 138°57'E). 1A: blastula embryo with fully developed envelope (phase contrast); 1B: developing blister (SEM); 1C: developed blister (SEM). Scale bar = 50 µ.
|
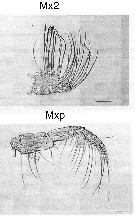 Issued from : M. Sano, K. Maki, Y. Nishibe, T. Nagata & S. Nishida in Progr. Oceanogr., 2013, 110. [p.19, Figs. 8 i, 9 i]. Second maxilla (Mx2) and maxilliped (Mxp) for Calanus sinicus from Sagami Bay (Japan) in April 2009. Scale bars: Mx2 & Mxp = 200 µm. Compare appendage structure and setal armement with Euchirella rostrata, Undeuchaeta major, Chirundina streetsii, Scaphocalanus echinatus, Spinocalanus magnus, Scottocalanus securifrons, Pleuromamma xiphias for interpreted particles catching..
|
 Issued from : K.A. Brodsky, N.V. Vyshkvartzeva, M.S. Kos & E.L. Markhaseva in Opred. Faune SSSR, 1983, 135. [p.172, Fig.75]. Female and male (after Brodsky, 1965 and 1972).
|
 Issued from : K.A. Brodsky, N.V. Vyshkvartzeva, M.S. Kos & E.L. Markhaseva in Opred. Faune SSSR, 1983, 135. [p.173, Fig.75 (continuation)]. Female and male.
|
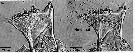 Issued from : K. Zhou, S. Sun, M. Wang, S. Wang & C. Li in Plankton Res., 2016, 38 (3). [p.557, Fig. 6]. calanus sinicus Jaw phase morphology of C5s: (a) pre-apolysis at station E6; (b) post-apolysis at station P1, with the mandibular citicle separated from the epidermis (new tooth formingt). Scale bars: 20 µm. Station E6: 35°N, 123°E (corresponding to Yellow Sea Cold Water Mass, denoted with the boundary defined by the 10°C bottom isotherm.; P1: 30°.5 N, 123°E. About 15% of C5 stage with post-apolysis jaws had begun apolysis at station P1, indicating molt preparation, whereas none were found at station E6
| | | | | Ref. compl.: | | | Brodsky, 1972 (p.256); Omori, 1978 a (p.261, Table 1, 2, 3: chemical composition); Chen Q-c, 1980 (p.794); Hirota, 1981 (p.19, Table 1, length-weight-CHN); Uye S-i., 1982 (p.149, relation length-weight-C-N); Lin & Li, 1984 (p.111, annual cycle); McLaren & al., 1988 (p.275, Table 3: DNA content), Uye, 1988 (p.285, temperature vs growth, development); Wang X; & al., 1988 (p.173, length-weight-CHN contents); Giguère & al., 1989 (p.522, Table 1, formaldehyde preservation); Uye & al. 1990 (p.389, ontogenic vertical migration); Hirakawa & al., 1990 (tab.3); Yoo, 1991 (tab.1); Hirakawa, 1991 (p.373); Toda & Hirose, 1991 (p.613, figs. eggs, ultrastructure); Dai & al., 1991 (p.47, tab.1); Huntley & Lopez, 1992 (p.201, Table A1, egg-adult weight, temperature-dependent production); He & al., 1992 (p.250); Hwang & Choi, 1993 (tab.3); Huang & al., 1993 (p.1229); Huang & al., 1993 a (p.289, ontogenic diel vertical migration); Myung & al., 1994 (tab.1); Uye & Kaname, 1994 (p.43, length vs. fecal pellet volume); Hirakawa & al., 1995 (tab.2); Shih & Young, 1995 (p.68); Kotani & al., 1996 (tab.2); Go & al., 1997 (tab.1); Park & Choi, 1997 (Appendix); Mauchline, 1998 (p.506); Hwang & al., 1998 (tab.II); Hsieh & Chiu, 1998 (tab.2); Wong & al, 1998 (tab.2); Noda & al., 1998 (p.55, Table 3, occurrence); Dolganova & al., 1999 (p.13, tab.1); Uye, 2000 (p.1850, distribution); Huggett & Richardson, 2000 (p.1843, tab.2); Hunt & al., 2001 (p.374, tab.1, 2); Lo & al., 2001 (1139, tab.I); Wang & al., 2003 (p.169, occurrence vs. hydrological condition); Liu & al., 2003 (p.291, abundance vs. tidal front); Hsieh & al. 2004 (p.396, tab. 1, p.399, tab.2); Lan & al., 2004 (p.332, tab.1, tab.2); Kang & al., 2004 (p.1525); Lo & al., 2004 (p.89, tab.1); C. Li & al., 2004 (p.149, feeding, respiration); Pu & al., 2004 (p.1, effects temperature, food supply); Pu & al., 2004 (p.1059, life history); Wang & Zuo, 2004 (p.1, Table 2, dominance, origin); Yoshida & al., 2004 (p. 505, vertical migration vs light intensity ); Shimode & al., 2005 (p.113 + poster); Zhang G.-T. & al., 2005 (p.135, seasonal reproduction vs. body size); Zuo & al., 2006 (p.162: tab.1, fig.9, spatial abundance); Hwang & al., 2006 (p.943, tab.I); Zhang W & al., 2006 (p.553, Table 2, grazing rates); Wang M.-h & al., 2007 (p.679, trophic transfer); Zhang G.-T. & al., 2007 (p.179, reproduction); Dur & al., 2007 (p.197, Table IV); Kang J.-H. & al., 2007 (p.82, fig.2, temporal variation vs. temperature & predation effect); Ohtsuka & al., 2008 (p.115, Table 4, 5); Zuo & al., 2008 (p.1174, figs.3, 4, abundance, fig.8: stations group); Huo Y.-Z. & al., 2008 (p.723, feeding, egg production); Yoshiki & al., 2008 (p.97, nauplius vs pressure); Lan Y.C. & al., 2008 (p.61, Table 1, % vs stations, Table 2: indicator species, Rem.: p.71); Tseng L.-C. & al., 2008 (p.153, Table 2, fig.5, occurrence vs geographic distribution, indicator species); Tseng L.-C. & al., 2008 (p.46, table 2, abundance vs moonsons, table 3: indicator species); C.-Y. Lee & al., 2009 (p.151, Tab.2); Zhang W & al., 2009 (p.261, table 2); Lan Y.-C. & al., 2009 (p.1, Table 2, % vs hydrogaphic conditions); Jiang Z.-B. & al., 2009 (p.196, Table 1, 2); Hwang & al., 2009 (p.49, fig.4, 5); Wang & al., 2009 (p.123, reproduction); Zhang G.-T. & al., 2010 (p.492, Table 1, 2); Sun & al., 2010 (p.1006, Table 2); Chen M.-R. & al., 2010 (p.851, feeding); Zhang G.-T. & Wong, 2011 (p.277, fig.7, indicator); Zhaoli & al., 2011 (p.84, interannual abundance); Chen H; & al., 2011 (p.84, spatial & temporal variations); Itoh & al., 2011 (p.129, vertical distribution); Zhang D. & al., 2011 (p.86, pH effects); Yin & al., 2011 (p.1447, abundance vs distribution & season); Gao X. & al., 2011 (p.591, p.597: occurrence); Guo & al., 2011 (p.567, fig.9, table 2, abundance vs spatial distribution; indicator); Yoshiki & al., 2011 (p.63, egg production, development vs pressure); Kâ & Hwang, 2011 (p.155, Table 3: occurrence %); Hsiao & al., 2011 (p.317, Table 2, 3, fig.6, indicator of seasonal change); Beltrao & al., 2011 (p.47, Table 1, 3, density vs time); Tseng & al., 2012 (p.621, Table 3: abundance); Chen M.-R. & al., 2012 (p.14, behaviour vs food & light); Huo & al., 2012 (p.1, Table 1: dominance); Lee D.B. & al., 2012 (p.88, co-occurrence, abundance, feeding); Youn & al., 2012 (p.33, seasonal composition); Lee J. & al., 2012 (p.95, Table 2: abundance, annual & seasonal distribution); Jang M.-C & al., 2012 (p.37, abundance and seasonal distribution); Moon & al., 2012 (p.1, Table 1); Li C. & al., 2013 (p.101, feeding); Ning & al., 2013 (p.109, RNA:DNA ratios, distibution geographic); Tachibana & al., 2013 (p.545, Table 1, seasonal change 2006-2008); Tseng & al., 2013 (p.507, seasonal abundance); Hirai & al., 2013 (p.1, Table I, molecular marker); Sano & al., 2013 (p.11, Table 2, figs.5, 8, 9, feeding habits, vertical distribution); Suzuki, K.W. & al., 2013 (p.15, Table 2, 3, 4, estuaries, annual occurrence); Seo & al., 2013 (p.448, Table 1, occurrence); Park E.-O. & al., 2013 (p.165, Fig.5, distribution vs stations); Oh H-J. & al., 2013 (p.192, Table 1, occurrence); Wiacek & al., 2013 (p.78, protein vs environmental changes); Barton & al., 2013 (p.522, Table 1: metabolism, population dynamic, feeding mode, biogeo); Hwang & al., 2014 (p.43, Appendix A: seasonal abundance); Ohtsuka & Nishida, 2017 (p.565, 578, Table 22.1); Record & al., 2018 (p.2238, Table 1: diapause); Hirai & al., 2020 (p.1, Fig. 5: cluster analysis (OTU), spatial distribution). | | | | NZ: | 3 | | |
|
Carte de distribution de Calanus sinicus par zones géographiques
|
| | | | | | 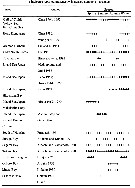 issued from K. Hulsemann in Invert. Taxon., 1994, 8. [p.1473, Table 3]. issued from K. Hulsemann in Invert. Taxon., 1994, 8. [p.1473, Table 3].
Seasonal occurrence of in NW Pacific Ocean. |
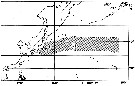 issued from : K. Hulsemann in Invert. Taxon., 1994, 8. [p.1474, Fig.18] issued from : K. Hulsemann in Invert. Taxon., 1994, 8. [p.1474, Fig.18]
Distribution of calanus sinicus (unshaded) and C. jashnovi (shaded) in the NW Pacific Ocean. Type localities of C. sinicus (1) and C. jashnovi (2). |
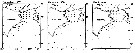
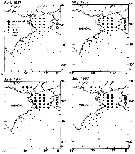 issued from : C. Huang, S. Uye & T. Onbé in J. Plankton Res., 1993, 15 (11). [p.1234, Fig.3]. issued from : C. Huang, S. Uye & T. Onbé in J. Plankton Res., 1993, 15 (11). [p.1234, Fig.3].
Monthly change in geographical distribution of copepodites and adults in Kii Channel and its neighboring waters (Inland Sea of Japan to the Pacific Ocean).
Nota: In the Inland Sea of Japan, this species is the second most important component following Paracalanus sp. in terms of biomass and production (see in Uye & al., 1986). The species occurred throughout the year in the study area. This means that the reproduction takes place continuously and the population is devoid of diapause in the seasonal life cycle. This species is regarded as one of the most important components of zooplankton in the shelf waters by virtue of its enormous abundance and large body size, and plays a significant role in the conversion of primary production into diet for carnivores, including fishes. |
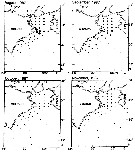 issued from : C. Huang, S. Uye & T. Onbé in J. Plankton Res., 1993, 15 (11). [p.1235, Fig.3 continued]. issued from : C. Huang, S. Uye & T. Onbé in J. Plankton Res., 1993, 15 (11). [p.1235, Fig.3 continued].
Monthly change in geographical distribution of copepodites and adults in Kii Channel and its neighboring waters (Inland Sea of Japan to the Pacific Ocean). |
 issued from : C. Huang, S. Uye & T. Onbé in J. Plankton Res., 1993, 15 (11). [p.1236, Fig.3 continued]. issued from : C. Huang, S. Uye & T. Onbé in J. Plankton Res., 1993, 15 (11). [p.1236, Fig.3 continued].
Monthly change in geographical distribution of copepodites and adults in Kii Channel and its neighboring waters (Inland Sea of Japan to the Pacific Ocean). |
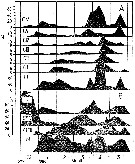 issued from : Y. Lin & S. Li in J. Xiamen Univ. (Nat. Sci.), 1984, 23 (1). [p.112, Fig.1]. issued from : Y. Lin & S. Li in J. Xiamen Univ. (Nat. Sci.), 1984, 23 (1). [p.112, Fig.1].
Life cycle of Calanus sinicus at Xiamen Harbour (24°26'N, 118°10'E).
A: Annual abundance of different life stages from nauplius to adults. N = number per cubic meter.
B: percentage of different life stages, naumlius (N) copepodids and adults. |
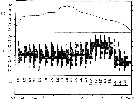 issued from : Y. Lin & S. Li in J. Xiamen Univ. (Nat. Sci.), 1984, 23 (1). [p.114, Fig.3]. issued from : Y. Lin & S. Li in J. Xiamen Univ. (Nat. Sci.), 1984, 23 (1). [p.114, Fig.3].
Annual cycle of temperature (T °C), different classes of size of prosome of adult females (D), prosome mean lengths of adult females (Lg) at Xiamen Harbour during November 1979 to June 1980.
Nota: It is concuded from analysis of the age composition, adult sexual ratio and female cephalothorax lengths that there is three main breeding periods, i-e 3 generations in the harbour (Dec.-mid-Feb., end of Mar.-Apr. and Mid-May, respectively.
The first generation was reproduced by the immigrating population in the coastal current in winter, the 2nd generation was produced by the previous generation in spring and the 3rd generation's nauplii disappeared at the begining of June.
Water temperature (T) seems to be dominant factor affecting generation lengths and female cephalothorax lengths (Lg). A negative relationship was found between T & Lg. Lg = - 0.0666 T + 3.3718 with r = - 0.8764. |
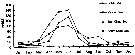 Issued from : R. Wang, T. Zuo & K.E. Wang in J. Plankton Res., 2003, 25 (2). [p.170, Fig.1]. Issued from : R. Wang, T. Zuo & K.E. Wang in J. Plankton Res., 2003, 25 (2). [p.170, Fig.1].
Seasonal variation in abundance of C. sinicus in the Bohai Sea, Yellow Sea, East China Sea and South China Sea [redrawn from Anon, 1977]. |
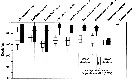 Issued from : M. Sano, K. Maki, Y. Nishibe, T. Nagata & S. Nishida in Progr. Oceanogr., 2013, 110. [p.20, Fig.10]. Issued from : M. Sano, K. Maki, Y. Nishibe, T. Nagata & S. Nishida in Progr. Oceanogr., 2013, 110. [p.20, Fig.10].
Vertical distribution of eight copepod species across 0-1000 m in Sagami bay in 21-27 April 2009.
White and black boxes denote daytime and nighttime distributions. Scaphocalanus echinatus is taken from Kuriyama & Nishida (2006).
Plankton and water samples collected from a fixed station (35°00'N, 139°20'E) using MTD horizontal closing nets (0.33 mm mesh aperture) at 15 depths (0, 50, 95, 100, 150, 195, 200, 295, 300, 395, 400, 500, 600, 800, 1000 m) during both day and night.
Atomic C:N ratio (mean ± SD) = 5.6 ±0.4, n = 3. |
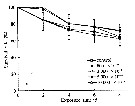 Issued from : D. Zhang, S. Li, G. Wang & D. Guo in Acta Oceanol. Sin., 2011, 30 (6). [p.89, Fig. 1 a]. Issued from : D. Zhang, S. Li, G. Wang & D. Guo in Acta Oceanol. Sin., 2011, 30 (6). [p.89, Fig. 1 a].
Influence of seawater acidification on survival rate in Calanus sinicus.
Average pH of each pCO2 seawater culture. Control (380) 8.16-8.17; (800) : 7.84-7.85; (2000): 7.39-7.37; (5000): 7.19-7.24; (10 000): 6.92-6.94. |
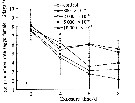 Issued from : D. Zhang, S. Li, G. Wang & D. Guo in Acta Oceanol. Sin., 2011, 30 (6). [p.90, Fig. 2 a]. Issued from : D. Zhang, S. Li, G. Wang & D. Guo in Acta Oceanol. Sin., 2011, 30 (6). [p.90, Fig. 2 a].
Influence of seawater acidification on egg producton rate in Calanus sinicus.
Average pH of each pCO2 seawater culture. Control (380) 8.16-8.17; (800) : 7.84-7.85; (2000): 7.39-7.37; (5000): 7.19-7.24; (10 000): 6.92-6.94. |
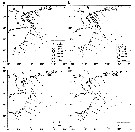 Issued from : J. Yin, L. Huang, K. Li, S. Lian, C. Li & Q. Lin in Continental Shelf Res., 2011, 31. [p.1453, Fig.8]. Issued from : J. Yin, L. Huang, K. Li, S. Lian, C. Li & Q. Lin in Continental Shelf Res., 2011, 31. [p.1453, Fig.8].
Abundance distribution of Calanus sinicus (ind. m3) in the northwest continental shelf between Hainan Island and Leizhou Peninsula (South China). a- spring; b- summer; c- autumn; d- winter.
C. sinicus was identified to the level of the copepodites stages of CIV and CV and adults.
Nota: C. sinicus made up 34.28% and 12.34% of all copepods in spring and summer, respectively |
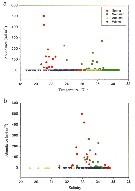 Issued from : J. Yin, L. Huang, K. Li, S. Lian, C. Li & Q. Lin in Continental Shelf Res., 2011, 31. [p.1454, Fig.10]. Issued from : J. Yin, L. Huang, K. Li, S. Lian, C. Li & Q. Lin in Continental Shelf Res., 2011, 31. [p.1454, Fig.10].
Abundance of Calanus sinicus in relation to surface temperature (a) and salinity (b). |
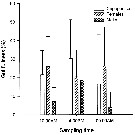 Issued from : M.-R. Chen, S. Kâ & H.-S. Hwang in Crustaceana, 2010, 83 (7). [p.855, Fig.1]. Issued from : M.-R. Chen, S. Kâ & H.-S. Hwang in Crustaceana, 2010, 83 (7). [p.855, Fig.1].
Gut fullness of copepodites (CV), females and males of Calanus sinicus in the morning (10:00 AM), afternoon (4:00 PM), and at midnight (00:00 AM) in northern coastal waters of Taiwan during the northeast monsoon.
Error bar shows SD. |
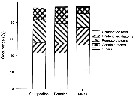 Issued from : M.-R. Chen, S. Kâ & H.-S. Hwang in Crustaceana, 2010, 83 (7). [p.855, Fig.2]. Issued from : M.-R. Chen, S. Kâ & H.-S. Hwang in Crustaceana, 2010, 83 (7). [p.855, Fig.2].
Total food composition of copepodites (CV), females and males of Calanus sinicus in northern coastal waters of Taiwan during the northeast monsoon. |
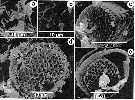 Issued from : M.-R. Chen, S. Kâ & H.-S. Hwang in Crustaceana, 2010, 83 (7). [p.858, Fig.4]. Issued from : M.-R. Chen, S. Kâ & H.-S. Hwang in Crustaceana, 2010, 83 (7). [p.858, Fig.4].
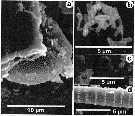
Scanning electron micrographs (SEM) of gut contents of Calanus sinicus showing: a, fragments of Thalassiothrix sp. (pennate diatom); b, spins of Chaetoceros spp. (centric diatom); c, Delphineis surirella (pennate diatom); d, Coscinodiscus sp. (centric diatom); e, Thalassiosira sp. (small centric diatom). |
 Issued from : M.-R. Chen, S. Kâ & H.-S. Hwang in Crustaceana, 2010, 83 (7). [p.859, Fig.5]. Issued from : M.-R. Chen, S. Kâ & H.-S. Hwang in Crustaceana, 2010, 83 (7). [p.859, Fig.5].
Scanning electron micrographs (SEM) of gut contents of Calanus sinicus showing: a, fragment of a dinoflagellate; b, Bacillus; c, fragment of a coccolith; d, spins of the protozoan, Sticholonche zanclea. |
 Issued from : T. Yoshiki, T. Ono, A. Shimizu & T. Toda in Mar. Ecol. Orog. Ser., 2011, 430. [p.69, Fig.5 a]. Issued from : T. Yoshiki, T. Ono, A. Shimizu & T. Toda in Mar. Ecol. Orog. Ser., 2011, 430. [p.69, Fig.5 a].
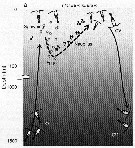
Depth ranges experienced during early life stages (from egg to nauplius; dotted line).
Nota: Yoshiki & al. (2006) previously examined the effects of hydrostatic pressure on the egg development time and hatching success of calanus sinicus. Although egg development time was not influenced by hydrostatic pressure, the egg hatching success rate decreased with increasing pressure. Unhatched eggs were still alive after being removed from the pressure chamber after exposure to elevated pressure, and they subsequently died without hatching even though nauplii had formed in the eggs. Also, even when eggs hatched under high-pressure conditions, most nauplii showed abnormalities (Yoshiki & al., 2006; 2008). |
 Issued from : T. Yoshiki, T. Toda, T. Yoshida & A. Shimizu in J. Plankton Res., 2006. [p.567, Fig. 5]. Issued from : T. Yoshiki, T. Toda, T. Yoshida & A. Shimizu in J. Plankton Res., 2006. [p.567, Fig. 5].
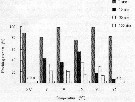
Hatching success of em eggs. [Adult females collected off the coast of Manazuru Peninsula (35°09'55''N: 139°10'78''E)].
Nota: The hatching success of C. sinicus eggs at 1 arm was generally higher than 80% within the temperature range from 5 to 25°C. Under higher pressure conditions at 10, 50
, and 100 atm, the hatching successes ranged from 0 to 55, from 0 to 36, and from 0 to 21%, respectively. Highly significant decreases in egg hatching success occurred as pressure increased. |
 Issued from : T. Yoshiki, T. Toda, T. Yoshida & A. Shimizu in J. Plankton Res., 2006. [p.567, Fig. 4]. Issued from : T. Yoshiki, T. Toda, T. Yoshida & A. Shimizu in J. Plankton Res., 2006. [p.567, Fig. 4].
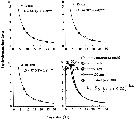
Egg development time of Calanus sinicus under high-pressure conditions compared with atmospheric pressure.
Nota: At atmospheric prssure, the egg development time obtained was fitted to the Belehràdek's function asindicated in Fig. 4, d), where D is the development time (days) and T is the temperature in °C.
The egg development times under different experimental pressure conditions (10, 50, and 100 atm) were similar to that at 1 atm (Fig.4 d). |
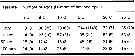 Issued from : T. Yoshiki, T. Toda, T. Yoshida & A. Shimizu in J. Plankton Res., 2006. [p.565, Table I]. Issued from : T. Yoshiki, T. Toda, T. Yoshida & A. Shimizu in J. Plankton Res., 2006. [p.565, Table I].
Experimental number of eggs, hatched eggs, and hatching success of Calanus sinicus at various temperature and pressure conditions. |
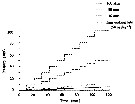 Issued from : T. Yoshiki, T. Toda, T. Yoshida & A. Shimizu in J. Plankton Res., 2006. [p.566, Fig. 3]. Issued from : T. Yoshiki, T. Toda, T. Yoshida & A. Shimizu in J. Plankton Res., 2006. [p.566, Fig. 3].
Experimental rate of pressure increase and egg sinking rate of Calanus sinicus. |
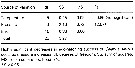 Issued from : T. Yoshiki, T. Toda, T. Yoshida & A. Shimizu in J. Plankton Res., 2006. [p.567, Table II]. Issued from : T. Yoshiki, T. Toda, T. Yoshida & A. Shimizu in J. Plankton Res., 2006. [p.567, Table II].
Two-way ANOVA without replication.
Nota: The hatching success of C. sinicus eggs at 1 atm was generally higher than 80 % within the temperature range from 5 to 25 °C. Under higher pressure conditions at 10, 50 and 100 atm, the hatching success ranged from 0 to 55, from 0 to 36, and from 0 to 21 %, respectively. Highly significant decreases in egg-hatching success of C. sinicus occurred as pressure increased. |
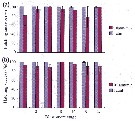 Issued from : T. Yoshiki, B. Yamanoha, T. Kikuchi, A. Shimizu & T. Toda in Mar. Biol., 2008, 156. [p.101, Fig.2]. Issued from : T. Yoshiki, B. Yamanoha, T. Kikuchi, A. Shimizu & T. Toda in Mar. Biol., 2008, 156. [p.101, Fig.2].
Egg hatching successes of Calanus sinicus.
Eggs were incubated at 10 atm/min (a) and 0.1 atm/min (b) pressurizing rate.
Control experiments were conduced at 1 atm. B Blastula stage and L Limb-bud stage before hatch. |
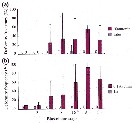 Issued from : T. Yoshiki, B. Yamanoha, T. Kikuchi, A. Shimizu & T. Toda in Mar. Biol., 2008, 156. [p.101, Fig.3]. Issued from : T. Yoshiki, B. Yamanoha, T. Kikuchi, A. Shimizu & T. Toda in Mar. Biol., 2008, 156. [p.101, Fig.3].
Deformity frequency of calanus sinicus eggs.
Eggs were incubated at 10 atm increased by 10 atm/min (a) and 0.1 atm/min (b)
Control experiments were conduced at 1 atm.
B Blastula stage and L Limb-bud stage before hatch.
0 Deformation was not observed.
* P < 0.05; there was significant difference statistically between 16-cell stages of two pressurizing rates. |
 Issued from : T. Yoshiki, B. Yamanoha, T. Kikuchi, A. Shimizu & T. Toda in Mar. Biol., 2008, 156. [p.104, Table 4]. Issued from : T. Yoshiki, B. Yamanoha, T. Kikuchi, A. Shimizu & T. Toda in Mar. Biol., 2008, 156. [p.104, Table 4].
Egg development time and egg sinking rate of three Calanus species. |
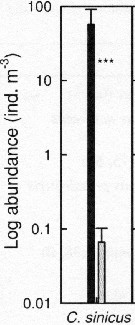 Issued from : S.-H. Hsiao, S. Kâ, T.-H. Fang & J.-S. Hwang inHydrobiologia, 2011, 666. [p.326, Fig.6]. Issued from : S.-H. Hsiao, S. Kâ, T.-H. Fang & J.-S. Hwang inHydrobiologia, 2011, 666. [p.326, Fig.6].
Variations in the most abundant copepod species (mean ± SE) along the transect in the boundary waters between the northern part Taiwan Strait and the East China Sea in March (black bar) and October (grey bar) 2005 (Mann-Whitney U test, sig. ***P <0.001. |
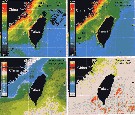 Issued from : S.-H. Hsiao, S. Kâ, T.-H. Fang & J.-S. Hwang inHydrobiologia, 2011, 666. [p.321, Fig.2]. Issued from : S.-H. Hsiao, S. Kâ, T.-H. Fang & J.-S. Hwang inHydrobiologia, 2011, 666. [p.321, Fig.2].
Monthly average sea surface chlorophyll a and temperatures (SSTs) derived from averages hourly recordings (AVHRRs) in March and October 2005. |
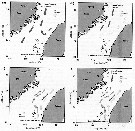 Issued from : S.-H. Hsiao, S. Kâ, T.-H. Fang & J.-S. Hwang inHydrobiologia, 2011, 666. [p.319, Fig.1]. Issued from : S.-H. Hsiao, S. Kâ, T.-H. Fang & J.-S. Hwang inHydrobiologia, 2011, 666. [p.319, Fig.1].
Schematic showing the Taiwan Strait circulation in a winter, b spring, c summer and d fall, after Jan & al. (2002).
|
 Issued from : H. Saito & A. Tsuda in Deep-Sea Res. I, 47. [p.2146, Table I]. Issued from : H. Saito & A. Tsuda in Deep-Sea Res. I, 47. [p.2146, Table I].
Egg diameter, carbon contents and prosome length (PL) of females of Calanus sinicus after Uye, 1988 and pers. comm.
Nota: Compare with N. cristatus and N. flemingeri and others species in genus Calanus. |
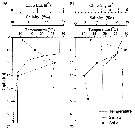 Issued from : K. Zhou, S. Sun, M. Wang, S. Wang & C. Li in Plankton Res., 2016, 38 (3). [p.555, Fig. 2]. Issued from : K. Zhou, S. Sun, M. Wang, S. Wang & C. Li in Plankton Res., 2016, 38 (3). [p.555, Fig. 2].
Vertical profiles of temperature, salinity and Chl a concentration in the Calanus sinicus sampling stations E6 and P1 in the Yellow Sea.
Station E6: 35°N, 123°E (coresponding to Yellow Sea Cold Water Mass) and P1: 30.5 °N, 123°E. |
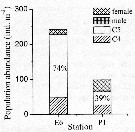 Issued from : K. Zhou, S. Sun, M. Wang, S. Wang & C. Li in Plankton Res., 2016, 38 (3). [p.556, Fig. 3, part.]. Issued from : K. Zhou, S. Sun, M. Wang, S. Wang & C. Li in Plankton Res., 2016, 38 (3). [p.556, Fig. 3, part.].
Calanus sinicus . Population abundance (ind./m3) and development stages in the sampling stations E6 and P1. Different developmental stages and genders are indicated by different shadings.
The proportions of C6 stage are indicated in the columns.
E6 and P1 in the Yellow Sea.
Station E6: 35°N, 123°E (coresponding to Yellow Sea Cold Water Mass) and P1: 30.5 °N, 123°E. |
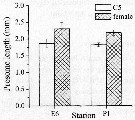 Issued from : K. Zhou, S. Sun, M. Wang, S. Wang & C. Li in Plankton Res., 2016, 38 (3). [p.556, Fig. 4, part.]. Issued from : K. Zhou, S. Sun, M. Wang, S. Wang & C. Li in Plankton Res., 2016, 38 (3). [p.556, Fig. 4, part.].
Calanus sinicus. Prosome lengths (PL, mm) of C5 stage and females in sampling stations E6 and P1.
Error bars show standard deviations.
Station E6: 35°N, 123°E (coresponding to Yellow Sea Cold Water Mass) and P1: 30.5 °N, 123°E.
Station E6: 35°N, 123°E (coresponding to Yellow Sea Cold Water Mass) and P1: 30.5 °N, 123°E. |
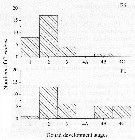 Issued from : K. Zhou, S. Sun, M. Wang, S. Wang & C. Li in Plankton Res., 2016, 38 (3). [p.556, Fig. 5, part.]. Issued from : K. Zhou, S. Sun, M. Wang, S. Wang & C. Li in Plankton Res., 2016, 38 (3). [p.556, Fig. 5, part.].
Calanus sinicus. The gonad development stages (GS1-4C) of females at sampling stations E6 and P1.
GS4 represented mature gonads of females, subdivided into three new categories GS4A,
GS4B and GS4C.
Nota: Most females at station E6 were immature and more females at station P1 were mature, they shared similar expression patterns of the gene VgR. Similar to decapods, two phases of vitellogenesis occur in copepods (See in Arnaud & al., 1982; Niehoff, 2007; Tiu & al., 2008; Thongda & al., 2015; Tiu & al., 2008; Roth & Khalaila, 2012; Klinbunga & al., 2015). Thus, the up-regulation of VgR expression of females at station E6 could suggest preparation for gonad maturity.
Favorable food conditions could support the final maturity of females, whereas the limited food would suppress gonad developme,t (Zhang & al., 2007; Wang and al., 2009) |
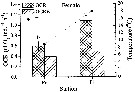 Issued from : K. Zhou, S. Sun, M. Wang, S. Wang & C. Li in Plankton Res., 2016, 38 (3). [p.557, Fig. 7, part.]. Issued from : K. Zhou, S. Sun, M. Wang, S. Wang & C. Li in Plankton Res., 2016, 38 (3). [p.557, Fig. 7, part.].
Calanus sinicus. Oxygen consumption rates (OCR, µlO2/ ind./h) of females and their estimations (OCRE) based on Ikeda & al. (2001) in the sampling stations E6 and P1.
The incubation temperatures (°C) are also shown.
Error bars show standard deviations. ''a'' and ''b'' indicate significant differences among stations (P<0.05). |
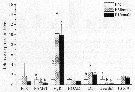 Issued from : K. Zhou, S. Sun, M. Wang, S. Wang & C. Li in Plankton Res., 2016, 38 (3). [p.558, Fig. 9]. Issued from : K. Zhou, S. Sun, M. Wang, S. Wang & C. Li in Plankton Res., 2016, 38 (3). [p.558, Fig. 9].
Calanus sinicus. Relative expression levels of seven genes of females at station E6 and P1 (marked as E6female and P1female, respectively), normalized to the geometric mean of three housekeeping genes (GAPDH, 16s, EF alpha 1)/ C5stage (E6C5à at station E6 are shown for comparison.
Error bars show standard deviations.
''a'' and ''b'' markers indicate significant differences among stations (P<0.05) for each gene;
Conclusion after Zhou & al. (p.560): << The physiological status of C5 stage and females of C. sinicus inside and outside the Yellow Sea Cold Water mass (16 August to 1 September 2013) in terms of their morphology, metabolic rate and gene expression patterns is shown for the first time.
A large oil sac, low metabolic rate, suppressed molting development and high expression of ferritin indicated that C5stage inside the Yellow Sea Cold water mass were in a quiescent stage, while females were not. During over-summering, C5stage up-regulated ferritin expression and down-regulated EcR to suppress development.
The stable environmental conditions inside the Yellow Sea Cild water Mass (i-e. low temperature and limited food supply) enabled the C5stage to remain quiescent. The C5stage near the edge of the Yellow Sea Cold Water Mass were in an intermediate state between quiescent and active. The elevated food conditions near the edge might trigger the arousal of the quiescent C5stage. These differences in the physiological processes and the associated gene expression patterns between quiescent and active copepods and their correlations with environmental factors provide a foundation for future studies of the dormancy of copepods >>. |
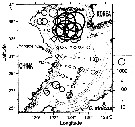 Issued from : T. Zuo, R. Wang, Ya-qu. Chen, Sh-wu Gao & Ke. Wang in J. Mar. Syst., 2006, 59. [p.169, Fig.9A]. Calanus sinicus Issued from : T. Zuo, R. Wang, Ya-qu. Chen, Sh-wu Gao & Ke. Wang in J. Mar. Syst., 2006, 59. [p.169, Fig.9A]. Calanus sinicus
Spatial of representative species abundance with isobaths shown in gray.
The circles are proportional in diameter to square root value of abundance.
Copepods collected vertically with plankton net (200 µm mesh aperture) from a depth near the bottom to the surface in autumn 2000 (18 October to 21 November).
Body length (mm): 3.10. |
| | | | Loc: | | | Gulf of Tonkin, China Seas (Bohai Sea, Yellow Sea, East China Sea, South China Sea, Hong Kong, Changjian River estuary, Xiamen Harbour, Jiaozhou Bay), Taiwan Strait, Taiwan (W, SW, NW, N, NE, off Danshuei River), Okinawa, Korea (W, S & E, Chunsu Bay, Asan Bay, Seomjin estuary, Yongsan River estuary Muan Bay), Geumo Is., Korea Strait, Japan Sea, Tsushima Straits, Japan (Ariake Bay, Kuchinoerabu Is., Nagasaki, Sagami Bay, Tokyo Bay, Inland Sea, Shimoda, Fukuyama, Kii Channel, Honshu: Suruga Bay, Seto Inland Sea, Seonaikai, south estuaries), off SE Japan, E Kuril Is. | | | | N: | 118 | | | | Lg.: | | | (125) F: 3,1-2,38; M: 2,8-2,45; (126) F: 3,6-2,15; M: 3,5-2,07; (131) F: 3,2-2,15; M: 3-2,7; (290) F: 3,5-2,7; M: 3,5-2,6; (866) F: 2,1-3,3; M: 2-3,5; {F: 2,10-3,60; M: 2,00-3,50}
The mean female size is 2.818 mm (n = 10; SD = 0.5914), and the mean male size is 2.812 (n = 10; SD = 0.5631). The size ratio (male : female) is 0.999 (n = 5; SD = 0.0435). | | | | Rem.: | Indépendemment du calcul de la production effectué par Huang & al., 1993 dans Inland Sea du Japon, cette espèce pourrait constituer un indicateur dans l'évolution climatique et son effet sur la température des eaux dans la Mer de Chine orientale, la Mer Jaune et les eaux côtières japonaises.
On observe qu' au sud de la Mer de Chine (Port de Xiamen), les dimensions de adultes sont maximales aux températures comprises entre 16-18 °C.
Voir aussi les remarques en anglais | | | Dernière mise à jour : 02/01/2021 | |
|
|
 Toute utilisation de ce site pour une publication sera mentionnée avec la référence suivante : Toute utilisation de ce site pour une publication sera mentionnée avec la référence suivante :
Razouls C., Desreumaux N., Kouwenberg J. et de Bovée F., 2005-2025. - Biodiversité des Copépodes planctoniques marins (morphologie, répartition géographique et données biologiques). Sorbonne Université, CNRS. Disponible sur http://copepodes.obs-banyuls.fr [Accédé le 28 novembre 2025] © copyright 2005-2025 Sorbonne Université, CNRS
|
|
|
|




;)
;)
;)
;)
;)
;)
;)
;)
;)
;)
;)
;)
;)
;)
;)
;)
;)
;)
;)
;)
;)
;)

;)
;)
;)
;)
;)
;)
;)
;)
;)
;)
;)
;)
;)
;)
;)
;)
;)
;)
;)
;)
;)
;)
;)
;)
;)
;)
;)
;)
;)
;)
;)
;)
;)
;)
;)
;)
;)